 Modern Economy, 2012, 3, 873-883 http://dx.doi.org/10.4236/me.2012.37110 Published Online November 2012 (http://www.SciRP.org/journal/me) The Role of R&D in Shaping Public Sector Typologies: An European Perspective Andrés Maroto1, Luis Rubalcaba2 1Economic Analysis: Economic Theory Department, Autonomous University of Madrid, Madrid, Spain 2Applied Economics Department, University of Alcalá, Madrid, Spain Email: andres.maroto@uam.es, luis.rubalcaba@uah.es Received June 22, 2012; revised July 28, 2012; accepted August 13, 2012 ABSTRACT One of functions of the modern public states fo r improv ing dynamism in the econ o mic system is the use of their support to cope with the market and systemic failures created in the innovation area: the R&D promoted by public administra- tions can be considered a dimension, among others, of their performance in society. This paper explores the relation- ships between the R&D promoted by public administrations and the different typologies of states from a European per- spective. The results show some similarities between the public sectors in terms of general characteristics such as per- formance or stability and the most R&D-oriented promoters. However, differences are found depending on indicators and types analyzed. The existence of large differences within each type of public sector is also confirmed. Results sug- gest the influence that pro-innovation profiles of public sectors might exert on general innovation system and perform- ance patterns in EU countries. Keywords: Public Sector; Typologies; R&D; Innovation; Europe 1. Introduction: R&D in New Public Sector’s Role Since mid-XX century public sectors have gaining im- portance in advanced economies developing social and economic functions in different ways, depending on his- torical traditions, administrativ e cu ltu res, inspiration s and development of welfare and growth. A third of the ser- vice employment created in Europe from the 1979 till 2007 has been generated in public sector. In Europe, many types of public states coexist with different sizes, socials roles, and performances. But, in the last 20 years all of them have something in common: th ey are seeking for modernization and performance. In this way some traditional functions are being be revised (e.g., better regulation actions to reduce enterprise burden and red tape, or measures to reduce interventionism in private markets) while others need to be reinforced (e.g., policies for growth, employment, productivity and innovation). One of key functions of the modernized public sectors for enforcing the economic system is the use of their support to cope with the market and systemic failures created in the innovation area: the R&D promoted by public administrations can be considered a dimension, among others, of their performance in society. Public sector research and innovation plays a key role in technological change and consequently in economic growth. In r ec ent years, a number of trends have emerged, heightening interest in the economic effects of public sector innovation and, specially, R&D both in policy and academic circles. One of the key factors of the downturn of economic growth in the European Union in the after- math of the Lisbon Council of 2000 is the structural na- ture of the EU’s innovation systems and processes. If innovation is the process of gene rating and applying n ew ideas that raise living standards, create new growth in- dustries, and improve the way institutions operate—then public sector will determine EU’s success or failure in the innovation endeavor as much as the private sector, since the justification o f public sector to face market and systemic failures in innovation are widely recognized (see, for example, Arrow, 1962 [1]; Griffith, 2000 [2]; OECD, 2002 [3]; Mowery and Sampat, 2002 [4 ]). Although in that period labor apparent productivity of public administrations as such performed well in the EU (European Commission , 2005 [5]; Maro to and Rub alcaba, 2008 [6]), the qu estion is if the curr ent size, structure and functioning of European public sector is efficient enough to produce positive impacts throughout the whole econ- omy. In terms of policy, the empirical results stresses that the EU’s innovation system needs to be drastically re- formed if the EU is to make a decisive shift towards re- alizing the broad features of which have been laid out in the Lisbon 2010 agenda. A structural reform and institu- C opyright © 2012 SciRes. ME  A. MAROTO, L. RUBALCABA 874 tional change, and an emphasis on competitive ness that is based on science and on knowledge is a prerequisite for the Union to catch up with the United States and the dy- namic Asian economies, and public sector has a key role in this process. A recent research of the US Council on Competi- tiveness (2005) [7] explains the reasons why. Public sec- tor sets the framework by which private entities inno- vate—as a regulator, an investor, a purchaser or a partner. Consider just a few public sector activities and their im- pact on putting new ideas into practice, such as research investment, education policy, intellectual property pro- tection or infrastructure investment. Clearly, th e capacity of the private sector to innovate relies heavily on public sector practices. Government also determines countries’ innovation potential because the public sector accounts for a major portion of our society’s activities1. Such an enormous swath of activity must be productive and effi- cient—it must be innovative—if EU countries are to prosper and compete in the global arena of 21st century. Improving the performance of the public sector in terms of innovation is a goal that is high on the policy agenda in almost all European countries. Public policies play a key role in sh aping competitiveness and growth in the economy. Due to the size of government activity, performance and efficiency in the public sector is an im- portant determinant of aggregate economic performance at the national level. Secondly, the organization and functioning of governments affects the private sector via three main channels through which government action can have an impact: taxation (that distorts relative prices in the economy and thus influence economic incentives such as the willingness to work, to invest or to engage in entrepreneurial activities), public spending on areas such as education, R&D or infrastructure; and regulations (that limit the choices which individuals and enterprises can make), and the state of efficiency and modernization in the provision of public services (a high-performing administration will produce positive direct and indirect impacts in the economy as a whole). Some of the public sector actions produce contradict- tory effects in the economy, causing debate among re- searchers and policy-makers. For example, cross-country studies investigatin g the role of public capital in explain- ing productivity growth differentials provide no clear conclusions: while many of them find a positive impact, the effect is often not significant. For both education and R&D, the case for the public sector involvement is often based on the existence of externalities. There is econo- metric evidence suggesting the R&D performed by pub- lic sector could have stronger impacts on economic per- formance than business R&D (Griliches, 1992 [8]; Grif- fith, 2000 [2]). The extent to which public research can strengthen it depends also on the exploitation of the re- sults in the business sector. Finally, some papers con- clude that public R&D has to some extent taken the place of private research rather than adding to it (David, Hall and Toole, 2000 [9]); however, most available studies do not find such substitution effects. Furthermore, the public sector is not only a performer of R&D, but also an important source of R&D funding in the business sector. The gap in private research invest- ment between the EU and the US2 has alarming cones- quences for the long-term potential for innovation, growth and productivity performance. For this reason, the European Council in Barcelona 2000 decided to strive to increase gross expenditures on R&D to 3 per- cent of GDP in the EU by 2010 with industry contribut- ing two-thirds of the total amount of R&D expenditures (European Commission, 2003). Public R&D and pro- grams for boosting innovation can be one of the most powerful instruments to overcome deficits and achieve competitive goals. Public sector innovation, therefore, is directly related to economic prosperity and tightly linked to whether governments will meet their greatest national challenges in areas such as education or research and development. Following these ideas, the aim of this paper is twofold: to identify public sector typologies in Europe, upon which R&D can play a significant role, and to analyze if R&D performance in EU countries differs according to the structure, organization and typology of public admini- stration. A final discussion is made exploring the influ- ence that public innovation might exert on general per- formance patterns in EU public sectors. 2. Public Sectors in Europe: Shaping Typologies and Impacts of Reforms in R&D The modern public sector is a consequence of a long and even controversial process where different organiza- tional models, sizes and profiles have been evolved. Pub- lic sector really has a great economic and social impor- tance all over market economies, but even much more within the European Union. This fact becomes an eco- nomic achievement, and shows the EU trying to get the right balance between high social protection levels and income redistribution processes, what sometimes involve a certain trade-off between economic growth and income 2Expenditures on business sector R&D as a percentage of GDP in the EU-15 (1.22 percent in 2007) lag significantly behind the US (1.93 per- cent in 2007) and Japan (2.68 percent in 2007) whereas there is virtu- ally no gap in terms of public R&D expenditures (including the gov- ernment and higher education sector ones). 1In Sweden, which has the highest share of government employment in EU-15 in 2007, one out of three jobs is in the government sector. The etherlands has the smallest share of government employment in 2007, one tenth of all obs. Copyright © 2012 SciRes. ME  A. MAROTO, L. RUBALCABA 875 distribution. More recently, some other debates are in the center of discussion about the modern role of States; for example, the debate about comple mentarities or substitu- tions between public and private (crowding out effects included); the debate about the conflict between Welfare State and competitiv eness or the debate on modernization and innovation of public sector. The public sector in the economies of the advanced countries, and among them the European ones, fulfills nowadays one two-fold mission: it is creative and re- sponsible of the institutional frame in which they op erate the individuals and also an authority that take part ac- tively in the economic processes correcting the results that would obtain the markets. Traditionally, it has been denominated “arrangement policy” to the first role, and “process policy” to the second one. In order to take care of both tasks, the public sector uses three generic instru- ments: regulations, public property, and state companies. One of the main roles that the pu b lic sector takes at th e present time is to develop all the activities that the Wel- fare State implies, which means the displacement of cer- tain areas of the social conflict to the sphere of public action. In a strand of the literature, the performance of welfare states is linked to their institutions. A typology aims to explain the performance of national institutions for in the light of their key characteristics. One well- known typology of institutions for social protection found in welfare states was developed by Esping-An- dersen (1990) [10]. Before that, between 1960 and 1975 the three great models of European Keynesian Welfare State are based. Titmuss in 1974 [11] had laid the way towards the consideration of three models differentiated of social protection in advanced Capitalist states. Esp- ing-Andersen retakes this proposal and builds a very in- fluential three-poled typology. In his approach, the de- fining characteristic of welfare states is the generosity and accessibility of government programs designed to protect the citizenry against loss of income and poverty. Each type is different in terms of the regulation of labor markets (primary protection) and the level and scope of income guarantees (secondary protection). He distin- guished, in particular, a Nordic or socialist model (with Sweden like paradigm), a Continental or Christian De- mocrat model (Germany) and an Anglo-Saxon or liberal model (United Kingdom). Eastern countries emerge as a separate type of welfare state (SCP/CERP, 2004 [12]), while some authors—such as Castles (1995) [13] or Rhodes (1997) [14]—describe an alternative model for Southern or Mediterranean countries. Recent studies complement these typologies. Differ- ences in administrative culture have a major impact both on fundamental choices concerning the structure of the public sector, and on the daily functioning of the gov- ernment apparatus. Administrative culture forms part of a wider political and social culture. Hofstede’s dimensions are probably the best-known categorization of adminis- trative cultures (Hofstede, 1980 [15]), although other attempts have been made (Mamadouh, 1999 [16]). It is clearly no simple matter to group countries on the basis of their administrative culture. Loughlin (1994) [17] groups countries on the basis of broad philosophical and cultural traditions. He distinguishes an Anglo-Saxon (minimal state), a Germanic-organicist and a French Na- poleonic state tradition. The Scandinavian type is a mix of the first two. Finally, Hooghe (2002) [18] used four dimensions developed by Page (1995) [19]—cohesion, autonomy from political control, caste-like character and non-permeability of external interest—to construct and index of “Weberian bureaucratic tradition” (strong, me- dium, weak), indicating to what degree a national admin- istrative culture corresponds to the Weberian model (strong cohesion, large degree of autonomy from politi- cal control, strong caste-like character of the bureaucracy and low permeability of external interests). Other studies have attempted to find a relationship between key demographic indicators and the institutions of welfare states. For example, Mellens (1999) [20] tried to relate birth rate, migration, family formation and the death rate to dominant socio-economic (level of income, educational attainment and health status of the population) and cultural treats of welfare states (gender equality, conservatism, individualism and post-modernism). In summary, five groups of states can be distinguished in Europe according to all these characteristics (see Ta- ble 1). These country-clusters are the Scandinavian or Northern European, the Mediterranean or Southern Eu- ropean, the Continental or Western European, the Anglo- Saxon, and the Eastern European. Countries differ in terms of system characteristics, resource use and per- formance of the public sector (this public performance will be analyzed in detail in the next section). Neverthe- less, it is possible to group European countries in to these clusters that take account of each of those dimensions. These clusters are almost entirely consistent with gener- ally accepted geographical/historical classifications of countries in Europe. After the rapid expansion of the welfare state in the 50s and 60s, the public sector has been under consider- able pressure in the past few decades. Declining public confidence in government institutions and growing de- mands on public finances have prompted governments to initiate measures to trim the public sector and make it more efficient and effective. Thus, after the great crisis in the 80s, a “new” state was being built during the 90s in the European Union. The objective of these new public administration management theories is to build a state that responds to the needs of its citizens, a democratic state where bureaucrats respnd accountably to politi- o Copyright © 2012 SciRes. ME  A. MAROTO, L. RUBALCABA Copyright © 2012 SciRes. ME 876 Table 1. Typology of states in Europe. Scandinavian or Northern European Mediterranean or Southern European Continental or Western European Anglo-Saxon Eastern European (a) According to general and socio economic characteristics Administrative culture 1 Public interest No clear Rule of law Public interest Transition Insipration 6 Socialism Mix Christian-democraticLiberal Post-communist State tradition 2 Mixture of Germ anic and French French Napoleonic Germanic or organicistAnglo-Saxon Communist Type of administration 3 Medium medium-weak medium-weak* strong Strong/weak Social 4 Medium ageing, high crime rate High ageing, low crime rate Medium ageing, medium crime rate Low ageing, mi x e d crime rate Low ageing, low crime rate Economic 4 Average GDP per capita, average economic growth Low GDP per capita, high economic growth Average GDP per capita, low economic growth High GDP per capita, average economic growth Low GDP per capita, high economic growth (b) According to public sector characteristics General characteristics High size, high quality and high confidence Low size, low-medium quality and low-medium confidence Mixed size, medium quality and medium-high confidence Medium size, medium-high quality and average confidence Low-medium size, low-medium quality and low-medium confidence Public Service sector characteristics 4 Low private share, public orientation, less repressive, Beveridge type, uniform education and adversarial criminal law system Low-medium private share, average repressive, Beveridge type, medium differentiated education Medium private share, public orientation, less-average repressive, Bismarck type, differentiated education and inquisitorial law system Medium-high private share, mixed repressive, Beveridge type, low-medium differentiated education Medium-high private share, Bismarck type, low-medium differentiated education PS performance 5 Medium-high overall performance, medium-high in education, high in health care, low overall efficiency Low overall performance, low in education, medium-high in health care, medium overall efficiency Medium-high overall performance, medium-high in education, high in health care, low overall efficiency Medium overall performanc e, high in education, medium-high in health care, high overall efficiency Medium-low overall performance, low-medium in education, ow-medium in health care, medium-low overall efficiency (c) According to social protection systems Referring system 6 Redistribution (equality) Household attendanceSecurity Attendance Transition towards Civil Society Secondary protection (income guarantees) 6 High social expenditure level, impositive financing structure, universal cover and social right of citizens like criterion for access Low social expenditure level, impositive (taxes) financing structure, universal cover and labour belonging like criterion for access Average social expenditure level, contributively financing structure, selective cover and labour belonging like criterion for access Low expenditure level, impositive (taxes) financing structure, selective cover and need like criterion for access Medium social expenditure level, impositive financing structure, universal cover and social right of citizens like criterion for access Primary protection (labour market conditions) 6 Average regulative density, very centralized and coordinated collective agreements structure, high cover rate of these agreements, very high union affiliation density Highly regulated system. Intermediate systems for collective agreements and centralisation. Rigidity and black labour. Low union affiliation density High regulative density, less centralized and by sector collective agreements structure, very high cover rate of these agreements, average union affiliation density Low regulative density, decentralized and by company collective agreements structure, average-high cover rate of these agreements, high uni on affiliation density Transition systems from fully regulated markets towards liberal markers Very centralized and coordinated collective agreements structure, high cover rate of these agreements, very high union affiliation density 1Pollit and Bouckaert (2004); 2Louhglin (1994); 3Hooghe (2002); 4SCP/CERP (2004); 5Afonso et al. (2 003); 6Maroto and Rubalcaba (2006); *With the excep - on of France (strong). ti 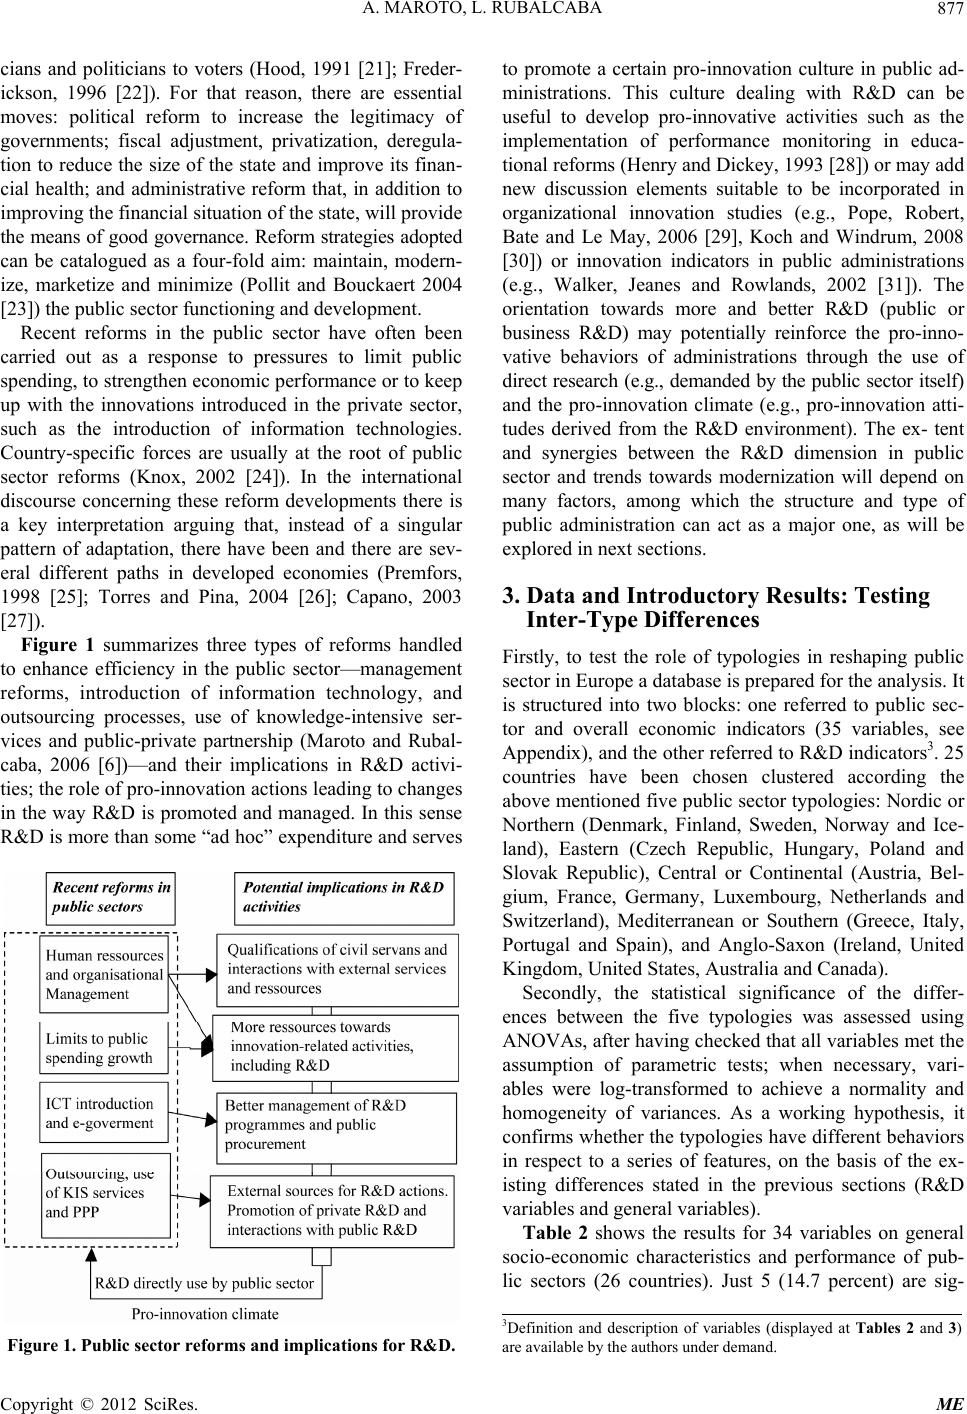 A. MAROTO, L. RUBALCABA 877 cians and politicians to voters (Hood, 1991 [21]; Freder- ickson, 1996 [22]). For that reason, there are essential moves: political reform to increase the legitimacy of governments; fiscal adjustment, privatization, deregula- tion to reduce the size of the state and improve its finan- cial health; and administrative reform that, in addition to improving the financial situation of the state, will provide the means of good governance. Reform strategies adopted can be catalogued as a four-fold aim: maintain, modern- ize, marketize and minimize (Pollit and Bouckaert 2004 [23]) the public sector functioning and development. Recent reforms in the public sector have often been carried out as a response to pressures to limit public spending, to strengthen economic performance or to keep up with the innovations introduced in the private sector, such as the introduction of information technologies. Country-specific forces are usually at the root of public sector reforms (Knox, 2002 [24]). In the international discourse concerning these reform developments there is a key interpretation arguing that, instead of a singular pattern of adaptation, there have been and there are sev- eral different paths in developed economies (Premfors, 1998 [25]; Torres and Pina, 2004 [26]; Capano, 2003 [27]). Figure 1 summarizes three types of reforms handled to enhance efficiency in the public sector—management reforms, introduction of information technology, and outsourcing processes, use of knowledge-intensive ser- vices and public-private partnership (Maroto and Rubal- caba, 2006 [6])—and their implications in R&D activi- ties; the role of pro-innovation actions leading to chang es in the way R&D is promoted and managed. In this sense R&D is more than some “ad hoc” expenditure and serves Figure 1. Public sector reforms and implications for R&D. to promote a certain pro-innovation culture in public ad- ministrations. This culture dealing with R&D can be useful to develop pro-innovative activities such as the implementation of performance monitoring in educa- tional reforms (Henr y and Dickey, 1993 [28]) or may add new discussion elements suitable to be incorporated in organizational innovation studies (e.g., Pope, Robert, Bate and Le May, 2006 [29], Koch and Windrum, 2008 [30]) or innovation indicators in public administrations (e.g., Walker, Jeanes and Rowlands, 2002 [31]). The orientation towards more and better R&D (public or business R&D) may potentially reinforce the pro-inno- vative behaviors of administrations through the use of direct research (e.g., demanded by the public sector itself) and the pro-innovation climate (e.g., pro-innovation atti- tudes derived from the R&D environment). The ex- tent and synergies between the R&D dimension in public sector and trends towards modernization will depend on many factors, among which the structure and type of public administration can act as a major one, as will be explored in next sections. 3. Data and Introductory Results: Testing Inter-Type D i ff e r en c e s Firstly, to test the role of typologies in reshaping public sector in Europe a database is prepared for the analysis. It is structured into two blocks: one referred to public sec- tor and overall economic indicators (35 variables, see Appendix), and the other referred to R&D indicators3. 25 countries have been chosen clustered according the above mentioned five public sector typologies: Nordic or Northern (Denmark, Finland, Sweden, Norway and Ice- land), Eastern (Czech Republic, Hungary, Poland and Slovak Republic), Central or Continental (Austria, Bel- gium, France, Germany, Luxembourg, Netherlands and Switzerland), Mediterranean or Southern (Greece, Italy, Portugal and Spain), and Anglo-Saxon (Ireland, United Kingdom, United States, Australia and Canada). Secondly, the statistical significance of the differ- ences between the five typologies was assessed using ANOVAs, after having checked that all variables met the assumption of parametric tests; when necessary, vari- ables were log-transformed to achieve a normality and homogeneity of variances. As a working hypothesis, it confirms whether the typologies have different behaviors in respect to a series of features, on the basis of the ex- isting differences stated in the previous sections (R&D variabl e s an d general variables). Table 2 shows the results for 34 variables on general socio-economic characteristics and performance of pub- lic sectors (26 countries). Just 5 (14.7 percent) are sig- 3Definition and description of variables (displayed at Tables 2 and 3) are available by the authors under demand. Copyright © 2012 SciRes. ME 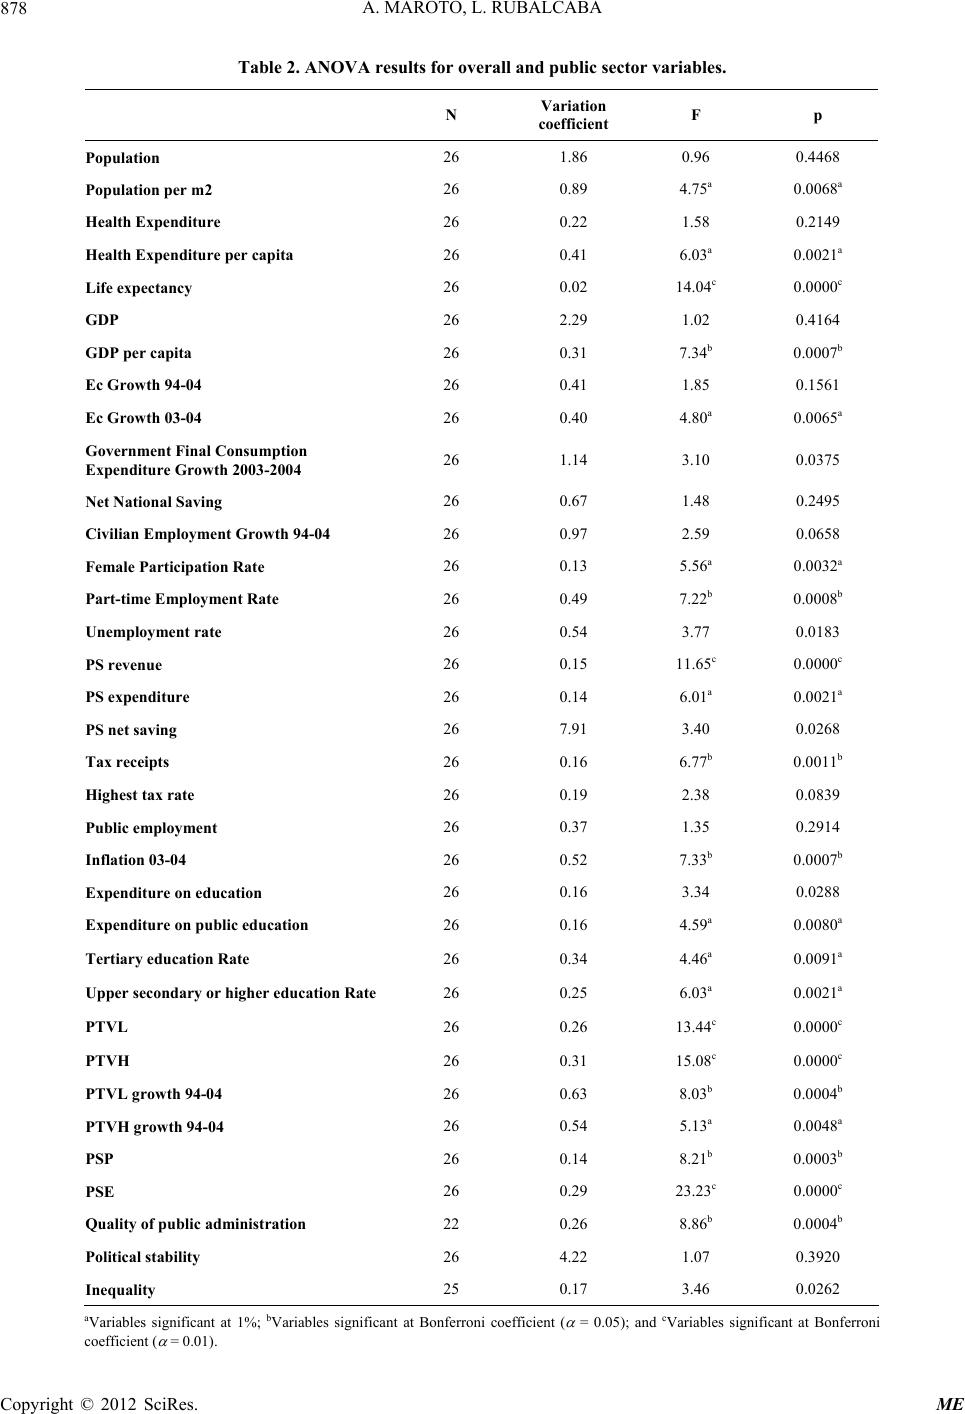 A. MAROTO, L. RUBALCABA 878 Table 2. ANOVA results for overall and public sector variables. N Variation coefficient F p Population 26 1.86 0.96 0.4468 Population per m2 26 0.89 4.75a 0.0068a Health Expenditure 26 0.22 1.58 0.2149 Health Expenditure per capita 26 0.41 6.03a 0.0021a Life expectancy 26 0.02 14.04c 0.0000c GDP 26 2.29 1.02 0.4164 GDP per capita 26 0.31 7.34b 0.0007b Ec Growth 94-04 26 0.41 1.85 0.1561 Ec Growth 03-04 26 0.40 4.80a 0.0065a Government Final Consumption Expenditure Growth 2003-2004 26 1.14 3.10 0.0375 Net National Saving 26 0.67 1.48 0.2495 Civilian Employment Growth 94-04 26 0.97 2.59 0.0658 Female Participation Rate 26 0.13 5.56a 0.0032a Part-time Employment Rate 26 0.49 7.22b 0.0008b Unemployment rate 26 0.54 3.77 0.0183 PS revenue 26 0.15 11.65c 0.0000c PS expenditure 26 0.14 6.01a 0.0021a PS net saving 26 7.91 3.40 0.0268 Tax receipts 26 0.16 6.77b 0.0011b Highest tax rate 26 0.19 2.38 0.0839 Public employment 26 0.37 1.35 0.2914 Inflation 03-04 26 0.52 7.33b 0.0007b Expenditure on education 26 0.16 3.34 0.0288 Expenditure on public education 26 0.16 4.59a 0.0080a Tertiary education Rate 26 0.34 4.46a 0.0091a Upper secondary or higher education Rate 26 0.25 6.03a 0.0021a PTVL 26 0.26 13.44c 0.0000c PTVH 26 0.31 15.08c 0.0000c PTVL growth 94-04 26 0.63 8.03b 0.0004b PTVH growth 94-04 26 0.54 5.13a 0.0048a PSP 26 0.14 8.21b 0.0003b PSE 26 0.29 23.23c 0.0000c Quality of public administration 22 0.26 8.86b 0.0004b Political stability 26 4.22 1.07 0.3920 Inequality 25 0.17 3.46 0.0262 aVariables significant at 1%; bVariables significant at Bonferroni coefficient ( = 0.05); and cVariables significant at Bonferroni coefficient ( = 0.01). Copyright © 2012 SciRes. ME 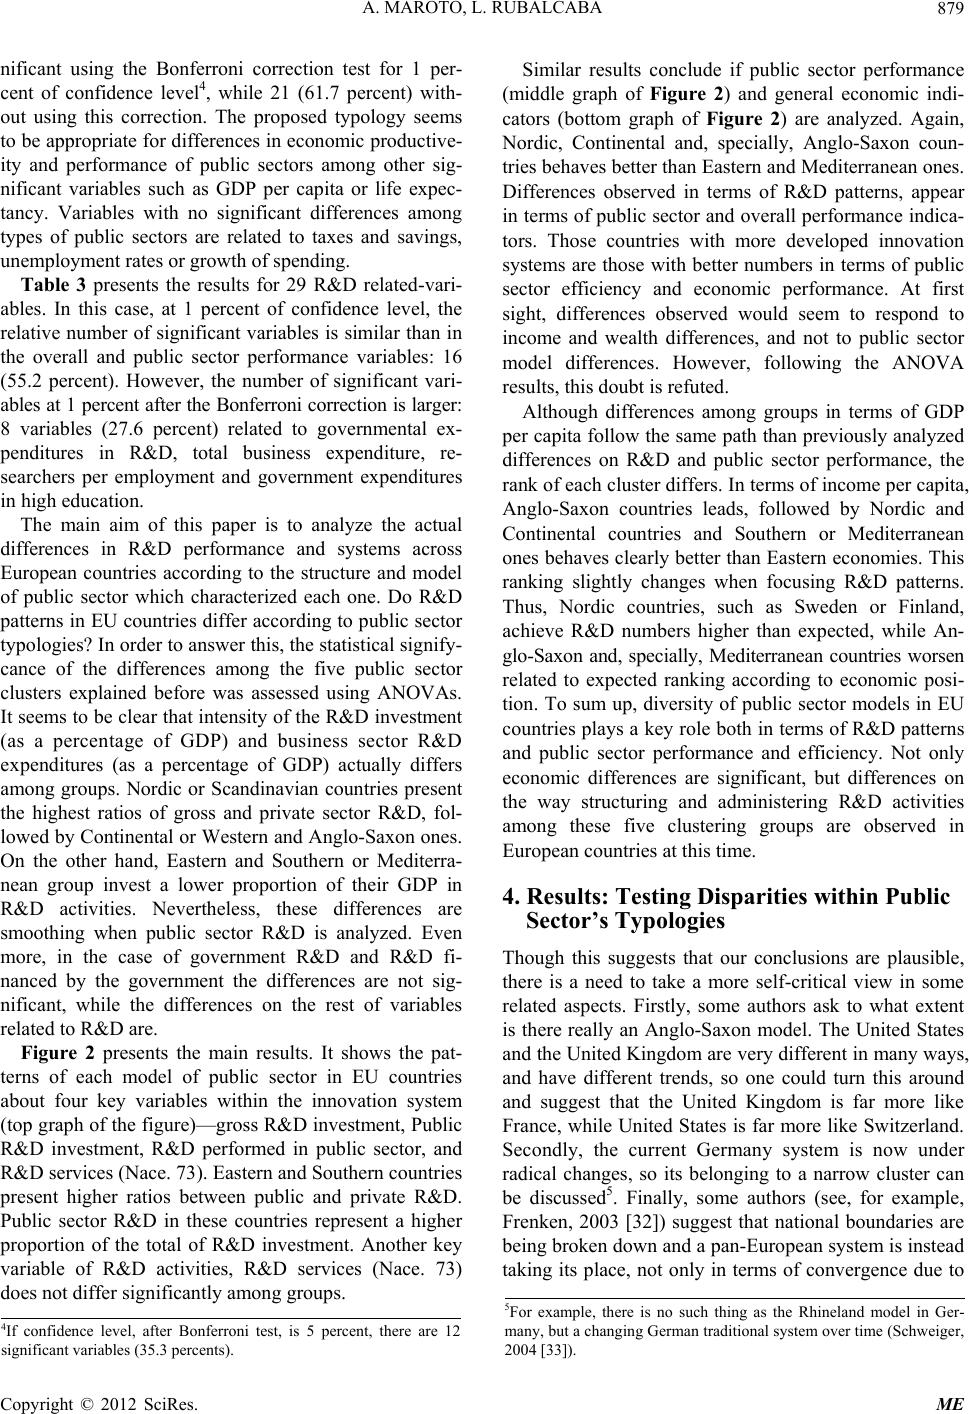 A. MAROTO, L. RUBALCABA 879 nificant using the Bonferroni correction test for 1 per- cent of confidence level4, while 21 (61.7 percent) with- out using this correction. The proposed typology seems to be appropriate for differences in economic productive- ity and performance of public sectors among other sig- nificant variables such as GDP per capita or life expec- tancy. Variables with no significant differences among types of public sectors are related to taxes and savings, unemployment rates or growth of spending. Table 3 presents the results for 29 R&D related-vari- ables. In this case, at 1 percent of confidence level, the relative number of significant variables is similar than in the overall and public sector performance variables: 16 (55.2 percent). However, the number of significant vari- ables at 1 percent after the Bonferroni correction is larger: 8 variables (27.6 percent) related to governmental ex- penditures in R&D, total business expenditure, re- searchers per employment and government expenditures in high education. The main aim of this paper is to analyze the actual differences in R&D performance and systems across European countries according to the structure and model of public sector which characterized each one. Do R&D patterns in EU countries differ according to public sector typologies? In order to answer this, the statistical signify- cance of the differences among the five public sector clusters explained before was assessed using ANOVAs. It seems to be clear that intensity of the R&D investment (as a percentage of GDP) and business sector R&D expenditures (as a percentage of GDP) actually differs among groups. Nordic or Scandinavian countries present the highest ratios of gross and private sector R&D, fol- lowed by Continental or Western and Anglo-Saxon ones. On the other hand, Eastern and Southern or Mediterra- nean group invest a lower proportion of their GDP in R&D activities. Nevertheless, these differences are smoothing when public sector R&D is analyzed. Even more, in the case of government R&D and R&D fi- nanced by the government the differences are not sig- nificant, while the differences on the rest of variables related to R&D are. Figure 2 presents the main results. It shows the pat- terns of each model of public sector in EU countries about four key variables within the innovation system (top graph of the figure)—gross R&D investment, Public R&D investment, R&D performed in public sector, and R&D services (Nace. 73). Eastern and Southern countries present higher ratios between public and private R&D. Public sector R&D in these countries represent a higher proportion of the total of R&D investment. Another key variable of R&D activities, R&D services (Nace. 73) does not differ signi ficantly among gro ups. Similar results conclude if public sector performance (middle graph of Figure 2) and general economic indi- cators (bottom graph of Figure 2) are analyzed. Again, Nordic, Continental and, specially, Anglo-Saxon coun- tries behaves better than Eastern and Mediterran ean ones. Differences observed in terms of R&D patterns, appear in terms of public sector and overall performance indica- tors. Those countries with more developed innovation systems are those with better numbers in terms of public sector efficiency and economic performance. At first sight, differences observed would seem to respond to income and wealth differences, and not to public sector model differences. However, following the ANOVA results, this doubt is refuted. Although differences among groups in terms of GDP per capita follow the same path than previously analyzed differences on R&D and public sector performance, the rank of each cluster differs. In terms of income per capita, Anglo-Saxon countries leads, followed by Nordic and Continental countries and Southern or Mediterranean ones behaves clearly better than Eastern economies. This ranking slightly changes when focusing R&D patterns. Thus, Nordic countries, such as Sweden or Finland, achieve R&D numbers higher than expected, while An- glo-Saxon and, specially, Mediterranean countries worsen related to expected ranking according to economic posi- tion. To sum up, diversity of public sector models in EU countries plays a key role both in terms of R&D patterns and public sector performance and efficiency. Not only economic differences are significant, but differences on the way structuring and administering R&D activities among these five clustering groups are observed in European countries at this time. 4. Results: Testing Disparities within Public Sector’s Typologies Though this suggests that our conclusions are plausible, there is a need to take a more self-critical view in some related aspects. Firstly, some authors ask to what extent is there really an Anglo-Saxon model. The United States and the United Kingdom are very different in many ways, and have different trends, so one could turn this around and suggest that the United Kingdom is far more like France, while United States is far more like Switzerland. Secondly, the current Germany system is now under radical changes, so its belonging to a narrow cluster can be discussed5. Finally, some authors (see, for example, Frenken, 2003 [32]) suggest that national boundaries are being broken down and a pan-European system is instead taking its place, not only in erms of convergence due to t 5For example, there is no such thing as the Rhineland model in Ger- many, but a changing German traditional system over time (Schweiger, 2004 [33]). 4If confidence level, after Bonferroni test, is 5 percent, there are 12 significant variables (35.3 percents). Copyright © 2012 SciRes. ME 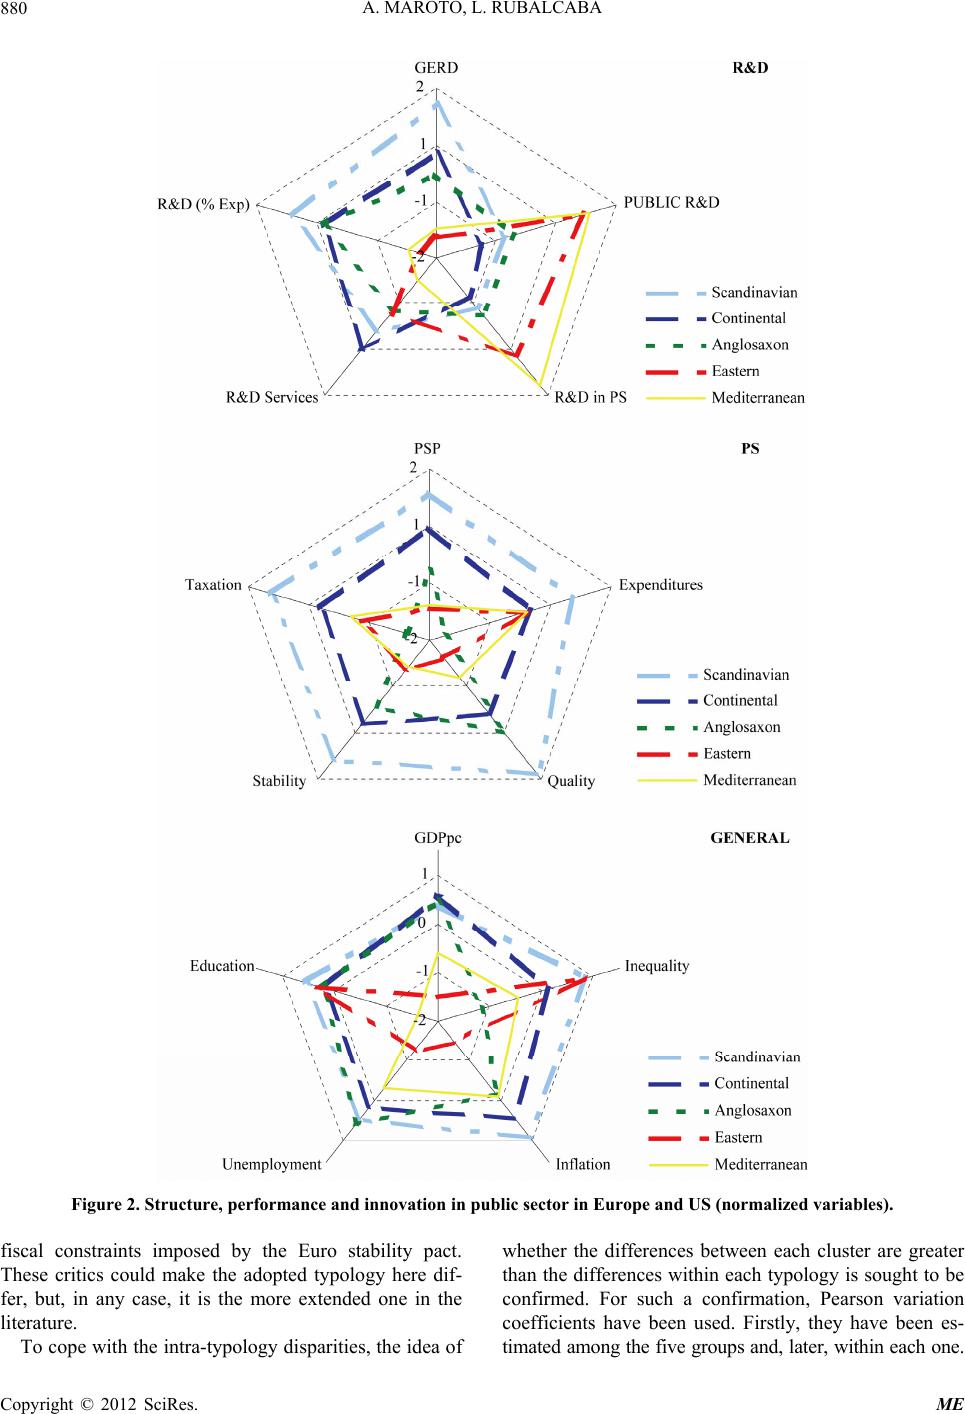 A. MAROTO, L. RUBALCABA 880 Figure 2. Structure, performance and innovation in public sector in Europe and US (normalized variables). fiscal constraints imposed by the Euro stability pact. These critics could make the adopted typology here dif- fer, but, in any case, it is the more extended one in the literature. To cope with the intra-typolog y disparities, the idea of whether the differences between each cluster are greater than the differences within each typology is sought to be confirmed. For such a confirmation, Pearson variation coefficients have been used. Firstly, they have been es- timated among the five groups and, later, within each one. Copyright © 2012 SciRes. ME 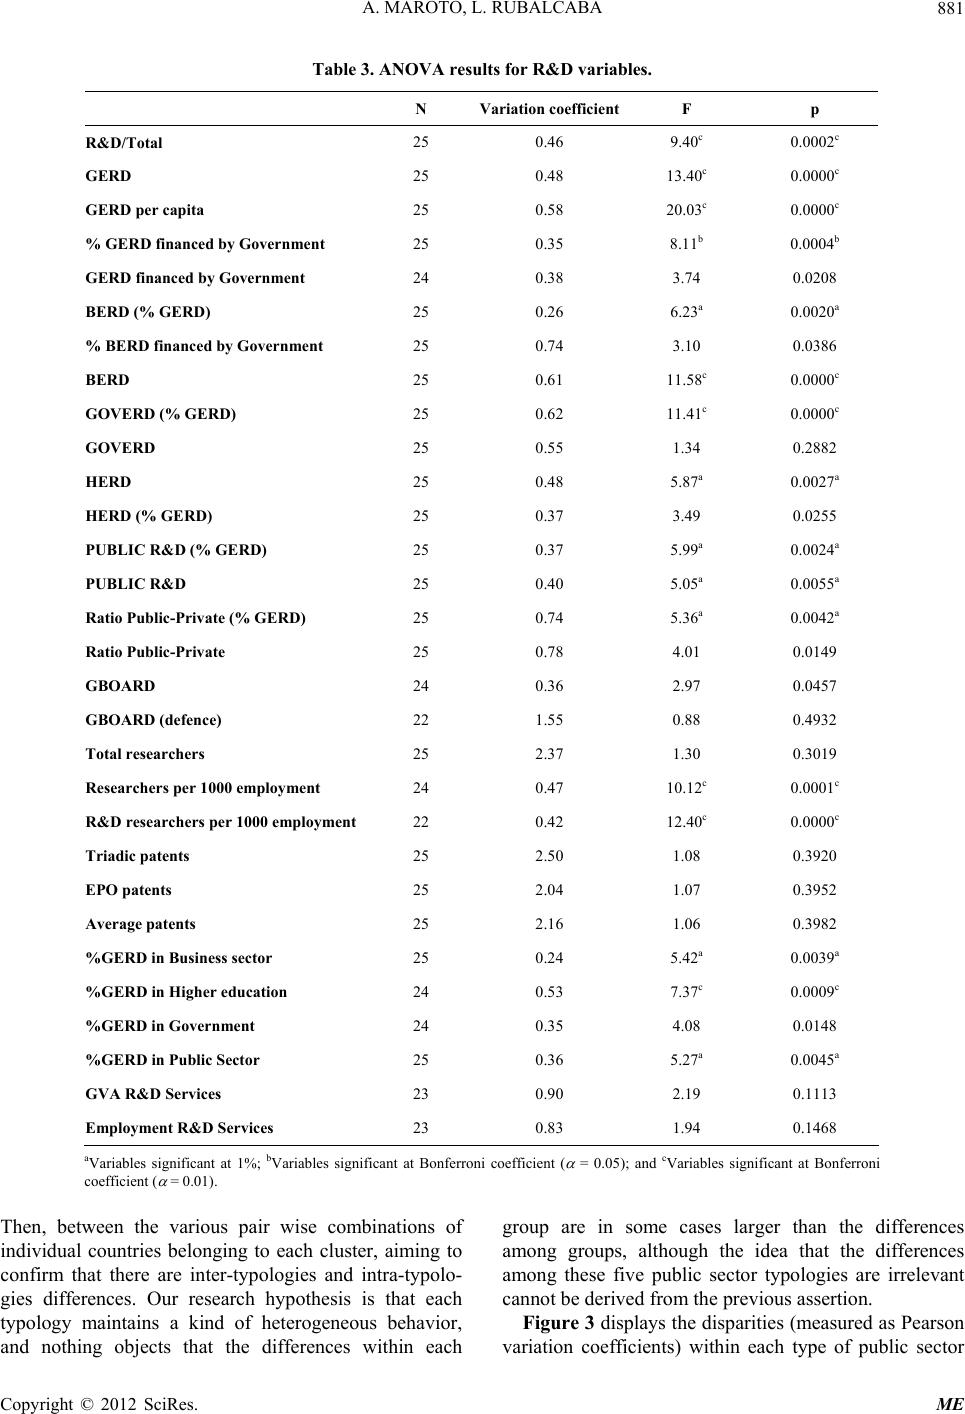 A. MAROTO, L. RUBALCABA 881 Table 3. ANOVA results for R&D variables. N Variation coefficientF p R&D/Total 25 0.46 9.40c 0.0002c GERD 25 0.48 13.40c 0.0000c GERD per capita 25 0.58 20.03c 0.0000c % GERD financed by Government 25 0.35 8.11b 0.0004b GERD financed by Government 24 0.38 3.74 0.0208 BERD (% GERD) 25 0.26 6.23a 0.0020a % BERD financed by Government 25 0.74 3.10 0.0386 BERD 25 0.61 11.58c 0.0000c GOVERD (% GERD) 25 0.62 11.41c 0.0000c GOVERD 25 0.55 1.34 0.2882 HERD 25 0.48 5.87a 0.0027a HERD (% GERD) 25 0.37 3.49 0.0255 PUBLIC R&D (% GERD) 25 0.37 5.99a 0.0024a PUBLIC R&D 25 0.40 5.05a 0.0055a Ratio Public-Private (% GERD) 25 0.74 5.36a 0.0042a Ratio Public-Private 25 0.78 4.01 0.0149 GBOARD 24 0.36 2.97 0.0457 GBOARD (defence) 22 1.55 0.88 0.4932 Total researchers 25 2.37 1.30 0.3019 Researchers per 1000 employment 24 0.47 10.12c 0.0001c R&D researchers per 1000 employment 22 0.42 12.40c 0.0000c Triadic patents 25 2.50 1.08 0.3920 EPO patents 25 2.04 1.07 0.3952 Average patents 25 2.16 1.06 0.3982 %GERD in Business sector 25 0.24 5.42a 0.0039a %GERD in Higher education 24 0.53 7.37c 0.0009c %GERD in Government 24 0.35 4.08 0.0148 %GERD in Public Sector 25 0.36 5.27a 0.0045a GVA R&D Services 23 0.90 2.19 0.1113 Employment R&D Services 23 0.83 1.94 0.1468 aVariables significant at 1%; bVariables significant at Bonferroni coefficient ( = 0.05); and cVariables significant at Bonferroni coefficient ( = 0.01). Then, between the various pair wise combinations of individual countries belonging to each cluster, aiming to confirm that there are inter-typologies and intra-typolo- gies differences. Our research hypothesis is that each typology maintains a kind of heterogeneous behavior, and nothing objects that the differences within each group are in some cases larger than the differences among groups, although the idea that the differences among these five public sector typologies are irrelevant cannot be derived from the previous assertion. Figure 3 displays the disparities (measured as Pearson variation coefficients) within each type of public sector Copyright © 2012 SciRes. ME 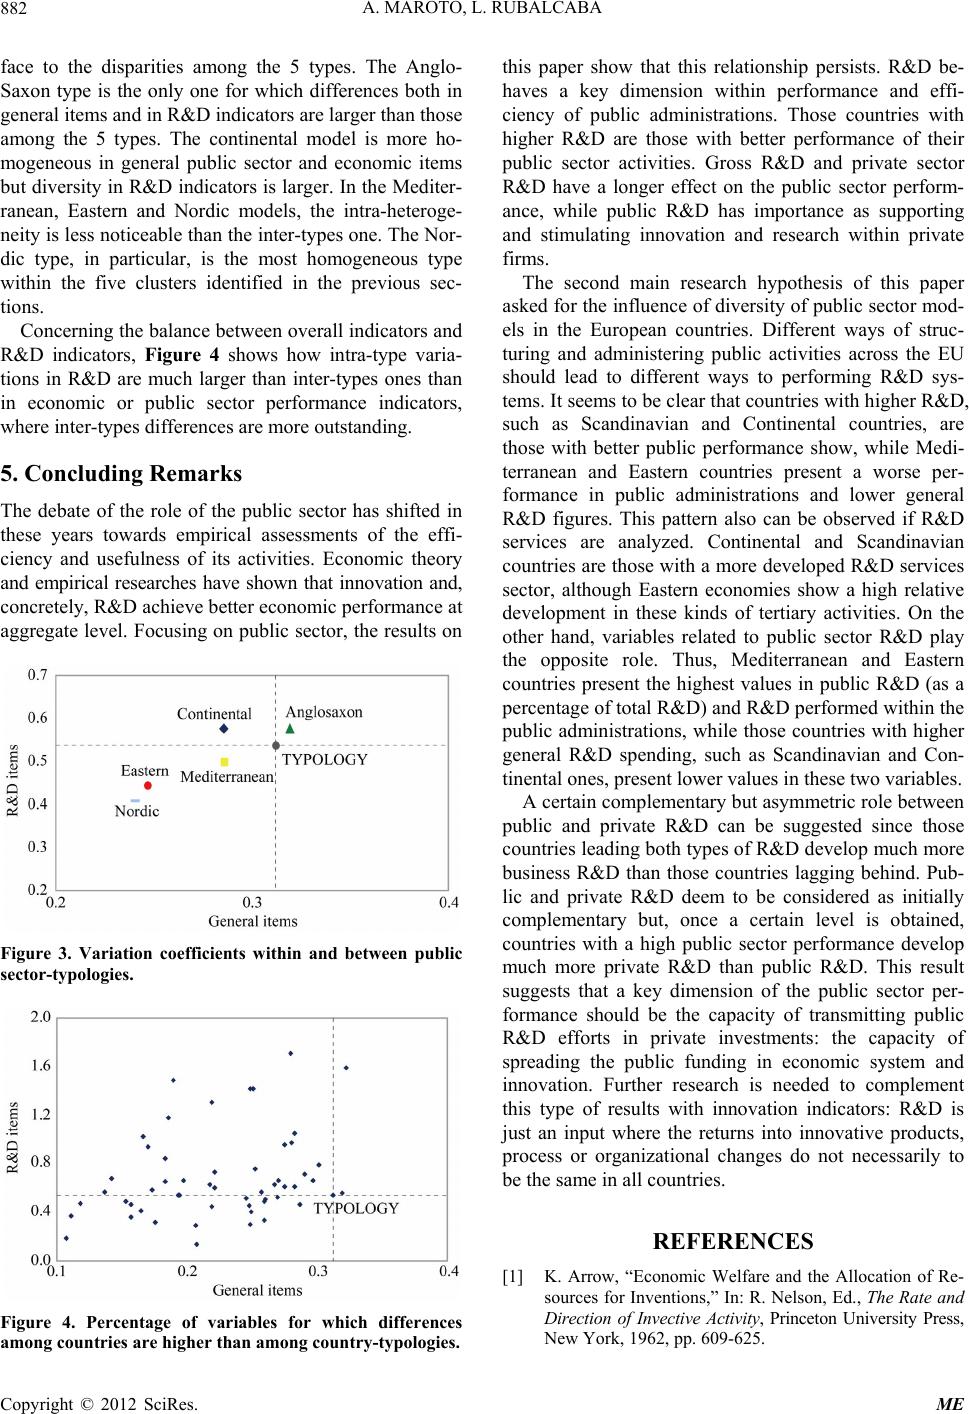 A. MAROTO, L. RUBALCABA 882 face to the disparities among the 5 types. The Anglo- Saxon type is the only one for which differences both in general items and in R&D indicators are larger than those among the 5 types. The continental model is more ho- mogeneous in general public sector and economic items but diversity in R&D indicators is larger. In the Mediter- ranean, Eastern and Nordic models, the intra-heteroge- neity is less noticeable than the inter-types one. The Nor- dic type, in particular, is the most homogeneous type within the five clusters identified in the previous sec- tions. Concerning the balance between overall indicators and R&D indicators, Figure 4 shows how intra-type varia- tions in R&D are much larger than inter-types ones than in economic or public sector performance indicators, where inter-types differences are more outstanding. 5. Concluding Remarks The debate of the role of the public sector has shifted in these years towards empirical assessments of the effi- ciency and usefulness of its activities. Economic theory and empirical researches have shown that innovation and, concretely, R&D achieve better economic performance at aggregate level. Focusing on public sector, the results on Figure 3. Variation coefficients within and between public sector-typologies. Figure 4. Percentage of variables for which differences among countries are higher than among country-typologies. this paper show that this relationship persists. R&D be- haves a key dimension within performance and effi- ciency of public administrations. Those countries with higher R&D are those with better performance of their public sector activities. Gross R&D and private sector R&D have a longer effect on the public sector perform- ance, while public R&D has importance as supporting and stimulating innovation and research within private firms. The second main research hypothesis of this paper asked for the influence of diversity of public sector mod- els in the European countries. Different ways of struc- turing and administering public activities across the EU should lead to different ways to performing R&D sys- tems. It seems to be clear that countries with higher R&D, such as Scandinavian and Continental countries, are those with better public performance show, while Medi- terranean and Eastern countries present a worse per- formance in public administrations and lower general R&D figures. This pattern also can be observed if R&D services are analyzed. Continental and Scandinavian countries are those with a more developed R&D services sector, although Eastern economies show a high relative development in these kinds of tertiary activities. On the other hand, variables related to public sector R&D play the opposite role. Thus, Mediterranean and Eastern countries present the highest values in public R&D (as a percentage of total R&D) and R&D performed within the public administrations, while those countries with higher general R&D spending, such as Scandinavian and Con- tinental ones, present lower values in these two variables. A certain complementary but asymmetric role between public and private R&D can be suggested since those countries leading both types of R&D develop much more business R&D than those countries lagging behind. Pub- lic and private R&D deem to be considered as initially complementary but, once a certain level is obtained, countries with a high public sector performance develop much more private R&D than public R&D. This result suggests that a key dimension of the public sector per- formance should be the capacity of transmitting public R&D efforts in private investments: the capacity of spreading the public funding in economic system and innovation. Further research is needed to complement this type of results with innovation indicators: R&D is just an input where the returns into innovative products, process or organizational changes do not necessarily to be the same in all countries. REFERENCES [1] K. Arrow, “Economic Welfare and the Allocation of Re- sources for Inventions,” In: R. Nelson, Ed., The Rate and Direction of Invective Activity, Princeton University Press, New York, 1962, pp. 609-625. Copyright © 2012 SciRes. ME 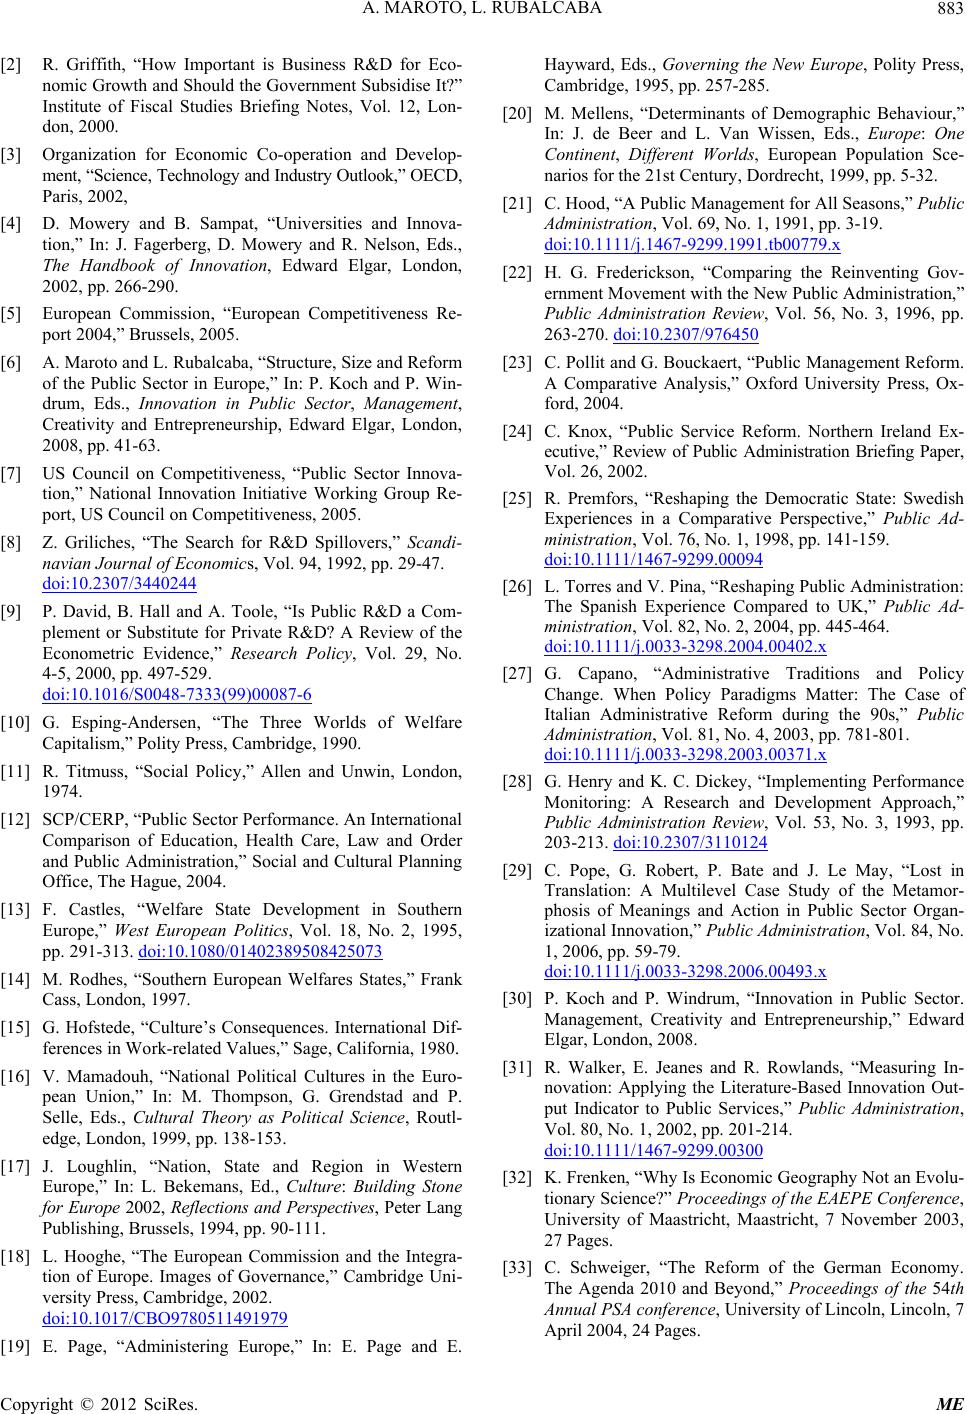 A. MAROTO, L. RUBALCABA Copyright © 2012 SciRes. ME 883 [2] R. Griffith, “How Important is Business R&D for Eco- nomic Growth and Should the Government Subsidise It?” Institute of Fiscal Studies Briefing Notes, Vol. 12, Lon- don, 2000. [3] Organization for Economic Co-operation and Develop- ment, “Science, Technology and Industry Outlook,” OECD, Paris, 2002, [4] D. Mowery and B. Sampat, “Universities and Innova- tion,” In: J. Fagerberg, D. Mowery and R. Nelson, Eds., The Handbook of Innovation, Edward Elgar, London, 2002, pp. 266-290. [5] European Commission, “European Competitiveness Re- port 2004,” Brussels, 2005. [6] A. Maroto and L. Rubalcaba, “Structure, Size and Reform of the Public Sector in Europe,” In: P. Koch and P. Win- drum, Eds., Innovation in Public Sector, Management, Creativity and Entrepreneurship, Edward Elgar, London, 2008, pp. 41-63. [7] US Council on Competitiveness, “Public Sector Innova- tion,” National Innovation Initiative Working Group Re- port, US Council on Competitiveness, 2005. [8] Z. Griliches, “The Search for R&D Spillovers,” Scandi- navian Journal of Economics, Vol. 94, 1992, pp. 29-47. doi:10.2307/3440244 [9] P. David, B. Hall and A. Toole, “Is Public R&D a Com- plement or Substitute for Private R&D? A Review of the Econometric Evidence,” Research Policy, Vol. 29, No. 4-5, 2000, pp. 497-529. doi:10.1016/S0048-7333(99)00087-6 [10] G. Esping-Andersen, “The Three Worlds of Welfare Capitalism,” Polity Press, Cambridge, 1990. [11] R. Titmuss, “Social Policy,” Allen and Unwin, London, 1974. [12] SCP/CERP, “Public Sector Performance . An Internationa l Comparison of Education, Health Care, Law and Order and Public Administration,” Social and Cultural Planning Office, The Hague, 2004. [13] F. Castles, “Welfare State Development in Southern Europe,” West European Politics, Vol. 18, No. 2, 1995, pp. 291-313. doi:10.1080/01402389508425073 [14] M. Rodhes, “Southern European Welfares States,” Frank Cass, London, 1997. [15] G. Hofstede, “Culture’s Consequences. International Dif- ferences in Work-related Values,” Sage, California, 1980. [16] V. Mamadouh, “National Political Cultures in the Euro- pean Union,” In: M. Thompson, G. Grendstad and P. Selle, Eds., Cultural Theory as Political Science, Routl- edge, London, 1999, pp. 138-153. [17] J. Loughlin, “Nation, State and Region in Western Europe,” In: L. Bekemans, Ed., Culture: Building Stone for Europe 2002, Reflections and Perspectives, Peter Lang Publishing, Brussels, 1994, pp. 90-111. [18] L. Hooghe, “The European Commission and the Integra- tion of Europe. Images of Governance,” Cambridge Uni- versity Press, Cambridge, 2002. doi:10.1017/CBO9780511491979 [19] E. Page, “Administering Europe,” In: E. Page and E. Hayward, Eds., Governing the New Europe, Polity Press, Cambridge, 1995, pp. 257-285. [20] M. Mellens, “Determinants of Demographic Behaviour,” In: J. de Beer and L. Van Wissen, Eds., Europe: One Continent, Different Worlds, European Population Sce- narios for the 21st Century, Dordrecht, 1999, pp. 5-32. [21] C. Hood, “A Public Management for All Seasons,” Public Administration, Vol. 69, No. 1, 1991, pp. 3-19. doi:10.1111/j.1467-9299.1991.tb00779.x [22] H. G. Frederickson, “Comparing the Reinventing Gov- ernment Movement with the New Public Administration,” Public Administration Review, Vol. 56, No. 3, 1996, pp. 263-270. doi:10.2307/976450 [23] C. Pollit and G. Bouckaert, “Public Management Reform. A Comparative Analysis,” Oxford University Press, Ox- ford, 2004. [24] C. Knox, “Public Service Reform. Northern Ireland Ex- ecutive,” Review of Public Administration Briefing Paper, Vol. 26, 2002. [25] R. Premfors, “Reshaping the Democratic State: Swedish Experiences in a Comparative Perspective,” Public Ad- ministration, Vol. 76, No. 1, 1998, pp. 141-159. doi:10.1111/1467-9299.00094 [26] L. Torres and V. Pina, “Reshaping Public Administration: The Spanish Experience Compared to UK,” Public Ad- ministration, Vol. 82, No. 2, 2004, pp. 445-464. doi:10.1111/j.0033-3298.2004.00402.x [27] G. Capano, “Administrative Traditions and Policy Change. When Policy Paradigms Matter: The Case of Italian Administrative Reform during the 90s,” Public Administration, Vol. 81, No. 4, 2003, pp. 781-801. doi:10.1111/j.0033-3298.2003.00371.x [28] G. Henry and K. C. Dickey, “Implementing Performance Monitoring: A Research and Development Approach,” Public Administration Review, Vol. 53, No. 3, 1993, pp. 203-213. doi:10.2307/3110124 [29] C. Pope, G. Robert, P. Bate and J. Le May, “Lost in Translation: A Multilevel Case Study of the Metamor- phosis of Meanings and Action in Public Sector Organ- izational Innovation,” Public Administration, Vol. 84, No. 1, 2006, pp. 59-79. doi:10.1111/j.0033-3298.2006.00493.x [30] P. Koch and P. Windrum, “Innovation in Public Sector. Management, Creativity and Entrepreneurship,” Edward Elgar, London, 2008. [31] R. Walker, E. Jeanes and R. Rowlands, “Measuring In- novation: Applying the Literature-Based Innovation Out- put Indicator to Public Services,” Public Administration, Vol. 80, No. 1, 2002, pp. 201-214. doi:10.1111/1467-9299.00300 [32] K. Frenken, “Why Is Economic Geography Not an Evolu- tionary Science?” Proceedings of the EAEPE Conference, University of Maastricht, Maastricht, 7 November 2003, 27 Pages. [33] C. Schweiger, “The Reform of the German Economy. The Agenda 2010 and Beyond,” Proceedings of the 54th Annual PSA conference, University of Lincoln, Lincoln, 7 April 2004, 24 Pages.
|