Paper Menu >>
Journal Menu >>
 Modern Economy, 2010, 1, 80-88 doi:10.4236/me.2010.12008 Published Online August 2010 (http://www. SciRP.org/journal/me) Copyright © 2010 SciRes. ME How to Reap the Induced Technological Bonus? A Mechanism and Illustrative Implementation Gouranga G. Das* Department of Economics, Hanyang University, Seoul, South Korea E-mail: gouranga_das@hotmail.com, dasgouranga@gmail.com Received June 17, 2010; revised July 19, 2010; accepted July 23, 2010 Abstract Exogenous technical progress can have uneven impacts on productivity contingent on absorptive capacity, structural congruence and trade intensity. The paper illustrates the role of enabling behind-the-border factors for effective absorption and is pertinent for discussing issues like ‘Europe 2020’or Lisbon strategy for inclu- sive growth. Drawing on our model, we illustrate that the capture-parameter is the propellant force for effec- tive assimilation of foreign technology of recent vintage. The capture parameter is the outcome of endoge- nous decision-making process. The ‘productivity bonus’ mechanism leaves room for changing the results via skill-mix composition. However, it awaits implementation in a large-scale economy-wide modeling frame- work for further extension. Keywords: Trade, Technology Spillover, Capture, Productivity, Congruence 1. Introduction Of late, with the rise to dominance of new endogenous growth theory the role of international trade and foreign direct investment (henceforth, FDI) in facilitating trans- border technology flows and consequential rise in pro- ductivity can no way be underestimated. The role of in- ternational trade in transmission of technological benefits via traded intermediate inputs has been discussed at length in the literature—see Keller [1], Eaton and Kor- tum [2,3], Coe, Helpman and Hoffmaister [4,5]—to name a few. Participation in international trade provides a variety of benefits to developing countries through re- source allocations according to comparative advantage, exploitation of economies of scale, increased capacity utilization and technology upgradation-to name a few. Upsurge in technology-intensive products is well-docu- mented in the literature (Keller [1]; World Development Report [6], World Bank [7]; Connolly [8]; Coe et al. [4]; Guerrieri and Milana [9]; Hoekman and Javorcik [10]; Das [11-13]). In the literature of technology spillover, the importance of absorption capacity (AC) and struc- tural similarity (SS) in appropriation of technological benefits has been discussed (Cohen and Levinthal [14,15]; Nelson and Pack [16]; Evenson and Westphal [17]; World Development Report [6]). According to the World Development Report (World Bank [6] (henceforth, WDR) trade facilitates technology flows. WDR (1999) has documented evidences of acquisition of the knowl- edge capital with particular emphasis on the role of AC for knowledge diffusion. In fact, WDR (1999) reports that “even a follower country needs a labour force with a relatively high level of technical education, especially when technologies are changing rapidly” (see p. 42, ibid). Also, for closing ‘knowledge gaps’ between the techn- ology creator and the recipients it emphasized the crucial roles of (see p. 25): 1) “Acquiring and adapting global knowledgeand creating knowledge locally;” 2) “Investing in human capital to increase the ability to absorb and use knowledge;” 3) “Investing in technologies to facilitate both the ac- quisition and the absorption of knowledge.” Development of AC is important for effective diffu- sion of technology as it encompasses the “ability to imi- tate new process of product innovations, [and] to ex- ploit basic research.” (Cohen and Levinthal, [15]). Nelson [18] defines AC as “the ability to learn and implement the technologies Comments of an anonymous referee is appreciated. With the usual disclaimer, the author is grateful to Professor Alan Powell. I acknowl- edge the support of the Faculty of Applied Economics, University o f Antwerp, Belgium under Erasmus Mundus Visiting Scholar Pro- gramme of the European Commission during May — August 2010.  G. G. DAS Copyright © 2010 SciRes. ME 81 and associated practices of… ...developed countries.” Nelson and Pack [16] argues that “to learn to use new technologies and to function ef- fectively in new sectors required the development of new sets of skills, new ways of organising economic activity, and …. [becoming] competent in new markets” [and also] “to be sure, adopting technologies of the advanced countries required, among other things, high rates of investment in physical and human capital...” We offer a stylized model formalizing the nexus be- tween embodied technology transfer, human capital and TFP Growth. AC is defined in terms of skill intensity of the labor force (Das [12]; Meijl and Tongeren [19]). SS of two sectors will be judged by the similarity of their capital intensities, for example, by physical capital per unit of effective labor. SS involves comparison of struc- tural characteristics of a sector in the source of techno- logical change and those in the destinations; the idea is that the technical knowledge in the advanced economies will be most ‘appropriate’ to the clients closest to them in terms of their primary factor intensities. Our over- arching theory focuses on the sector-specificity of the capture parameter (CP) determined by AC, SS and trade intensity (TI). The model developed is specifically de- signed for illustrative simulation of a technology shock. Section 2 rationalizes. Section 3 models. Section 4 nu- merically illustrates. Section 5 concludes. 2. The Rationale Most of the relevant papers in the new growth literature deal with non-convexities in production and dynamic gains from trade between trade partners.1 The integration of new growth theory and trade theory à la Grossman and Helpman [21] and other researchers (mentioned above) places the emphasis on induced endogenous technical change and scale economies. Typically, most of the models assign a more prominent role to ‘technological change’ as an explanator for varying growth episodes across nations. Lucas [22,23], however, is a tour de force in this genre of growth models where the role of human capi- talmodelled via schooling and formal education as well as learning by doing and on-the-job-traininghas been given due importance. Kosempel [24] also modeled such interaction. In fact, Lucas [23] argues “By assigning so great a role to ‘technology’ as a sou- rce of growth, the theory is obliged to assign correspond- ingly minor roles to everything else, and so has very little ability to account for the wide diversity in growth rates that we observe”. Lucas [22] argued that, although they started from al- most entirely comparable bases, South Korea experi- enced a ‘growth miracle’ whilst the Philippines had an episode of ‘growth failure’ between 1960 and 1988; ac- cording to him, “The main engine of growth is the access to human capital of knowledge and the main source of differe- nce in living standards among nations is the difference in human capital. Physical capital accumulation plays an essential but decidedly subsidiary role”. Using a “bottoms-up” approach, we focus not only on the firm’s attainment of a least-cost input combination, but also on technology transfer-induced endogenous ch- anges in productivity. The vital elements in the latter are skilled labor intensity (measuring AC), physical capital intensity (proxying SS), and the trade intensity (TI, of- fering the opportunities for capturing a technological bonus). As shown below, for a sector “CP” is an amal- gam of AC, SS and TI. In the context of European Un- ion’s enlargement efforts to give accession to lower-tier countries, this issue is pertinent. SS encapsulates social capital and effects of physical capital amalgamated into one ‘catch-all’ factor for ease of expositional conven- ience. According to Dasgupta [25], TFP binds both tech- nology and socio-economic institutions. Sen [26] as- cribes important role to lack of social and physical infra- structure. In a simple set up, the model purports to show the mechanism of three pillars for cooperation between high-tier and low-tier economies—a lesson useful from the EU’s enlargement perspective (not discussed for par- simony and different focus of current analysis). A representative firm reaps the benefits of technologi- cal improvements embodied in imported inputs. It needs higher level skills to harness the benefits of technological improvements. At the macro level, given the overall hu- man capital stock and structural congruence with the trading partners, the regions participate in trade and reap the technological bonus (TB) out of trade flows (see Ce- tin and Cincera [27]). Of course, at a given intensity of trade flows, a higher bonus may be achievable if the skill intensity of the work force is higher, which may partially motivate building up additional skills. At the level of a sector, the question is to find out the “optimal” level of skilled labour for a sector so as to make the best use of the “TB” obtainable from trade-mediated technology. Even though the firm chooses an optimal input mix, technical progress in the foreign source is an exogenous phenomenon. This induces a sectoral bias into technical change as skilled labour will have an advantage in ex- tracting the “TB” from spillovers. Based on the theoretical insights, we adopt a neo-clas- sical growth framework. Let us consider an economy that produces a single homogeneous good “Yt” (output or GDP, synonymously) using composite (i.e., skilled and unskilled composite) labor (L), domestic capital or gross domestic capital formation, GDI, (KD) and foreign capi- tal of FDI (KF) so that the aggregate Neoclassical well- behaved production function is written as: 1See for example, Das [14,20], Grossman and Helpman [21], Evenson and Westphal [18].  G. G. DAS Copyright © 2010 SciRes. ME 82 F t D tttt K,K,LFAY (1) where “At > 0” is an index of technological progress (pa- rameter) representing Total Factor Productivity (TFP) index or Hicks-neutral technical progress. Also, aggregate composite capital stock, F t D tt KKK . Subscript “t” refers to unit of time. However, for sim- plicity we suppress the regional subscript for each coun- try j. Assuming linear homogeneity (constant returns to scale), this production function can be expressed in per worker (intensive form) terms as: F t D ttt k,kfAy (2) where lower case letters represent per worker values of the corresponding variables. Note that yt is the productiv- ity per worker in period t. Assuming log-linearity and taking a total differential of (1), we derive the following expression for growth- accounting relation as: F t F t . . D t D t . t t . t . tk/kk/kA/Ay/y (3) In (3), generically xdt dx x . t 1 is the time rate of change of variable x or the growth rate. The above expression shows that the growth-rate of per capita GDP depends on the growth rates of FDI and GDI intensity per worker and the rate of TFP growth. It is to be noted that the TFP changes, being influenced by shares of FDI and GDI in aggregate output, occur endo- genously to escalate the growth in per capita GDP. Un- der perfect competition in product and factor markets, the coefficients are the corresponding output elasticities (equivalently, factor cost shares of foreign and domestic capital in per capita terms) of FDI and GDI per capita (in terms of growth rates). The implication of this model is that since at higher level of capital stock, it will be subject to diminishing returns, the countries with lower level of productivity will experience a higher growth as a result of increased FDI. On the other hand, for the advanced countries the growth of productivity will be slower. Thus, this model suggests that the productivity differential across coun- tries will be smaller owing to FDI-induced foreign capi- tal inflows. The convergence of growth rates is in line with the catch-up hypothesis put forward for the newly emerging and rapidly industrializing economies of East and South-East Asia. This has important bearing for the EU’s integration effort with potential and candidate member states with lack of appropriate constellation of enabling factors (Shankar and Shah [28]). With sufficient human capital and skill formation, a country will have ample opportunity to break this diminishing returns and hence, will be able to reap spillover benefits via harness- ing the technologically sophisticated capital goods or imported input embodying superior state-of-the-art. Thus, “k” in the above stylizations could be interpreted broadly to encompass human capital or knowledge-capital of superior quality. As Pack and Westphal [29] argued, “effort is required in using technological information and accumulating technological knowledge...to create new technology. This takes the form of investments in.….effective use of knowledge.” In what follows, we just present an illustrative analy- tical model to show the role of human capital intensity to absorb sophisticated technology, assuming that physical capital intensity does not hinder the growth process.2 3. A Model of Productivity Bonus3 Newer technology embodied in traded goods demands its own types of skills. The profile of skills embodied in the workers interacts with other inputs and the available state of the art to determine the TFP. The underlying assump- tion is that workers differ in the appropriateness of their skills to achieve any given productivity level with a par- ticular vintage of technology. Competition ensures that each labour type is paid according to its marginal prod- uct. The incentive of reaping a technological bonus from embodied spillovers modifies the representative firm’s choice of an optimal occupational mix. Thus, the bonus hypothesis is: the representative firm, in the process of maximizing profit (or minimizing costs), takes into ac- count the benefits of technological improvements em- bodied in imported intermediate inputs. Capturing these benefits requires an appropriate mix of skilled and un- skilled labour, which is recognized by the representative firm in its production decisions. The benefits available, moreover, depend positively on the structural similarity of the source and the recipient (as measured by the ratio of capital to quality adjusted labour). Technological im- provement is exogenous in this theory which is restricted to the propagation of technology. We assume that for a sector “Bonus Embodied Spillover of Technology (BE- ST)” is achieved in consonance with the representative firm’s static optimization exercise: firstly, three variables viz., sectoral skill intensity, structural congruence and trade intensity in production of the sector combine to produce a capture-parameter. This subsequently trans- forms the potential productivity improvement into an actual productivity bonus—BEST—accrued via the tra- ded intermediates. Figure 1 shows the transmission me- chanism behind the productivity bonus. The production function is generically written as: 2This version of the paper is based on Das [30] with substantial altera- tion and improvement on the in-house version being incorporated based on feedbacks from Professor Man-Soo Joo. 3Derived from Das [30]. 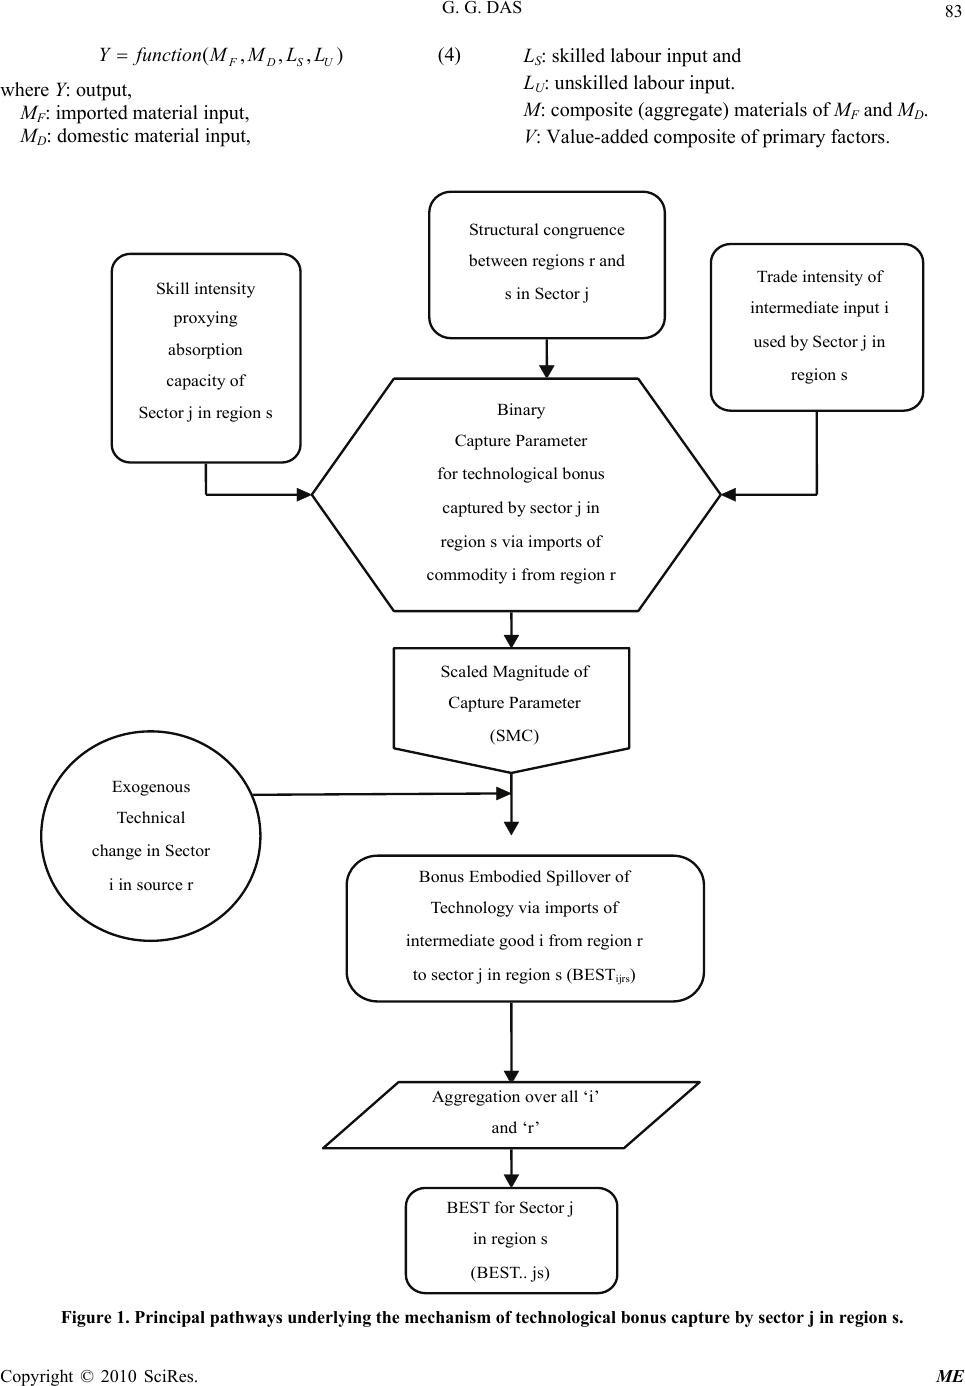 G. G. DAS Copyright © 2010 SciRes. ME 83 (,,,) FDSU YfunctionMMLL (4) where Y: output, MF: imported material input, MD: domestic material input, LS: skilled labour input and LU: unskilled labour input. M: composite (aggregate) materials of MF and MD. V: Value-added composite of primary factors. Skill intensity proxying absorption capacity of Sector j in region s Trade intensity of intermediate input i used by Sector j in region s Scaled Magnitude of Capture Parameter (SMC) Structural congruence between regions r and s in Sector j BEST for Sector j in region s (BEST.. js) Aggregation over all ‘i’ and ‘r’ Bonus Embodied Spillover of Technology via imports of intermediate good i from region r to sector j in region s (BEST ijrs ) Exogenous Technical change in Sector i in source r Binary Capture Parameter for technological bonus captured by sector j in region s via imports of commodity i from region r Figure 1. Principal pathways underlying the mechanism of technological bonus capture by sector j in region s. 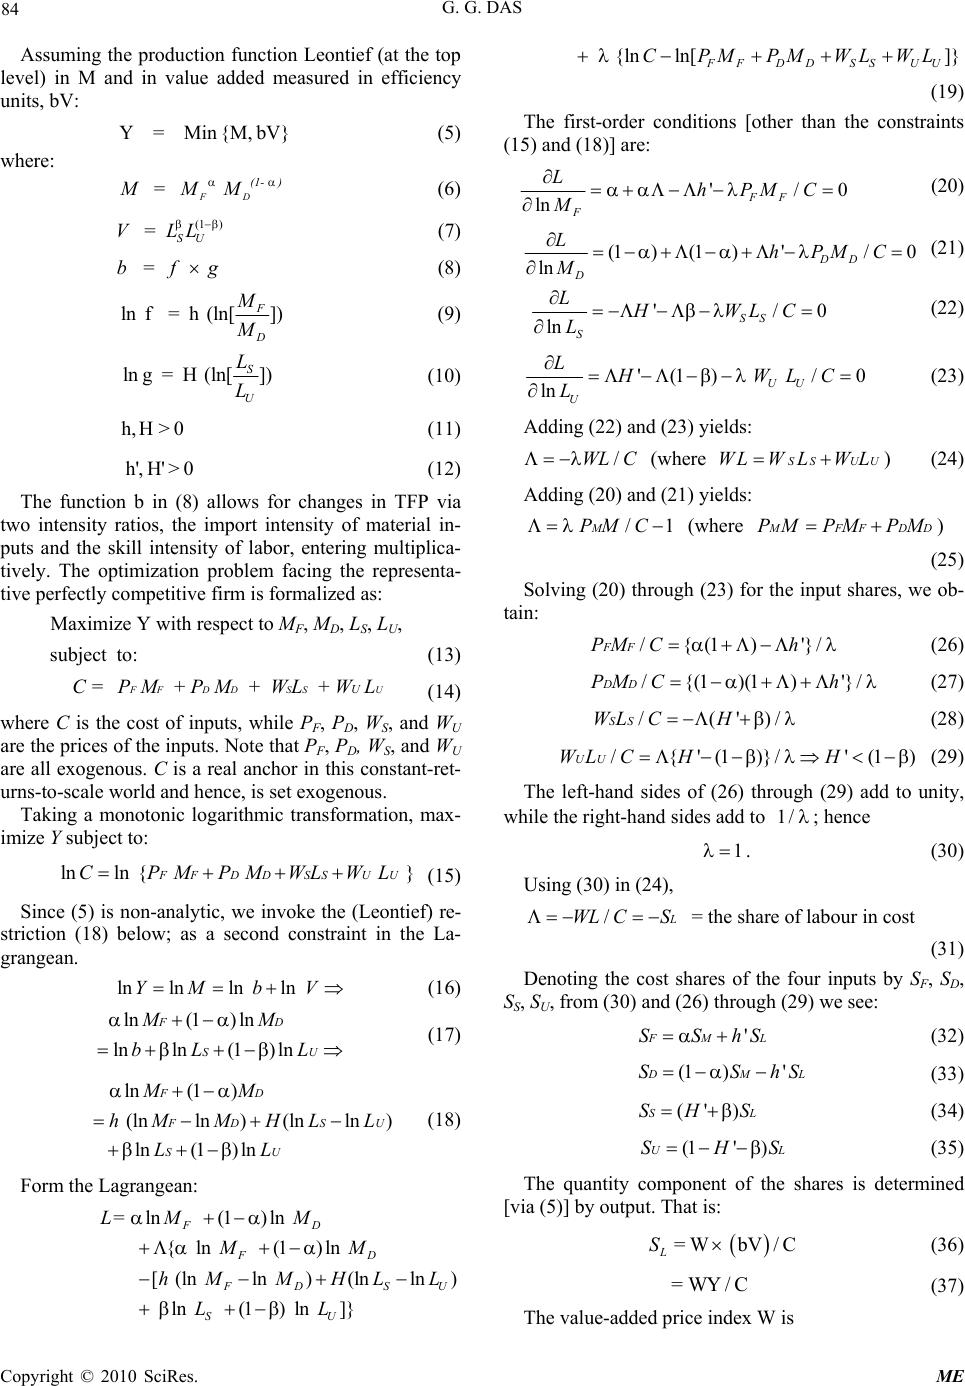 G. G. DAS Copyright © 2010 SciRes. ME 84 Assuming the production function Leontief (at the top level) in M and in value added measured in efficiency units, bV: Y = Min {M, bV} (5) where: FD (1- ) M = M M (6) (1 ) SU V = LL (7) b = f g (8) lnf = h(ln[]) F D M M (9) ln g = H(ln[]) S U L L (10) h,H> 0 (11) h', H' > 0 (12) The function b in (8) allows for changes in TFP via two intensity ratios, the import intensity of material in- puts and the skill intensity of labor, entering multiplica- tively. The optimization problem facing the representa- tive perfectly competitive firm is formalized as: Maximize Y with respect to MF, MD, LS, LU, subject to: (13) F FDD SSUUC = P M + P M + WL + W L (14) where C is the cost of inputs, while PF, PD, WS, and WU are the prices of the inputs. Note that PF, PD, WS, and WU are all exogenous. C is a real anchor in this constant-ret- urns-to-scale world and hence, is set exogenous. Taking a monotonic logarithmic transformation, max- imize Y subject to: lnln {}FF DD SSUUC P MP MWLW L (15) Since (5) is non-analytic, we invoke the (Leontief) re- striction (18) below; as a second constraint in the La- grangean. ln lnln lnYM b V (16) ln(1) ln lnln(1) ln FD SU MM bL L (17) ln(1) (lnln)(lnln ) ln(1) ln FD F DSU SU MM h MMHLL LL (18) Form the Lagrangean: ln(1) ln {ln(1)ln [ (lnln)(lnln) ln(1) ln]} FD FD F DSU SU L= M M M M h M MHLL L L {ln ln[]} FF DDSSUU CPMPMWLWL (19) The first-order conditions [other than the constraints (15) and (18)] are: '/0 ln FF F LhPMC M (20) (1 )(1 )'/0 ln DD D LhPMC M (21) '/0 ln SS S LHWLC L (22) '(1)/ 0 ln UU U LH W LC L (23) Adding (22) and (23) yields: /WL C (where SS UUWLWLWL ) (24) Adding (20) and (21) yields: /1M PMC (where M FF DDPM PMPM) (25) Solving (20) through (23) for the input shares, we ob- tain: /{(1) '}/FFPM Ch (26) /{(1)(1) '}/DDPM Ch (27) /(')/SSWLCH (28) /{'(1)}/ '(1)UUWL CHH (29) The left-hand sides of (26) through (29) add to unity, while the right-hand sides add to 1/; hence 1 . (30) Using (30) in (24), / L WL CS = the share of labour in cost (31) Denoting the cost shares of the four inputs by SF, SD, SS, SU, from (30) and (26) through (29) we see: ' F MLSShS (32) (1 )' D MLSShS (33) (' )SLSH S (34) (1' )ULSHS (35) The quantity component of the shares is determined [via (5)] by output. That is: = W bV/C L S (36) =WY/C (37) The value-added price index W is  G. G. DAS Copyright © 2010 SciRes. ME 85 (1 ) SS UU SU WL WL W = bL L (38) Similarly for materials: = M/C = Y/C MM M SP P where composite material prices is given by: (1 ) FF DD M FD PM PM P = MM (39) 4. Numerical Illustration4 4.1. The Data and Parameter Setting Our analytical model developed above indicates that se- veral inferences could be drawn from patterns of changes in the system. Thus, we perform some numerical simula- tion to show the impact of a technology shock (TFP) on the productivity improvement. The problem is ap- proached in a partial equilibrium set up to see what type of changes prevails in the model. We illustrate the me- chanism on the basis of a hypothetical data set with ad- missible values-presented in Tables 1 and 2. We have assigned admissible values to the parameters of the mod- el, α and β. Tables 1 and 2 present the specific initial settings or base-case scenario. The base-case scenario in Tables 1 and 2 is a solution of the share Equations (32)-(35) above. The impact of TFP improvement on endogenous productivity enhance- ment is traced via changes in “b” in the wake of several perturbations as specified in the experiments. 4.2. TFP Simulation We simulate the effect of 5 and 10 percent TFP shock. Following the perturbation, the changed initial configu- rations of the variables are given in Table 3. The 10 percent Hicks-Neutral shock is represented by the 10 percent increase in ‘b’ (2.724/2.4764 = 1.10) be- tween Tables 1 and 3. As this shock is factor-neutral by nature, it affects the ‘size’ of the composite value-added whilst the composition of value-added (measured in con- ventional units) remain unaltered. Thus, because of Hic- ks-Neutrality skill-unskilled labour ratio between Tables 1 and 3 (4/8 = 0.5 = 3.739/7.478) remains unchanged. With fixed cost and prices kept fixed at the original level, the TFP improvement translates into a fall in the value- added measured in conventional units—compare the values for “V” in Tables 1 and 3—implying each pro- ductive factor inputs are required in less amount in physical terms. With cost being held fixed and given no change in the relative prices in the post-shock scenario, as V falls M has to increase to satisfy the constraint for fixed cost. Comparing the last column in these two tables, we infer that in quality-adjusted term, however, real val- ue added increases. This is because the level of produc- tivity bonus [i.e., value of “b”] is augmented from 2.48 to 2.72. This, in turn, increases the effective value- added [i.e., “bV”]. Following the Leontief fixed-coefficient technology at the top-most level, the usage of composite material inputs goes up by the same magnitude as ‘bV’ see third column in Tables 2 and 3. Also, gross output [Y] increases by about 2.8 percentsee fourth column in Tables 1 and 3 (15.439/15.014 = 1.028). Results for 5% shock could be explained analogously; however, as Table 1. Initial scenario for the representative firm. MF M D M Yj V LS L U b bV 8 19.664 15.014 15.014 6.063 4 8 2.476 15.014 Table 2. Prices and Parameter setting for the representative firm. WS W U P F P D C[exogenous] 1 1 1 1 39.665 0.3 0.4 Table 3. Post-shock scenario for the representative firm and the impacts of TFP shocks. Variables MF M D M Yj V LS L U b f g 10% shock 8.22620.221 15.43915.4395.6673.7397.4782.7241.50 1.65 5% shock 8.11619.952 15.23415.4395.8583.8657.7302.6001.50 1.65 4The discussion and arguments draws partly on the in-house version of the article in Research Institute of Digital Economics, Hanyang University, Ansan. We need to report this to highlight the differences with other counterfactual simulations that we present below in details. However, this re- p roduction is for facilitating understanding of the theoretical insight via numerical example. 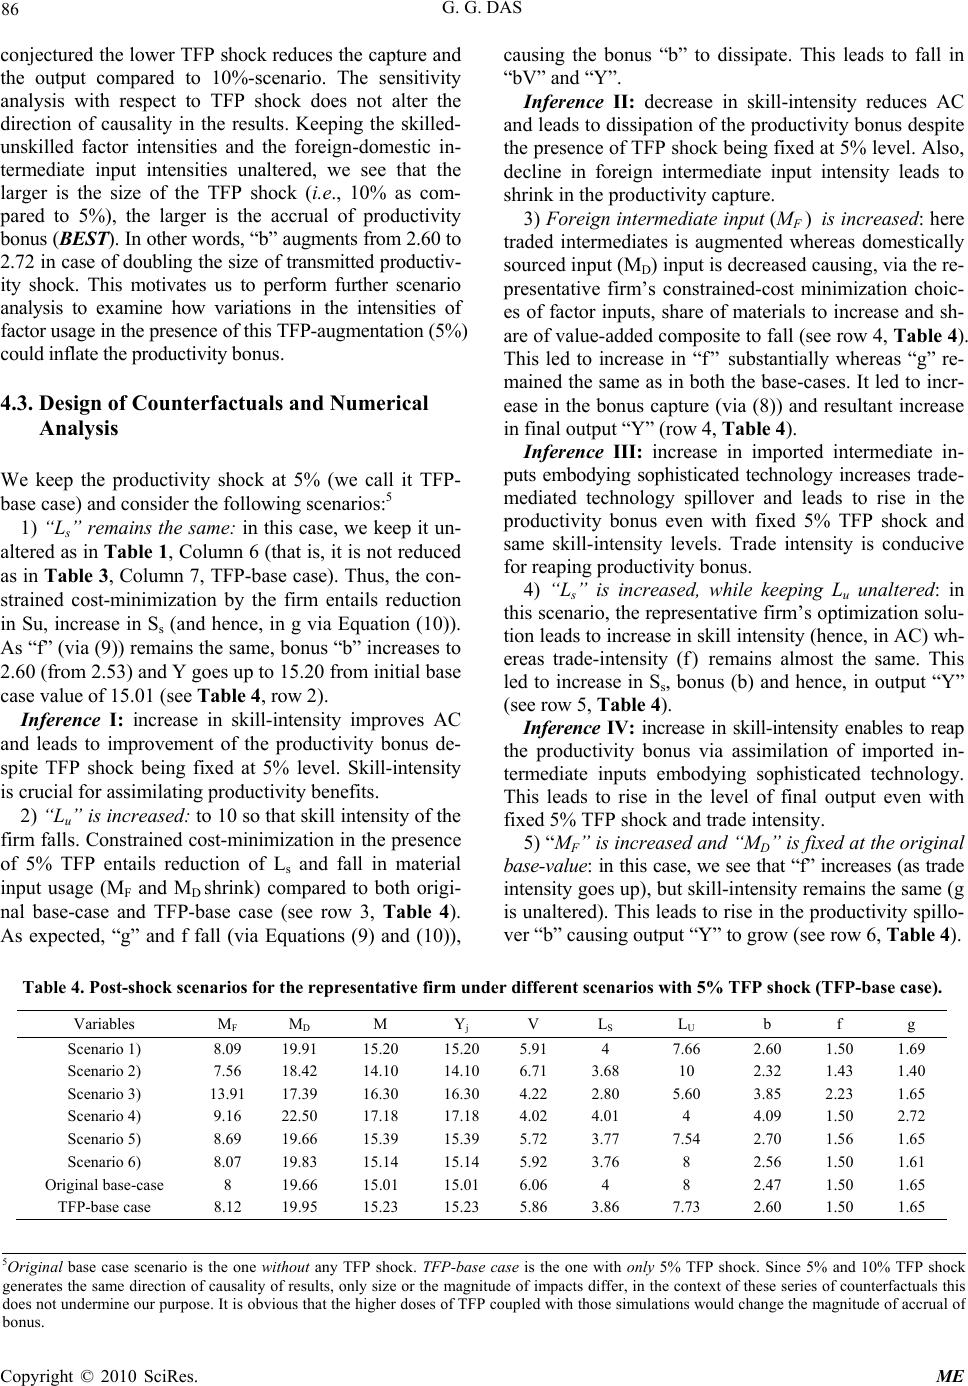 G. G. DAS Copyright © 2010 SciRes. ME 86 conjectured the lower TFP shock reduces the capture and the output compared to 10%-scenario. The sensitivity analysis with respect to TFP shock does not alter the direction of causality in the results. Keeping the skilled- unskilled factor intensities and the foreign-domestic in- termediate input intensities unaltered, we see that the larger is the size of the TFP shock (i.e., 10% as com- pared to 5%), the larger is the accrual of productivity bonus (BEST). In other words, “b” augments from 2.60 to 2.72 in case of doubling the size of transmitted productiv- ity shock. This motivates us to perform further scenario analysis to examine how variations in the intensities of factor usage in the presence of this TFP-augmentation (5%) could inflate the productivity bonus. 4.3. Design of Counterfactuals and Numerical Analysis We keep the productivity shock at 5% (we call it TFP- base case) and consider the following scenarios:5 1) “L s” remains the same: in this case, we keep it un- altered as in Table 1, Column 6 (that is, it is not reduced as in Table 3, Column 7, TFP-base case). Thus, the con- strained cost-minimization by the firm entails reduction in Su, increase in Ss (and hence, in g via Equation (10)). As “f” (via (9)) remains the same, bonus “b” increases to 2.60 (from 2.53) and Y goes up to 15.20 from initial base case value of 15.01 (see Table 4, row 2). Inference I: increase in skill-intensity improves AC and leads to improvement of the productivity bonus de- spite TFP shock being fixed at 5% level. Skill-intensity is crucial for assimilating productivity benefits. 2) “Lu” is increased: to 10 so that skill intensity of the firm falls. Constrained cost-minimization in the presence of 5% TFP entails reduction of Ls and fall in material input usage (MF and MD shrink) compared to both origi- nal base-case and TFP-base case (see row 3, Table 4). As expected, “g” and f fall (via Equations (9) and (10)), causing the bonus “b” to dissipate. This leads to fall in “bV” and “Y”. Inference II: decrease in skill-intensity reduces AC and leads to dissipation of the productivity bonus despite the presence of TFP shock being fixed at 5% level. Also, decline in foreign intermediate input intensity leads to shrink in the productivity capture. 3) Foreign intermediate input (MF) is increased: here traded intermediates is augmented whereas domestically sourced input (MD) input is decreased causing, via the re- presentative firm’s constrained-cost minimization choic- es of factor inputs, share of materials to increase and sh- are of value-added composite to fall (see row 4, Table 4). This led to increase in “f” substantially whereas “g” re- mained the same as in both the base-cases. It led to incr- ease in the bonus capture (via (8)) and resultant increase in final output “Y” (row 4, Table 4). Inference III: increase in imported intermediate in- puts embodying sophisticated technology increases trade- mediated technology spillover and leads to rise in the productivity bonus even with fixed 5% TFP shock and same skill-intensity levels. Trade intensity is conducive for reaping productivity bonus. 4) “Ls” is increased, while keeping Lu unaltered: in this scenario, the representative firm’s optimization solu- tion leads to increase in skill intensity (hence, in AC) wh- ereas trade-intensity (f) remains almost the same. This led to increase in Ss, bonus (b) and hence, in output “Y” (see row 5, Table 4). Inference IV: increase in skill-intensity enables to reap the productivity bonus via assimilation of imported in- termediate inputs embodying sophisticated technology. This leads to rise in the level of final output even with fixed 5% TFP shock and trade intensity. 5) “MF” is increased and “MD” is fixed at the original base-value: in this case, we see that “f” increases (as trade intensity goes up), but skill-intensity remains the same (g is unaltered). This leads to rise in the productivity spillo- ver “b” causing output “Y” to grow (see row 6, Table 4). Table 4. Post-shock scenarios for the representative firm under different scenarios with 5% TFP shock (TFP-base case). Variables MF M D M Yj V LS L U b f g Scenario 1) 8.09 19.91 15.20 15.20 5.91 4 7.66 2.60 1.50 1.69 Scenario 2) 7.56 18.42 14.10 14.10 6.71 3.68 10 2.32 1.43 1.40 Scenario 3) 13.91 17.39 16.30 16.30 4.22 2.80 5.60 3.85 2.23 1.65 Scenario 4) 9.16 22.50 17.18 17.18 4.02 4.01 4 4.09 1.50 2.72 Scenario 5) 8.69 19.66 15.39 15.39 5.72 3.77 7.54 2.70 1.56 1.65 Scenario 6) 8.07 19.83 15.14 15.14 5.92 3.76 8 2.56 1.50 1.61 Original base-case 8 19.66 15.01 15.01 6.06 4 8 2.47 1.50 1.65 TFP-base case 8.12 19.95 15.23 15.23 5.86 3.86 7.73 2.60 1.50 1.65 5Original base case scenario is the one without any TFP shock. TFP-base case is the one with only 5% TFP shock. Since 5% and 10% TFP shoc k generates the same direction of causality of results, only size or the magnitude of impacts differ, in the context of these series of counterfactuals this does not undermine our purpose. It is obvious that the higher doses of TFP coupled with those simulations would change the magnitude of accrual o f bonus.  G. G. DAS Copyright © 2010 SciRes. ME 87 Inference V: increase in trade-intensity enables to reap the productivity bonus embedded in the imported interm- ediate inputs containing sophisticated technology. This leads to rise in the level of final output even with fixed 5% TFP shock and similar skill-unskilled labor shares. 6) “Ls” decreases, but “Lu” remains at the original base-case value: in this counterfactual case, Ls decreases so that Ss falls and hence, skill intensity declines. As Md and Mf do not alter much, following the firm’s const- rained cost-minimization exercise, “f” remains unalte- red while “g” is reduced. Thus, the bonus magnitude “b” shrinks compared to TFP-base case. But as there is initial 5% TFP improvement, this causes output “Y” to register marginally higher level than the original base-case value (compare row 7, Table 4 with row 8). This is lower than TFP-base case as there is a fall in “g” following decline of skill-unskilled ratio. Inference VI: decrease in skill-intensity in the pres- ence of unchanged trade-intensity causes less chance to reap the productivity bonus embedded in the imported intermediate inputs. In this case, rise in the level of final output is induced by 5% TFP shock despite declining skill composition and similar level of trade intensity. All these inferences are instrumental in understanding the working of the theoretical model developed in this paper. The numerical illustration of the model confirms our conjecture that trade, indigenous skill-induced adop- tive capabilities as well as technological sophistication are important forces for sustained growth and develop- ment. All these three channels facilitate learning of technologies of recent vintage. They mutually reinforce each other to translate into higher growth of output. 5. Conclusions This paper presents and numerically implements a theo- retical model of endogenous capture of technical change originating in the source of knowledge-creation (as- sumed exogenous). Numerical simulation confirms that: increases in the intensity of skilled labor in the input mix improves the absorptive capacity of the work force; the amount of technology captured increases with the import intensity of the material inputs while technological change is vehicled via foreign intermediates; increase in both types of intensities complements each other to augment the bonus capture; only technological change cannot deliver the potential benefits unless the input mixes are optimally chosen by the firm while making cost-minimization decision. We have explored their ef- fects in harnessing the trade-induced technology flows. We show that capture-parameter is the propellant force for assimilation of transmitted technology. Further work along these lines will involve mounting the full scale simulations in a higher dimensional model and integrat- ing a dynamic aspect of R&D-creation and its propaga- tion. This work has important implications for technol- ogy policy and planning as well as for trade or regional integration, for example, in the context of European Un- ion’s accession program under Europe 2020 aimed at social cohesion, competitiveness, skill formation, and R&D (Shankar and Shah [28]). Often, the necessity of political and social integration as precursor of successful monetary union is stressed. A systemic view is warranted for pursuing this objective. The model elicits heuristically that technology policy, trade policy and macroeconomic management needs a synergistic planning to achieve sustained growth. Trade, per se, is insufficient for achieving the growth dividends. Trade creates the op- portunities for sustained development via industrializa- tion and technology transfer; however, developing ade- quate socio-institutional framework, educational attain- ment and skill formations, inter alia, are necessary for seizing plethora of opportunities. 6. References [1] W. Keller, “International Technology Diffusion.” Journal of Economic Literature (AEA), Vol. 42, No. 3, 2004, pp. 752-782. [2] J. Eaton and S. Kortum, “Trade in Ideas: Patenting and Productivity in the OECD,” Journal of International Economics, Vol. 40, No. 3-4, 1996, pp. 251-278. [3] J. Eaton and S. Kortum, “Engines of Growth: Domestic and Foreign Sources of Innovation,” Japan and the World Economy, Vol. 9, No. 2, 1997, pp. 235-259. [4] D. T. Coe, E. Helpman and A. W. Hoffmaister, “North- South R&D Spillovers,” Economic Journal, Vol. 107, No. 440, 1997, pp. 134-149. [5] D. T. Coe, E. Helpman and A. W. Hoffmaister, “Interna- tional R&D Spillovers and Institutions,” IMF Working Paper WP/08/104, IMF, 2008, pp. 1-35. [6] World Bank, “World Development Report 1998/9: Knowledge for Development,” New York, Oxford Uni- versity Press, 1999. [7] World Bank, “Global Economic Prospect 2008: Tech- nology Diffusion in the Developing World,” Washington D.C., 2008. [8] M. P. Connolly, “The Dual Nature of Trade: Measuring its Impact on Imitation and Growth,” Duke University Department of Economics Working Paper, Durham, North Carolina, No. 97-34, 1998, pp. 1-28. [9] P. Guerrieri and C. Milana, “Changes and Trends in the world Trade in High-Technology Products,” Cambridge Journal of Economics, Vol. 19, No. 1, 1995, pp. 225-242. [10] B. Hoekman and B. Javorcik, “Global Integration and Technology Transfer,” Palgrave MacMillan, New York, 2006. [11] G. G. Das, “Absorptive Capacity and Structural Congru- ence: The Binding Constraints on Technology Trans- fer—An Analytical Survey of the Underlying Issues,” Korean Journal of Policy Studies, Vol. 15, No. 2, 2001,  G. G. DAS Copyright © 2010 SciRes. ME 88 pp. 117-140. [12] G. G. Das, “Trade, Technology and Human Capital: Styl- ised Facts and Quantitative Evidence,” World Economy, Vol. 25, No. 2, February 2002, pp. 257-281. [13] G. G. Das, “Modeling Sectoral and Welfare Impacts of Information Technology Spillovers: A Tale of Two Souths,” Indian Journal of Economics and Business, Se- rial Publications, Vol. 7, No. 2, December 2008, pp. 195- 205. [14] W. M. Cohen and D. A. Levinthal, “Absorptive Capacity: A New Perspective on Learning and Innovation,” Admin- istrative Science Quarterly, Vol. 35, No. 1, March 1990, pp. 128-152. [15] W. M. Cohen and D. A. Levinthal, “Innovation and Learning: The Two Faces of R&D,” Economic Journal, Vol. 99, No. 397, September 1989, pp. 569-596. [16] R. R. Nelson and H. Pack, “The Asian Miracle and Mod- ern Growth Theory,” Economic Journal, Vol. 109, No. 457, July 1999, pp. 416-436. [17] R. E. Evenson and. L. E. Westphal, “Technological Change and Technology Strategy,” In: J. R. Behrman and T. N. Srinivasan Eds., Handbook of Development Eco- nomics, Vol. 3, Chapter 37, Elsevier Science, 1995, pp. 2209-2299. [18] R. R. Nelson, “On Technological Capabilities and their Acquisition,” In: R. E. Evenson and G. Ranis Eds., Sci- ence and Technology, Lessons for Development Policy, Westview Special Studies in Science, Technology, and Public Policy, 1990, pp. 71-80. [19] H. van Meijl and F. van Tongeren, “Trade, Technology Spillovers, and Food Production in China,” Welt- wirtschaftliches Archiv, Vol. 134, No. 3, 1998, pp. 443- 449. [20] G. G. Das, “Embodied Technology Transfer via Interna- tional Trade and Disaggregation of Labour Payments by Skill Level: A Quantitative Analysis in GTAP Frame- work,” 3rd Annual GTAP Conference in Global Eco- nomic Analysis Jointly Organized, the Centre of Policy Studies, Monash University, Melbourne, Australia and the Centre for Global Trade Analysis, Purdue University, West Lafayette, June 2000, pp. 1-20. [21] G. M. Grossman and E. Helpman, “Innovation and Growth in the Global Economy,” The MIT Press, Cam- bridge, 1991. [22] R. E. Lucas Jr, “Making a Miracle,” Econometrica, Vol. 61, No. 2, March 1993, pp. 251-72. [23] R. E. Lucas Jr, “On the Mechanics of Economic Devel- opment,” Journal of Monetary Economics, Vol. 22, No. 1, 1998, pp. 3-42. [24] S. Kosempel, “Interaction between Knowledge and Tech- nology: A Contribution to the Theory of Development,” Canadian Journal of Economics, Vol. 40, No. 4, 2007, pp. 1237-1260. [25] P. Dasgupta, “A Matter of Trust: Social Capital and Economic Development,” Annual World Bank Confer- ence in Development Economics (ABCDE), Seoul, May 2009, pp. 1-47. [26] A. K. Sen, “Infrapoverty,” Meeting Presentation for Re- port: Making Infrastructure Work for the Poor, Ja- pan-UNDP, UN, March 2006, pp. 1-6. [27] D. Cetin and M. Cincera, “Mutual Dependence of R&D and Trade,” Working Paper, Joint Research Centre-IPTS, European Commission, and TED Conference Paper, Iz- mir, May 2010. [28] R. Shankar and A. Shah, “Lessons from the European Union Policies for Regional Development,” The World Bank Policy Research Working Paper, WPS 4977, Washington DC, 2009, pp. 1-47. [29] H. Pack and L. E. Westphal, “Industrial Strategy and Technological Change: Theory versus Reality,” Journal of Development Economics, Vol. 22, No. 1, 1986, pp. 87- 128. [30] G. G. Das, “Trade, Endogenous Technology Capture and Induced Productivity: A Numerical Analysis,” Ride Jour- nal of Economics and Business (Korean), Hanyang Uni- versity, Ansan Campus, Seoul, Vol. 8, 2003, pp. 223-246. |