Food and Nutrition Sciences
Vol.4 No.9A(2013), Article ID:37070,12 pages DOI:10.4236/fns.2013.49A1025
Lipid Oxidation of Catfish (Arius maculatus) after Cooking and Smoking by Different Methods Applied in Cameroon
![]()
1Department of Biochemistry, Faculty of Science, University of Dschang, Dschang, Cameroon; 2Biomolecular Engineering Laboratory (LIBio), Université de Lorraine, ENSAIA, Vandoeuvre-les-Nancy, France; 3Lipotechny Laboratory, CIRAD, Montpellier, France.
Email: *womeni@yahoo.fr
Copyright © 2013 Noel Tenyang et al. This is an open access article distributed under the Creative Commons Attribution License, which permits unrestricted use, distribution, and reproduction in any medium, provided the original work is properly cited.
Received July 5th, 2013; revised August 5th, 2013; accepted August 12th, 2013
Keywords: Cooking Method; Lipid Oxidation; FTIR Spectroscopy; Smoking; Catfish
ABSTRACT
The influence of different cooking and smoking methods (boiling, frying, frying + boiling, hot and cold smoking) on oxidation and fatty acid composition of catfish (Arius maculatus) commercialized on the Wouri river coast was evaluated including commonly used analytical indexes (peroxide and acid values)and physical analysis by Fourier transform infrared (FTIR) spectroscopy. The mean moisture, protein, ash and fat contents of raw fish were 75.88 ± 0.55; 64.24 ± 0.14; 10.98 ± 0.31 and 23.02 ± 0.88 respectively. All these treatments provoke the modification of the quality indexes. Lipid deterioration, thermolysis and lipid oxidation occurred throughout the treatment. Peroxide value decreased for all cooked and smoked catfish, while free fatty acids of smoked sample increased. The FTIR applied to evaluate lipid oxidation in extracted lipid clearly provided a better picture of the oxidation progress and led to a similar conclusion with chemical analysis. Boiled, bleaching hot and bleaching cold smoking were found to be the suitable treatment methods for catfish because they gave it a high nutritive value compared to other smoking methods.
1. Introduction
The nutritional quality of food is very important. The nutritional importance of seafood has increased substantially because of the beneficial effects of eating seafood fats and oils [1]. Seafood is also an important source of high-protein and highly digestible protein and a respectable source of essential minerals [2]. The nutritional quality of seafood is affected by body part of the seafood being consumed, method of handling, processing (including cooking at home) season of harvest, sex and species [3]. Fish has long been recognized as a valuable source of animal protein in the diet of man. In the recent years, fish lipids have also assumed great nutritional significance, because of their high polyunsaturated fatty acid levels [4]. Polyunsaturated fatty acids (PUFAs), especially the n-3 and n-6 PUFAs, have been considered essential fatty acids and have been shown to have curative and preventive effects on cardiovascular diseases, neurodevelopment in infants, cancers and fat glycemic control [5]. Although it is generally recognized that PUFAs composition may vary among species of fish, little attention has been paid to the PUFAs composition of different species when selecting fish for diets. All fishesare considered to be of similar nutritional value, and selection is chiefly based on availability, freshness, flavour and similar factors [6]. Results of clinical and epidemiological research suggest that eicosapentaenoic (EPA) and docosahexaenoic (DHA) acids, found only in fish and seafood, have extremely beneficial properties for prevention of human coronary artery disease. In addition, the fish oil also helps to prevent brain aging and Alzheimer’s disease [5]. Many health experts suggest that two to three servings per week of seafood should beconsumed in order to meet the recommended level of essential fatty acids for pregnant women, children and elderly people [7]. It has been suggested that consuming EPA and DHA may reduce the risk of mortality from cardiovascular disease in people who have already experienced a cardiac event [8].
Studies of nutrient intake from fish, in relation to health, are frequently carried out with data obtained from raw food. However, PUFAs content in raw fish tissue may not provide explicit information on the nutritive value of the species after technological treatment.
Fish is a highly perishable commodity recording considerable losses in quantity before consumption. Locally, fish spoilage has been known to be influenced to a larger extend by high ambient temperatures, considerable distances of landing ports to points of utilisation, poorand inadequate infrastructure for post-harvest processing and landing. Investigation into such losses revealed sorting from artisanal fishing nets, limitation of processing equipment, absence of cold storage on smell fishing craft and poor water transport system as prevalent factors [9].
Heat (boiling, frying, grilling and roasting) is applied to food in different ways to improve its hygienic quality by inactivation of pathogenic microorganisms and to enhance its flavour and taste, and increase shelf life [10].
Fish is rarely eaten raw but is usually cooked in different ways before consumption. During cooking, the nutritive value of fish can be affected by: e.g. the content of thermolabile compounds, fat-soluble vitamins or polyunsaturated fatty acids is reduced [10]. Smoking is one of the most widely used fish processing methods employed in Cameroon to preserve the quality of fish. Smoke is produced by the process of incomplete wood combustion. It consists of numerous individual components namely: aldehydes, ketones, alcohols, acids, hydrocarbons, esters, phenols, etc. [11]. These components are transferred to the smoked goods by deposition on their surface and subsequent penetration into their flesh [11]. Smoking imparts a characteristic flavour and colour to the fish. In addition, smoking increases the shelf-life of fish as a result of the combined effects of dehydratation, antimicrobial and antioxidant activity of several of the smoke constituents [11,12]. Processing has been known to affect the chemical composition and fatty acids of fish. Several workers have linked the availability of vital nutrient of fish to the method of storage [13,14]. Storage time and temperature are the major factors implicated in the loss of quality and shelf life of fish [15]. Most processing methods serve not only to conserve the fish but also to alter their nutritive level. Reports exist in the agro industry that smoking is not only a conservation method but also a flavour, aroma and coloration improving method, which are attributes sought for by consumers [16].
Methods of smoking fish vary between countries and within the same country depending on the species of fish used and the type of derived product. In some countries, the fish is bleached before smoking. Traditional methods by combustion are used at a low temperature (cold smoking < 30˚C) or high temperature (hot smoking > 60˚C).
The effect of different processing and cooking methods on nutritional composition of different species of fish have been studied [17-20].
It has been observed that different processing and drying methods have different effects on nutritional composition of fish. This is because heating, freezing and exposure to high concentration of salt leads to chemical and physical changes and increased digestibility, due to protein denaturaton, but the content of thermolabile compounds and polyunsaturated fatty acids in often reduced. Therefore, the quality of fish dried using different methods cannot be the same.
During post mortem handling or storage, several reactions take place, particularly lipid deterioration [21]. There is no information available on the effect of cooking and smoking on lipid oxidation and fatty acids composition of catfish (Arius maculatus) in Cameroon.
The objective of this study is to evaluate the influence of different cooking and smoking methods on fatty acid profile and lipid oxidation of catfish including chemical indexes commonly used (Peroxyde Value, Acid Value) and evaluation by FTIR.
2. Materials and Methods
2.1. Collection of Sampling
Fish sample of catfish (Arius maculatus) were obtained from the fish market located in the Wouri river coast in Douala Cameroon. They were immediately transported to Biochemistry (LABPMAN) laboratory in ice containing boxes. The species was specially identified in the Department of Animal Biology of the University of Dschang Cameroon.
2.2. Cooking and Smoking Methods
2.2.1. Cooking Procedures
Fresh fish were washed with tap water several times to remove adhering blood and slime. They were prepared using a handling process, i.e. eviscerating, beheading and washing, and then common ways of cooking were used such as boiling, frying, and frying combined to boiling. The fish fillets were deep-fried in Mayor oil for 8 min. The frying temperature was around 170˚C. For the boiling process, the fish were dipped into boiling water for 5 min at approximately 97˚C (water temperature). After frying, some catfish were boiled inside water for 5 min. Sample of raw catfish were homogenized and used as an untreated control sample.
2.2.2. Smoking Procedures
Two traditional methods were used to smoke the fish: the heat smoking and the cold smoking. Each type of smoking has two types of fish: bleached fish and non-bleached fish.
The traditional heat smoking of catfishes subject to the combined treatments of drying, smoking and heat. The raw fish are spread out on smoking trays after washing without salting. The trays are then stacked on smoking oven fired with hard wood, and marked at temperature greater than 70˚C. The smoking takes a period of 6 to 7 hours to obtain a dry smoked product.
The cold smoking process was carried out at a temperature less than 30˚C. The fish was arranged on smoking trays; the loaded trays was then stacked on the smoking oven and smoked at temperature below 30˚C in the smoking-drying process. The smoking takes a period of 3 days to obtain a dry smoked product. Sample of raw or smoked fish filet were immediately homogenised.
2.3. Lipid Extraction
After different cooking and smoking treatments of catfish, lipids were extracted according to the method of Bligh and Dyer [22]. The extracted oils were then used for analysis.
2.4. Analytical Methods
2.4.1. Proximate Composition
1) Moisture content Moisture content was determined in fish muscle in duplicate according to AOAC [23], in an oven, at 105˚C for 24 h.
2) Fat content Total crude fat from muscle tissues was determined with the help of Soxhletapparatus using the non-polar organic solvent hexane according to AOAC [23].
3) Determination of crude protein Nitrogen (N) contents of fish muscle samples were determined by the method AOAC [24]. The N content was multiplied by 6.25 to estimate the crude protein (CP) of these samples.
4) Ash content Ash content determined by burning the organic components from the known weight of the homogenised dried fish muscle by using a furnace at 550˚C [24].
2.4.2. Chemical Analyses
1) Measurement of free fatty acid (FFA)
Free fatty acid content was determined according to the method of AFNOR [25].
2) Measurement of peroxide value (PV)
Peroxide value was determined according to the method of AFNOR [25].
2.4.3. Fatty Acids Composition
Lipids were extracted from the muscle tissues using the Bligh and Dyer [22] method, and fatty acid composition of oils were investigated after conversion of their Fatty Acid Methyl Esters (FAME) by using boron trifluoridemethanol method. About 50 mg of oil was heated under nitrogen atmosphere at 100˚C in 1.5 ml hexane and 1.5 ml boron trifluoridein methanol (8% solution) for 1 h in screw capped (teflon-lined) glass centrifuge tubes. Water was added and the FAME were extracted with hexane (3 ml), dried over anhydrous sodium sulphate and the solvent was evaporated under a nitrogen stream. One micro litre of 2 ml−1 hexane FAME was injected into the gas chromatograph. Analytical Gas Chromatography (GC) of FAME was carried out in a Perichrom 2000 system (Saulx-les-Chartreux, France), equipped with a Flame Ionization Detector (FID) and a fused silica capillary column (30 m × 0.22 mm, 0.25 μm film thickness), BPX70 SGE Australia Pty, Ltd (Victoria, Australia). Data were calculated using the normalized peak area percentages of fatty acids.
2.4.4. Fourier Transform Infrared (FTIR) Spectra Analysis
IR spectra between 3800 and 800 cm−1 were recorded using a tensor 27 (Bruker, Wissemberg, France) equipped with an ATR prism crystal accessory and MCT detector (Mercury Cadnium Telluride). The spectra resolution was 4 cm−1. Measurements were performed at RT using approximately 2 mL of the extracted lipids, which were placed on the surface of the ATR crystal and pressed with a flat-tip plunger until spectra with suitable peaks were obtained. The background was subtracted using the spectrum software OPUS version 6.3.2 (Perkin-Elmer Inc.).
2.5. Statistical Analysis
Data were subjected to analysis of variance (ANOVA). Comparison of means was carried out by Dunnet and Bonferroni tests. Statistical analysis was performed using the Statistical Package for Social Science (SPSS 11.0 for windows, SPSS Inc, Chicago, IL).
3. Results and Discussion
3.1. Proximate Composition
The proximate compositions of raw catfish are presented in Table 1 below. The values obtained for moisture (% wet Weight), crude protein, ash and fat content (% dry weight) from the present study are 76.48, 64.24, 10.98 and 23.02 respectively. Catfish is considered as a fatty fish because it has a high content of fat [26]. Most of catfish lipid is dominated by unsaturated fatty acids, which have important physiological functions [27]. Raw catfish samples were found to be a very good source of
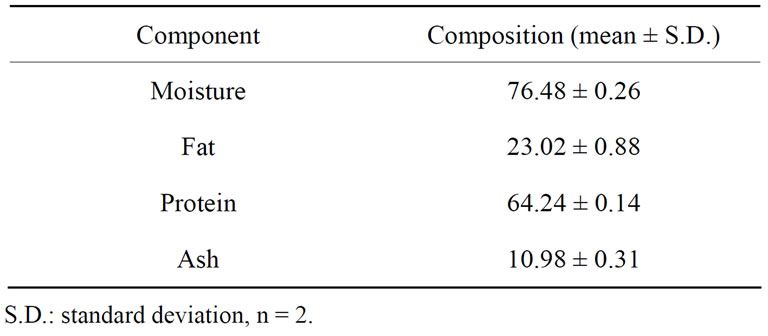
Table 1. Proximate composition of catfish (Arius maculatus), g/100g dry weight.
protein. In the present investigations, crude proteins were much higher than the protein levels for Carp (16% wet weight; [28]) and Tilapia (50% - 55% dry muscle tissue; [29]). The consumption of catfish could help to prevent some problems due to deficiencies of protein in the diet of people in developing countries.
The crude ash obtained in this work is between 9% and 22%, which is in agreement with values reported by Liceaga-Gesualdo and Li-Chan [30] in other fish. The high ash content of this fish proved that it is a source of minerals.
3.2. Fatty Acid Composition
The fatty acid profiles of raw sample of catfish are presented in Table 2. The most abundant fatty acids found in raw catfish were oleic acid (C18:1n-9) palmitic acid (C16:0) and stearic acid (C18:0).
These findings are in agreement with those reported by other authors in catfish samples [31,32]. Raw catfish also showed considerable amounts of myristic acid (C14:0), palmitoleic acid (C16:1), eicosapentenoic acid (C20:5n-3: EPA) and docosahexanoic acid (C22:6n-3: DHA). DHA is the dominant n-3 fatty acids in marine fish. Since DHA is the major component of brain, eye retina and heart muscle. DHA has been considered as important for brain and eye development and also good cardiovascular health [5]. However, catfish had low level of the n-3 PUFA linolenic acid (C18:3n-3). Then n-3/n-6 ratio (2.34) of catfish in this study is high when compared to that of Japanese catfish (~1), and to that obtained by Weber et al. [32] and Shirai et al. [31] of catfish (0.3 and 0.2 respectively). The consumption of fatty fish meat, from such species as herring and mackerel at least three times a week in the amount of 200 - 300 g according to recommendation by Stone [33] can play a significant role in preventing circulatory disorders.
3.3. Acid Value of Oils Extracted from Processed Catfish
3.3.1. Cooking Treatments
To consider the complexity of the lipid oxidation process,
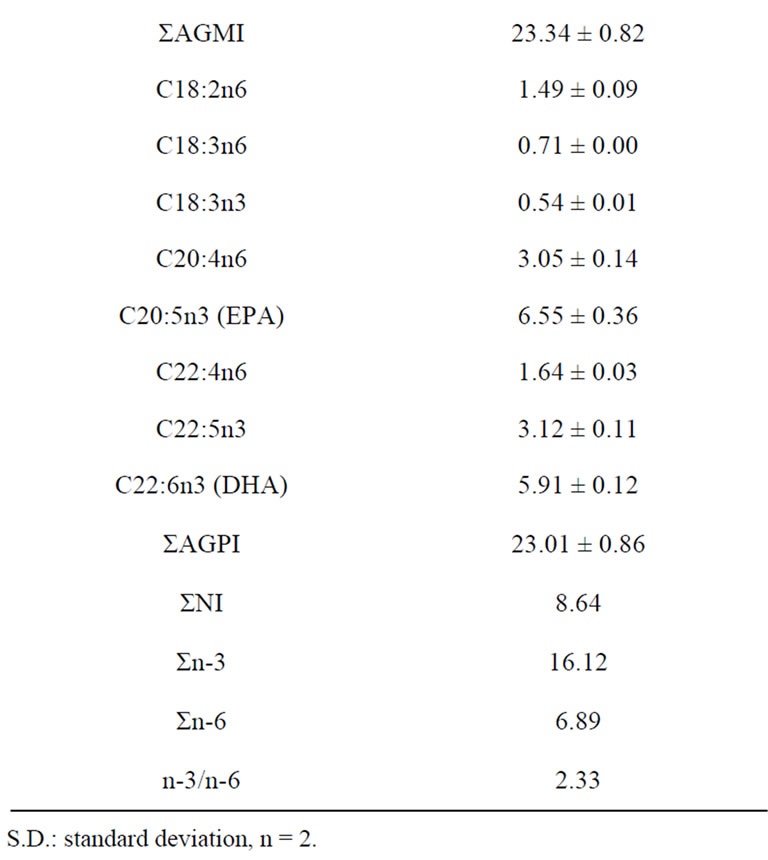
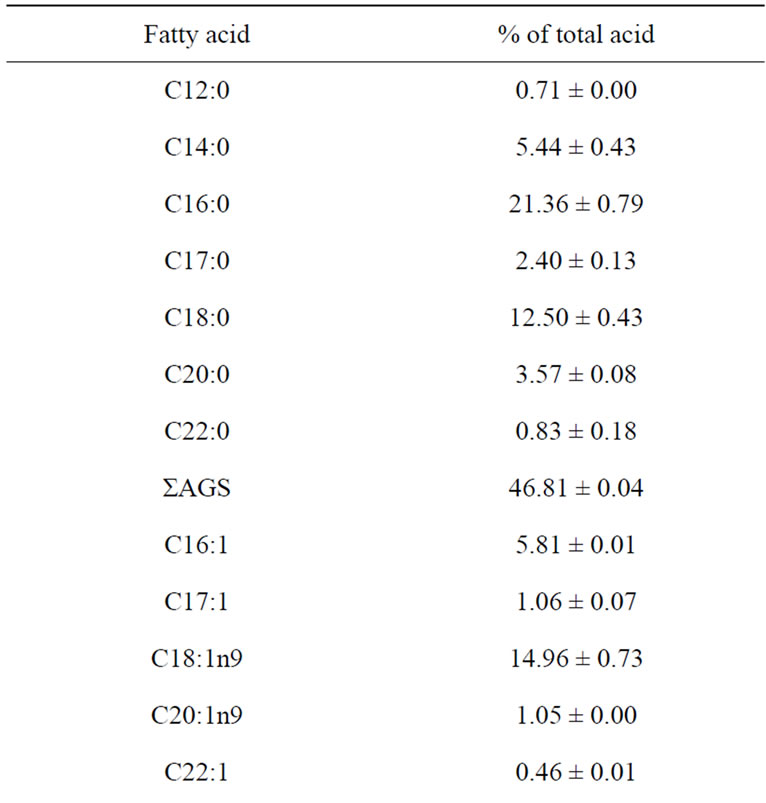
Table 2. Fatty acid composition (% of total fatty acid) of raw catfish.
protein. In the present investigations, crude proteins were both the primary and secondary oxidation products have been assessed. Acid value is a parameter of rancidity used to check the quality of oil. Change of free fatty acids (percentage of oleic acid) in catfish cooking by different methods (boiling, frying and frying combined to boiling) is depicted in Table 3. There was not a significant different in free fatty acid value of boiled, frying or frying combined to boiling fillets when compared to the
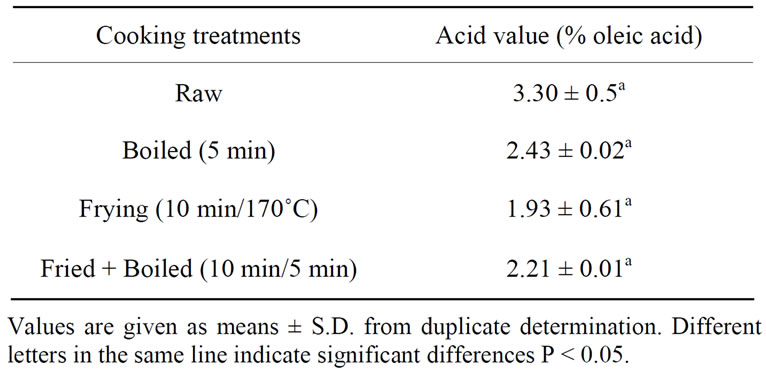
Table 3. Free fatty acids of cooked catfish.
raw fillet. Our results for frying fillets are not in agreement with those of Weber et al. [32] who observed the decrease free fatty acids content in catfish fillets during frying.
3.3.2. Smoking Treatments
Table 4 presents the free fatty acid content of the catfishoils after smoking (hot and cold smoking) treatment. Initial free fatty acid content of raw sample was 3.67% oleic acid, but increased significantly (P > 0.05) after hot and cold smoking. These results are in agreement with those of Labuza [34] who observed an increase of free fatty acid in food during deshydration and storage. It was observed that the fat acidity of traditional bleaching hot and cold smoked catfish was not significantly affected. Theincrease of free fatty acid during hot treatment could be explained by the thermolytic activity occurring during these processes. During cold smoking (temperature < 30˚C), smoke produced by firewood prevents the release of free fatty acid due to lipase activity. Bleached smoked sample compared to smoked sample has the low content of free fatty acid. This may be due to the inactivation of endogenous enzymes during bleaching.
Bleaching treatment appears to be an important pretreatment necessary to prevent the release of free fatty acid by inactivation of hydrolytic enzyme.
3.4. Peroxide Value of Oils Extracted from Processed Catfish
3.4.1. Cooking Treatments
Fat fish are sources of polyunsaturated fatty acids. These fatty acids are very sensitive to oxidation reactions. The oxidation rate of these fatty acids depends on several factors: storage conditions, temperature, fatty acid profile of the initial sample [35]. Peroxide compounds are the primary products formed during the oxidation reactions. They are very unstable molecules, which are rapidly broken down into secondary oxidative products such as aldehyds, ketons, and alcohols. The peroxide values of the oils extracted from catfish after cooking are presented in Table 5. These results show that cooking affects the
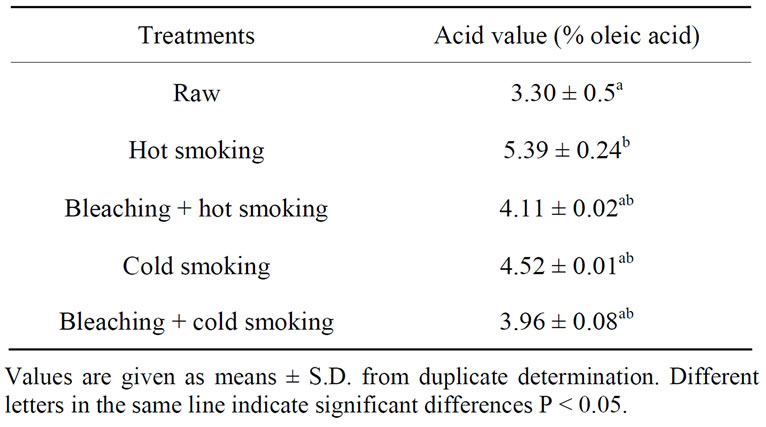
Table 4. Free fatty acids of smoked catfish oils.
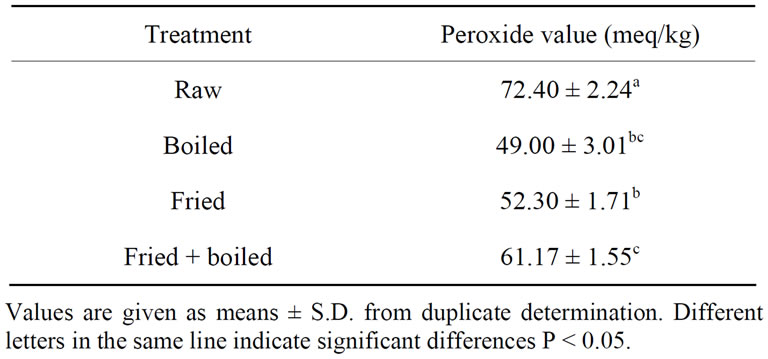
Table 5. Peroxide value of cooked catfish oils.
peroxide value of catfish lipid. Peroxide value decreased significantly after cooking by different methods (p < 0.05). Fried followed by boiled presented the highest peroxide value (61.17 meq/kg) while the lowest was obtained for boiled and fried samples (~50 meq/kg). Fried combined to boiled samples compared to fried samples has high peroxide value; although there is a report of unchanged peroxides after the deep-frying of Sardine [36], and boiled catfish [32]. Aro et al. [37] observed an important decrease in the peroxide value after the frying of herring fillets. Increase of peroxide value would not favouroxydases because cooking is done at more than 100˚C and lipoxygenases are inhibited at 60˚C [38]. At high temperature, the initial peroxide formed exists only transiently and will rapidly transform into various volatiles and non-volatiles compound [32]. This could explain the decrease of peroxide value for catfish after cooking.
3.4.2. Smoking Treatments
Table 6 shows the peroxide value of catfish oils extracted after different smoking methods.
A marked decrease in peroxide value was observed in catfish muscle after different smoking methods (P < 0.05). Bleaching followed by hot smoking presented the highest peroxide value (55.00 meq/kg) while the lowest was obtained for hot and cold smokers samples (~17 meq/kg).
Our results are in accordance with those of Aro et al.
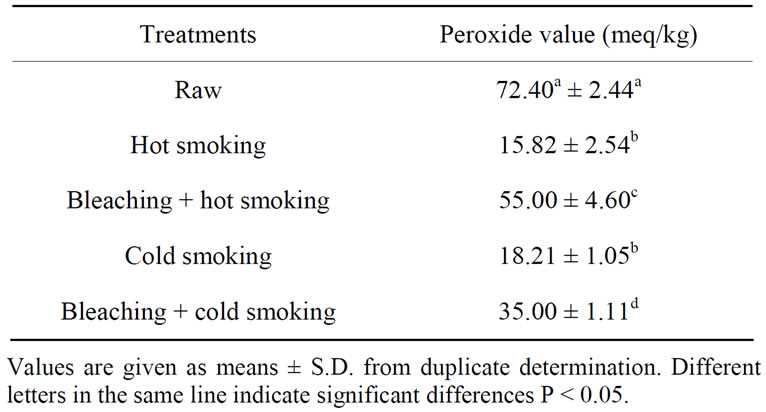
Table 6. Peroxide value of smoked catfish oils.
[37] who observed decrease of peroxide value during hot treatment of fish. Bleaching sample compared to other smoked samples had a higher peroxide value. A significant decrease of peroxide value confirms that peroxides were unstable components and were highly susceptible to further changes. Hydroperoxides break down in several steps, yielding a wide variety of decomposition products, including aldehydes [39]. From the results, the lipid occurred in catfish muscle during smoking, probably due to the high content of unsaturated fatty acids. Lipid oxidation is a complex process in which unsaturated fatty acids react with molecular oxygen, usually via a free radical mechanism, to form hydroperoxides; the primary oxidation products [40].
3.5. Analytical Evaluation of Changes Occurring in Catfish Oils during Cooking and Smoking by Infrared Spectroscopy (FTIR)
Infrared spectroscopy was used to determine in a qualitative way the organic components of samples of cooking fish oils. The spectrometer used has a major advantage due to the fact that, the absorption bands are repeated with accuracy and without delay [41]. Crude lipids extracted from horse catfish were also characterized by FTIR (Figure 1).
Generally, the FTIR spectrum exhibited similar regions of functional groups vibrations as reported previously for mackerel fish lipids [42], farmed salmon fillets lipids [43], as well as for some vegetable oils [44].
On the spectra of Figure 1, we can identify the different functional groups of the oils at room temperature between 3800 and 800 cm−1. The band associated with the overtone of the glyceride ester carbonyl absorption showed a maximum absorbance near 3448 cm−1 [43]. The weak band associated with hydroxyl groups newly formed during the oxidation appears in the Figure 1 above near 3350 cm−1. Lazzari and Chiantou [45] found similar bands when analyzing the oxidative degradation of linseed lipids. The peak at 3010 cm−1, related to the C-H stretching vibration of the cis-double bond (=CH),
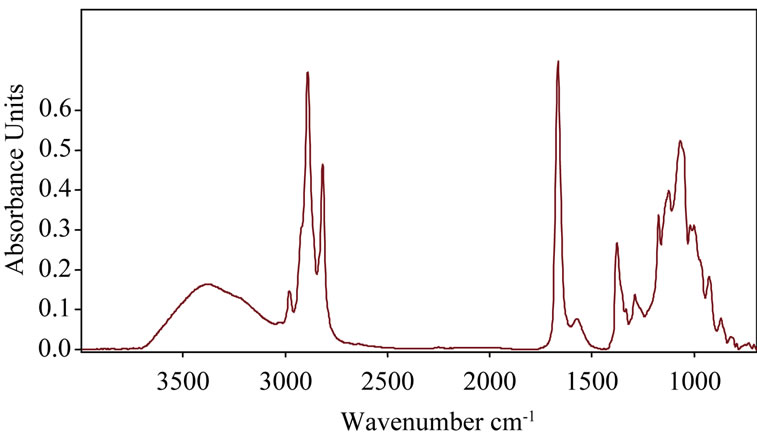
Figure 1. Representative fourier transform infrared spectrum of lipids extracted from raw catfish in 3800 - 800 cm−1 region.
appeared at the same wavenumber in salmon lipids [43]. The two peaks just below 3000 (2924 and 2853 cm−1) can both be assigned to absorption caused by asymmetric and symmetric stretching vibrations of methyl groups. Valdes and Garcia in 2006 also observed two absorption bands at about 2925 cm−1 and 2855 cm−1 when analyzing lipids rich in long chains polyunsaturated fatty acids. Similar results were obtained by Giménez et al. [42] when analyzing the state oxidation of mackerel lipids. The stretching vibration band assignable to the C=O group of triglycerides was found at around 1750 cm−1, whereas values of 1746 and 1741 cm−1 were reported in salmon and in sardine lipids, respectively [46,43]. As described for salmon and sardine, between 1600 cm−1 and 1700 cm−1, small bands centered at 1655 cm−1 was visible and assignable to the stretching vibrations of carbon-carbon double bond cis. The bands associated with the fingerprint region observed between 1500 cm−1 and 900 cm−1 can accurately characterize the molecules; similar to those bands reported for lipids from different sources. However, it should be noted that the peaks at 1375 cm−1 and 1461 cm−1 are associated with deformation vibrations of CH2 and CH3 groups. These bands were also found by Guillén and Cabo [47]. According to Guillén and Cabo [48], the peaks at 1250 cm−1 and 1150 cm−1 would be associated with the stretching vibration of the C-O ester group and the bending vibration of the CH2 group, both related to the proportion of saturated acyl groups in oil sample. The bands appearing at 975 cm−1 are related to the vibration in the molecules analyzed double bonds trans. Guiménez et al. [42] have found this peak at about 968 cm−1 in the study of oxidation of mackerel oil. In the Figure 1 above, this peak is not visible.
3.5.1. Cooking Treatments
A study of the effect of cooking the region between 3800 and 3000 cm−1 (Figure 2(a)) give a larger band with
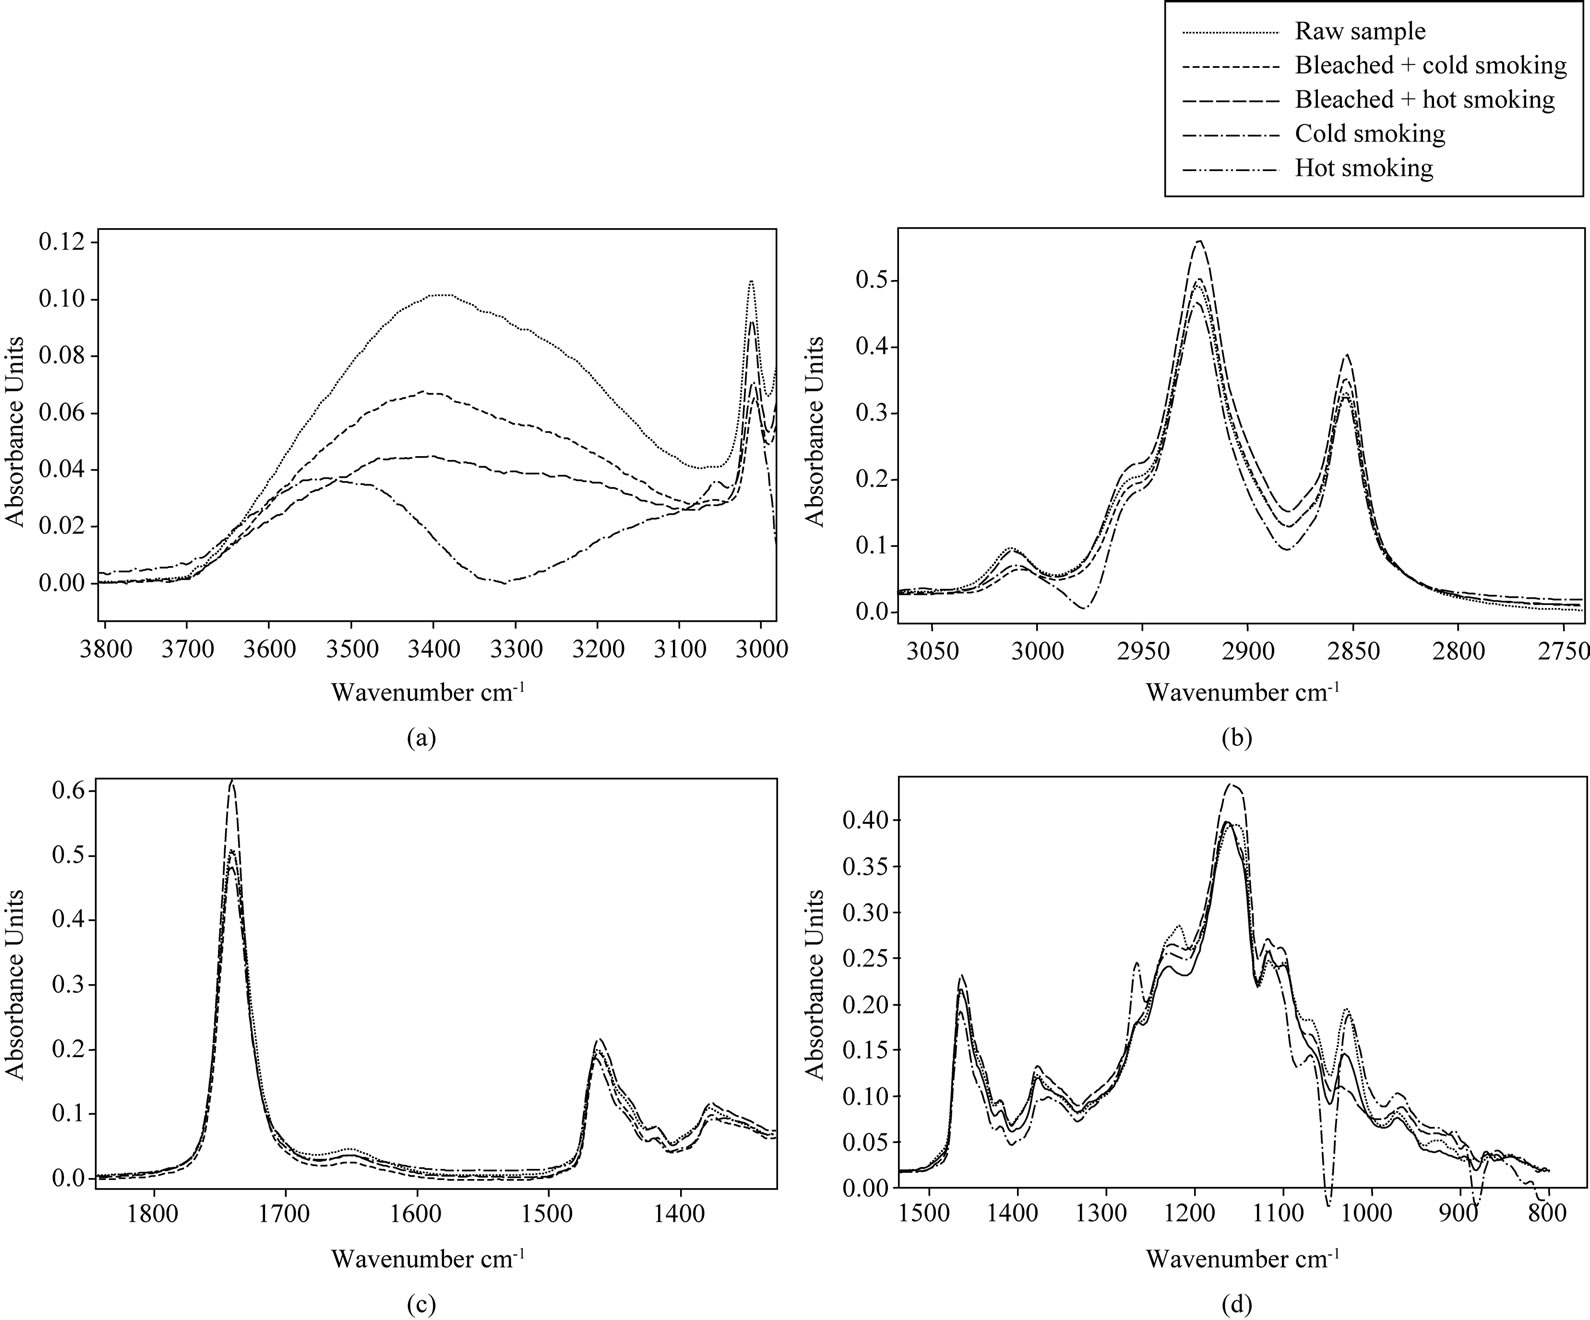
Figure 2. Selected region (a)-(d) of FTIR spectra of lipids extracted from cooked catfish.
variable intensity. Raw catfish oil had a higher band while fried + boiled catfish oil had a low band. Decrease of the absorbance band after frying suggesting the decomposition of hydroperoxide to yield secondary lipid oxidation products due to heat [49]. These results were coincidental with the decrease in peroxide value obtained during chemical analysis. A reduction in the degree of lipid unsaturation due to eventual oxidative process after cooking methods could be evidenced by monitoring the peak at 3010 cm−1 (3012 cm−1 in mackerel fish oil; [42]). At this wave number, control sample had the higher band and suggests that it has a higher cis double bond, while fried sample had a weak band. Fried + boiled catfish oil had a higher unsaturated fatty acid content compared to fried catfish oil. Decrease of the band during heat treatment is due to lipid oxidation. These results coincided with CPG analysis. Tukkan et al. [20] also reported a reduction of unsaturated fatty acids during cooking of Seabass by different methods. During oxidation reactions, the major structural modification of polyunsaturated lipids is the decrease of ethylenic double bonds by the attack of oxygen with the formation of oxidation compounds [50]. At about 2950 and 2850 cm−1 (Figure 2(b)), two other peaks appear and characterize the stretching vibrations of CH2 functional groups. However, the higher band was attributed to boiled catfish oil while the weak band was attributed to fried + boiled sample. Increase of this band in fried fish compared to control could be due to absorption of fried oil by catfish during frying treatment. A reduction absorbance at fried + boiled sample indicated an appreciable lowing of concentration of CH3 and CH2 functional groups. The decrease of these peaks is related to the oxidation of oils with decrease of unsaturations. Giménez et al. [42] have shown while analysing oils which are rich in polyunsaturated fatty acids that bands in wave number 2925 and 2854 cm−1 associated to CH3 and CH2 respectively decreased with oxidation. Vlachos et al. [44] also reported a reduction in the absorbance of these bands as related to oxidative change in vegetable oils. Generally, changes in the carbonyl absorption of tryglycerides ester linkage at around 1750 cm−1 (Figure 2(c)) were reported as a main FTIR event denoting lipid oxidation whereas a value of 1746 cm−1 was reported by Moya Moreno et al. [51]. Smith [52] reported that changes in infrared band positions were typically caused by changes in the electronic structure, as well as changes in force constant of a molecule. Boiled catfish oil had a higher band. This means that, this sample had a higher carbonyl groups of ester linkage of triglycerides while boiled + fried catfish oil presented the weak band. Fried and raw catfish oil sample had the same content of carbonyl absorption of tryglycerides ester linkage. The lower band link to fried + boiled compare to control stipulated that alterations in that sample are higher. Thepeak located at 1670 cm−1 (Figure 2(c)) is related to carbon-carbon double bond stretching vibrations of cis-olefins and does not clearly show an improvement in the appearance of different absorption bands. According to Hayati et al. [53], spectrum alteration within band 1650 - 1600 cm−1 could be the result of the formation of conjugated double bonds, whose absorptions would be overlapped with that of O-H bending, also assignable to this spectral region, both signals coming from hydroxides accumulation. The absorption spectrum between 1500 and 900 cm−1 (Figure 2(d)) called “fingerprint”, allows a much more accurate characterization of a molecule or group of molecules. Two bands around 1460 and 1370 cm−1 characterized a deformation vibrations of CH2 and CH3 groups present in lipids [47]. Boiled catfish sample had a higher band while fried + boiled had the lower band. The intensity of these bands decreases with the intensity of oxidation. Fried + boiled samples are more altered. The spectral region between 1280 and 1050 cm−1 was slightly altered for fried + boiled sample (Figure 2(d)). Around 1160 cm−1 (Figure 2(d)), the appearance of a band seems to be related to the saturated acyl groups in lipids. In this figure, for this wave number, boiled catfish oil had the higher band while fried + boiled sample had a lower band. Decrease in the intensity of this band during the fried + boiled process is related to lipid oxidation. These results are similar to those obtained by Mahmoud [54] in the study of the oxidation state of oils of the eggs of rainbow trout.
3.5.2. Smoking Treatments
Figure 3 shows the effect of smoking methods on selected IR regions taken from the spectra of lipids extracted from catfish.
The region between 3800 and 3100 cm−1 (Figure 3(d)) is specifically for hydroxyl groups (peroxides and hydroperoxides). In this region, raw lipid catfish had the most pronounced peak. The decrease of the absorbance band was observed in the case of smoking treatment and cold smoked catfish oil had a lower band. The decrease of the absorbance band after smoking also suggests the decomposition of hydroperoxide to yield secondary lipid oxidation products [49]. These results coincide with the decrease in peroxide value obtained during chemical analysis. A reduction in the degree of unsaturated lipid due to eventual oxidative process during the smoking treatment could be evidenced by monitoring the peak at 3010 cm−1. At that wave number, raw sample had the higher band and this suggests that it has a higher cis double bond, while cold smoked sample had a lower band. Decrease of the band during smoking treatment is due to lipid oxidation. Bleached combined to hot smoked sample presented the higher cis double bond compared to other smoked samples. At about 2950 and 2850 cm−1 (Figure 3(b)), the higher band was attributed to the raw sample. A significant reduction of absorbance at hot and cold smoked samples indicated an appreciable lowing of concentration of CH3 and CH2 functional groups. The decrease of these peaks is related to the oxidation of oils with decrease of unsaturation [42]. At 1750 cm−1 (Figure 3(c)) corresponding to carbonyl ester of triglycerides, we see that the intensities of the bands were the same as in 2950 and 2850 cm−1. The order of oxidation also increased in this direction because oxidation reaction increases with decrease of esters of triglycerides. A decrease in the absorbance at this wave number was visible and more pronounced in hot and cold smoked samples, showing a clear broadening of the band to lower wave number. According to Guillén et al. [43], these decreases of bands are probably due to the appearance of aldehyde and ketones, which are secondary oxidation products derived from the degradation of hydroperoxides. The peak located at 1670 cm−1 (Figure 3(c)) showed clearly an improvement in the appearance of different absorption bands. The most intense band is related to the raw and bleached combined to hot smoked samples. Decreases of this band during smoking treatment for others smoked samples are probably linked to oxidative phenomena. According to Hayati et al. [53], spectrum alteration within band 1650 - 1600 cm−1 could be the result of the formation of conjugated double bonds, whose absorption would be overlapped with that of O-H bending, also assignable to this spectral region, both signals coming from hydroxides accumulation.
Figure 3(d) presented two bands around 1460 and 1370 cm−1, characterizing a deformation vibrations of CH2 and CH3 groups present in lipids [47]. Raw catfish oil had a higher band while hot and cold catfish oils had
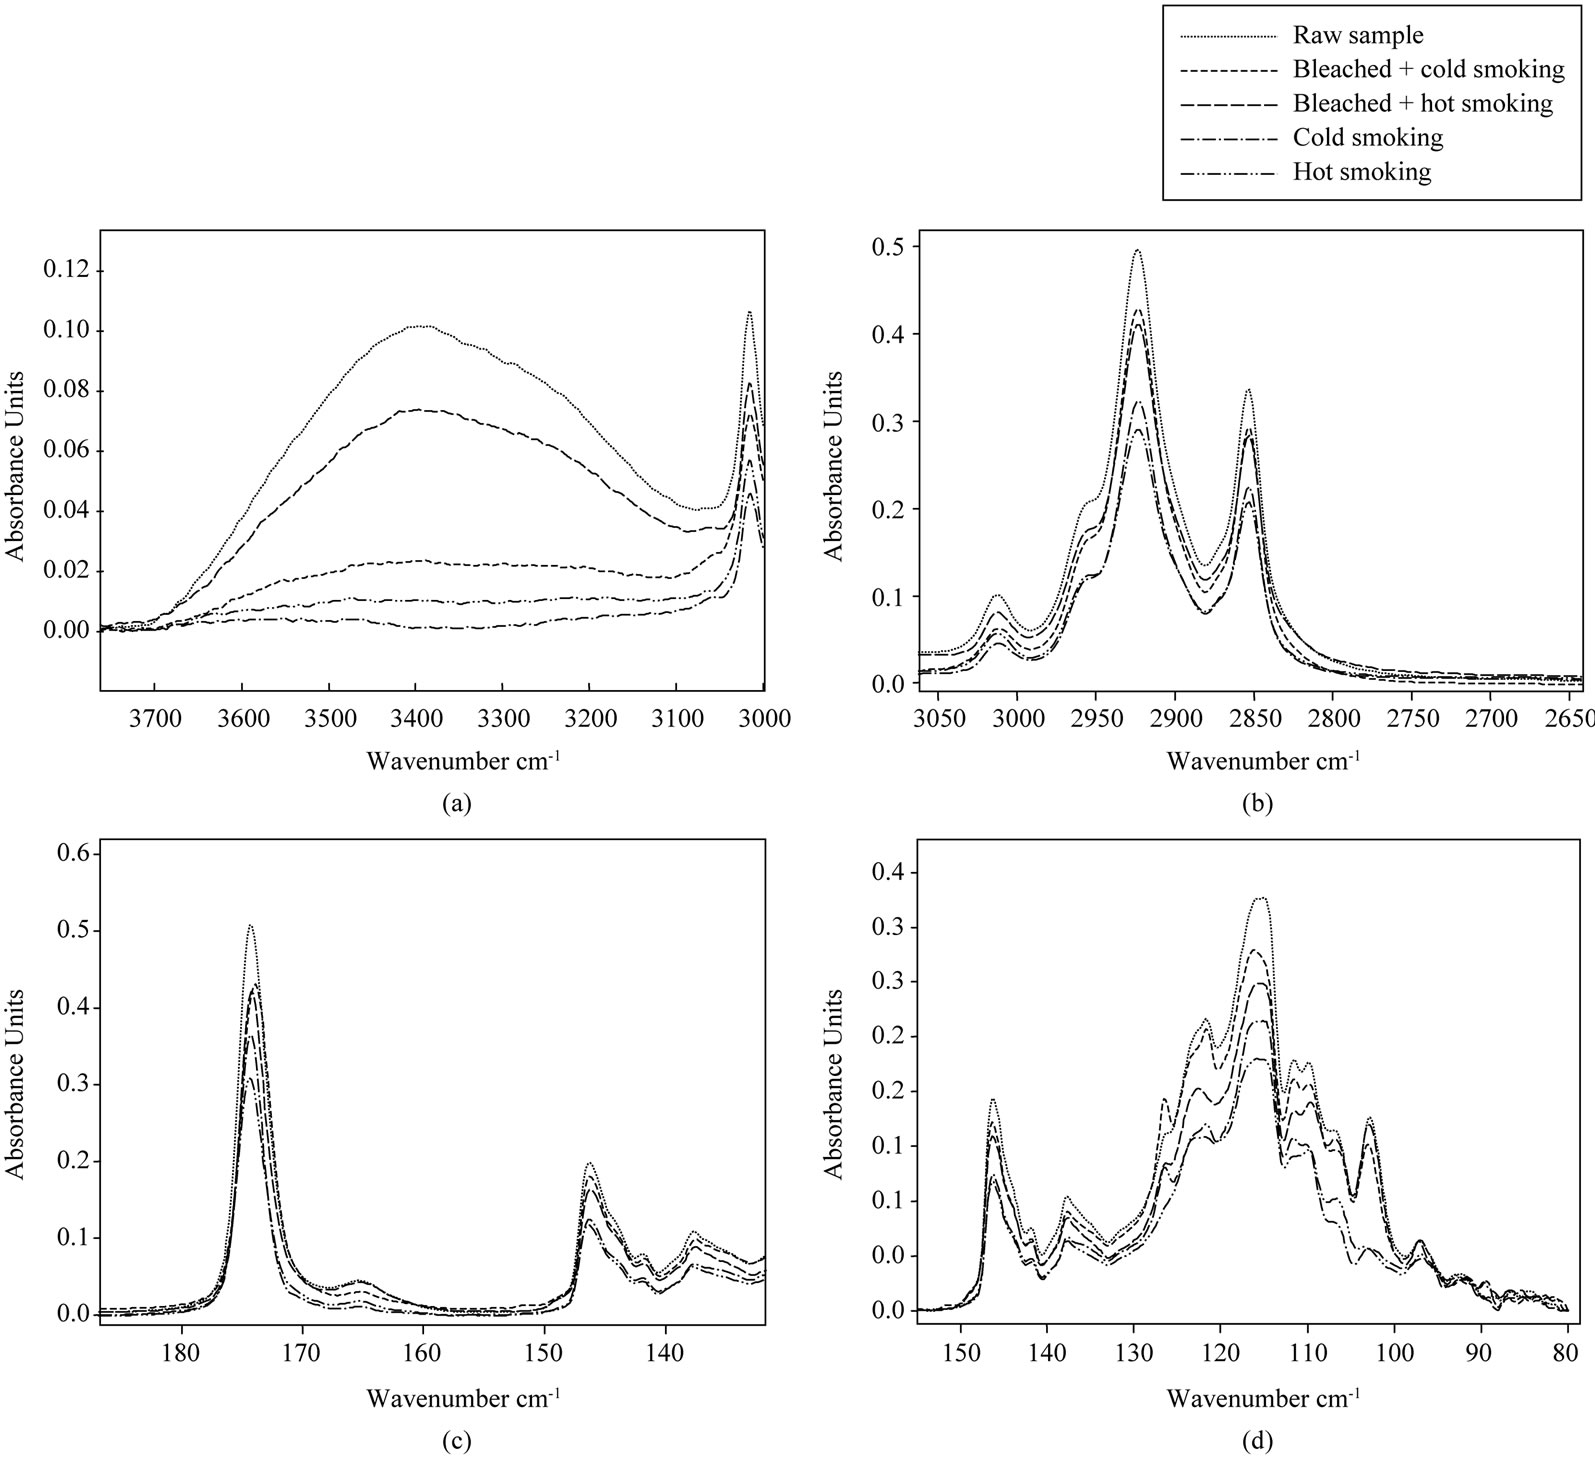
Figure 3. Selected regions (a)-(d) of FTIR spectra of lipids extracted from smoked catfish.
the weak bands. Decreases of the intensity of these bands are linked to the intensity of oxidation. Hot and cold smoked samples are more altered. The spectral regions between 1280 and 1050 cm−1 was slightly altered at hot and cold samples (Figure 3(d)). Around 1160 cm−1 (Figure 3(d)), hot smoked catfish oil had the lower band while raw catfish oil had a higher band. The decrease in the intensity of this band during the smoking process is related to lipid oxidation.
4. Conclusions
The present experiment demonstrates that catfish from the studied area is a fat fish. It is a good source of fatty acids and protein. This fish speciescontains essential polyunsaturated fatty acid such as EPA and DHA, which are good for health. Catfish lipids were susceptible to hydrolysis and oxidation during cooking and smoking processes. Hydroperoxides were generated and underwent some changes to yield secondary oxidation products, especially aldehydes and ketones. An increase in oxidation, indicated by an increase of free fatty acids, a decrease of triglycerides and hydroperoxide was observed throughout the cooking and the smoking treatment.
Boiling was found to be the most suitable treatment, because boiled catfish had a higher nutritive value (from the PUFAs’ intake), than had other cooked fish. The present experiment also demonstrates that bleached combined to cold smokingand bleached combined to hot smoking were the best methods to smoke catfish.
REFERENCES
- K. Azam and M. Y. Ali, “Biochemical Assessment on Selected Fresh Fish,” Journal of Biological Sciences, Vol. 4, No. 1, 2004, pp. 9-10. doi:10.3923/jbs.2004.9.10
- J. A. Nettleton, “Seafood Nutrition in the 1990s,” In: E. G. Bligh, Ed., Seafood Science and Technology, Fishing New Books, London, 1992, pp. 32-39.
- J. Krzynowek, “Effects of Handling, Processing and Storage of Fish and Shellfish,” In: E. Karmas and R. S. Harris, Eds., Nutritional Evaluation of Food Processing, 3rd Edition, Van Nostrand Reinhold, New York, 1988, pp. 245- 265. doi:10.1007/978-94-011-7030-7_10
- P. Puwastein, K. Judprasong, E. Kettwan, K. Vasanachitt, Y. Nakngamanong and L. Bhattacharjee, “Proximate Composition of Raw and Cooked Thai Freshwater and Marine Fish,” Journal of Food Composition and Analysis, Vol. 12, No. 1, 1999, pp. 9-16. doi:10.1006/jfca.1998.0800
- W. E. Conner, “The Beneficial Effects of Omega-3 Fatty Acids: Cardio Vascular Diseases and Neurodevelopment,” Current Opinion in Lipidology, Vol. 8, No. 1, 1997, pp. 1-3. doi:10.1097/00041433-199702000-00001
- T. L. Hearn, S. A. Sgoutas, J. A. Hearn and D. S. Sgoutas, “Polyunsaturated Fatty Acids and Fats in Fish Flesh for Selecting Species for Health Benefits,” Journal of Food Science, Vol. 52, No. 5, 1987, pp. 1209-1215. doi:10.1111/j.1365-2621.1987.tb14045.x
- R. M. Krauss, H. R. Eckel, B. Howard, L. J. Appel, S. R. Daniels, R. J. Deckelbaum, J. W. Erdman, P. KrisEtherton, I. J. Golberg, T. A. Kotchen, A. H. Lichtenstein, W. E. Mitch, R. Mullis, K. Robinson, J. Wylie-Rosett, S. S. Jeor, J. Suttie, D. L. Tribble and T. L. Bazzarre, “AHA Dietary Guidelines. Revision 2000: A Statement for Healthcare Professionals from the Nutrition Committee of American Heart Association,” Circulation, Vol. 102, 2000, pp. 2284-2299.
- “Fish Oil and Angina/Hearth Attack, Hearth Benefits of Fish Oils,” 2002. http://www.oilofpisces.com/fishnews.html
- A. I. Opele, “Factors Influence Adoption of Innovations in Artisanal Fisheries in Ogun State,” M.Sc. Thesis, OlabisiOnabanjo, University, Ago Iwoye, 2002, p. 35.
- A. Bognar, “Comparative Study of Frying to the Other Cooking Techniques. Influence on the Nutritive Value,” Grasas y Aceites, Vol. 49, 1998, pp. 250-260. doi:10.3989/gya.1998.v49.i3-4.746
- P. E. Doe, “Fish Drying and Smoking. Production and Quality,” Technomic Publishing CO, Inc., Lancaster, 1998, pp. 89-115.
- F. Leroi and J. J. Joffraud, “Salt and Smoke Simultaneously Affect Chemical and Sensory Quality of ColdSmoked Salmon during 5˚C Storage Predicted Using Factorial Design,” Journal of Food Protection, Vol. 63, No. 9, 2000, pp. 1222-1227.
- R. Hardy and J. G. M. Smith, “The Storage of Mackerel (Scromber scoutbrus). Development of Histamine and Rancidity,” Journal of the Science of Food and Agriculture, Vol. 27, No. 7, 1976, pp. 595-599. doi:10.1002/jsfa.2740270702
- J. M. Ryder, G. C. Fletcher, M. G. Stec and R. J. Seelye, “Sensory, Microbiological and Chemical Changes in Hake Stored in Ice,” International Journal of Food Science & Technology, Vol. 28, 1993, pp. 169-180.
- K. J. Whittle, “Opportunities for Improving the Quality of Disheries Products,” In: J. B. Luten, T. Borrosen and J. Oehlenschlager, Eds., Sea Food from Producer to Consumer, Integrated Approach to Quality, Elseveer, Amsterdam, 1997, pp. 549-560.
- S. O. Ferreira,“Applicacao de Technologia a Especies de Pescado de Agua Doce Visando Atender a Agro Industria Rural,” Master of Science Dissertation Universidade de sao Paulo, Escola Superoir de Agricultura “Luiz de Queiroz” ESALQ-USP, Sao Paulo, 1987, p. 122.
- M. L. Gladyshev, N. N. Sushchik, G. A. Gubanenko, S. M. Demichierva and G. S. Kalachova, “Effect of Way of Cooking on Content of Essential Polyunsaturated Fatty Acids in Muscle Tissue of Humpback Salmon (Onchorhynchusgorbuscha),” Food Chemistry, Vol. 96, No. 3, 2006, pp. 446-541. doi:10.1016/j.foodchem.2005.02.034
- A. M. Candella, I. Astiasarán and J. Bello, “Effects of Frying and Warmholding on Fatty Acids and Cholesterol of Sole (Solea solea) Codfish (Gadusmorhua) and Hake (Merluccius merliccius),” Food Chemistry, Vol. 58, No. 3, 1996, pp. 227-231. doi:10.1016/S0308-8146(96)00169-0
- A. Eves and R. Brown, “Effects of Traditional Drying Processes on the Nutritional Values of Fish,” Tropical Sciences, Vol. 33, 1993, pp. 183-189.
- A. U. Türkkan, S. Cakli and B. Kilinc, “Effects of Cooking Methods on the Proximate Composition and Fatty Acid Composition of Seabass (Dicentrachuslabrax, Linnaeus, 1758),” Food and Bioproducts Processing, Vol. 86, 2008, pp. 163-166. doi:10.1016/j.fbp.2007.10.004
- S. Cho, Y. Endo, K. Fujimpto and T. Kaneda, “Oxidative Deterioration of Lipids in Salted and Dried Sardines during Storage at 5˚C,” Nippon Suisan Gakkaishi, Vol. 55, 1989, pp. 541-544. doi:10.2331/suisan.55.541
- E. G. Bligh and W. J. Dyer, “A Rapid Method of Total Lipid Extraction and Purification,” Canadian Journal of Biochemistry and Physiology, Vol. 37, No. 8, 1959, pp. 911-917. doi:10.1139/o59-099
- AOAC, “Official Methods of Analysis of the Association of Official Analysis Chemists,” 14th Editon, Association of Official Analytical Chemists, Washington DC, 1984.
- AOAC, “Official and Tentative Methods of Analysis of the AOAC,” AOAC, Washington, 1980, p. 978.
- AFNOR, “Recueil des Normes Françaises. Corps Gras, Graines Oléagineuses, Produit Dérivés,” 2nd Édition, AFNOR, Paris, 1981.
- H. H. Huss, “Quality and Changes in Fresh Fisheries,” Technical Paper, Vol. 348, 1995, p. 195.
- R. A. Lei and E. Y. Song, “Studies on Fatty Acid Composition of Pupae of the Silkworm Antheraeapernyi,” Chinese Traditional Patent Medecine, Vol. 20, No. 5, 1996, p. 34.
- FAO, “FAO Fisheries and Aquaculture-Chemical Elements of Fish,” 2008. http://www.fao.org/fishery/topics/14820/en
- N. E. Onyeike and U. J. Oguike, “Influence of Heat Processing Methods on the Nutrient Composition and Lipid Characterization of Groundnut (Arachishypogeaa) Seed Pastes,” Biokemistri, Vol. 15, No. 1, 2003, pp. 34-43.
- A. M. Liceaga-Gesualdo and E. Li-Chan, “Functional Properties of Hydrolysates from Herring (Clupeaharrengus),” Journal of Food Science, Vol. 64, 1999, pp. 1000- 1004. doi:10.1111/j.1365-2621.1999.tb12268.x
- N. Sharai, H. Suzuki, S. Tokairin, H. Ehara and S. Wada, “Dietary and Seasonal Effects on the Dorsal Meat Lipid Composition of Japanese (Silurus asotus) and Thai Catfish (Clariasmacrocephalus and Hybrid Clariasmacrocephalus and Clariasgalipinus),” Comparative Biochemistry and Physiology Part A, Vol. 132, No. 76, 2002, pp. 609-619. doi:10.1016/S1095-6433(02)00081-8
- J. Weber, V. C. Bochi, C. P. Ribeiro, A. M. Victorio and T. Emanuelli, “Effect of Different Cooking Methods on Oxidation, Proximate and Fatty Acid Composition of Silver Catfish (Rhamdiaquelen) Fillets,” Food Chemistry, Vol. 106, No. 1, 2008, pp. 140-146. doi:10.1016/j.foodchem.2007.05.052
- N. J. Stone, “Fish Consumption, Fish Oil, Lipids, and Coronary Heart Disease,” Circulation, Vol. 94, No. 9, 1996, pp. 2337-2340. doi:10.1161/01.CIR.94.9.2337
- T. P. Labuza, “Effect of Deshydration and Storage on Nutrient Retention in Food,” Food Technology, Vol. 27, 1974, pp. 20-26.
- M. Serdaroglu and E. Felekoglu, “Effetct of Using Rosemary Extract and Onion on Oxidative Stability of Sardine (Sardine pilchardus) Mince,” Journal of Food Quality, Vol. 28, No. 2, 2005, pp. 109-120. doi:10.1111/j.1745-4557.2005.00016.x
- F. J. Sanchez-Muniz, J. M. Viejo and R. Medina, “DeepFrying of Sardines in Different Culinary Fats. Changes in the Fatty Acid Composition of Sardine and Frying Fats,” Journal of Agricultural and Food Chemistry, Vol. 40, No. 11, 1992, pp. 2252-2256. doi:10.1021/jf00023a039
- T. Aro, R. Tahvonen, T. Mattila, J. Nurmi, T. Sivonen and H. Kallio, “Effects of Season and Processing on Oil Content and Fatty Acids of Baltic Herring (Clupeaharengusmembras),” Journal of Agriculturaland Food Chemistry, Vol. 48, No. 12, 2000, pp. 6085-6093. doi:10.1021/jf000389+
- S. Eymard, “Mise en Evidence et Suivi de l’Oxydation des Lipides au Cours de la Conservation et de la Transformation du Chinchard (Trachurus trachurus), Choix des Procédés,” Thèse de Doctorat, Université de Nantes, 2003, p. 143.
- W. W. Nawar, “Lipids,” In: O. R. Fennema, Ed., Food Chemistry, Marcel Dekker, Inc., New York, 1996, pp. 225-314.
- M. G. Smic and K. A. Taylor, “Free Radical Mechanisms of Oxidation Reactions,” In: A. J. S. Angelo and M. E. Bailey, Eds., Warmed-Over Flavor of Meat, Academic Press, Orlando, 1987, pp. 69-72.
- D. Bertrand, “La Spectroscopie Proche Infra Rouge et ses Applications Dans les Industries de l’Alimentation Animale,” INRA Prod. Anim, Paris, 2002, p. 566.
- B. Giménez, M. C. Cómez-Guillén, M. Pérez-Mateos, P. Montro and G. Márquez-Ruiz, “Evaluation of Lipid Oxidation in Horse Mackerel Patties Covered with BorageContaining Film during Frozen Storage,” Food Chemistry, Vol. 124, No. 4, 2011, pp. 1393-1403. doi:10.1016/j.foodchem.2010.07.097
- M. D. Guillén, A. Ruiz and N. Cabo, “Study of the Oxidative Degradation of Farmed Salmon Lipids by Jeans of Fourier Transforms Infrared Spectroscopy. Influence of Salting,” Journal of the Science of Food and Agriculture, 84, No. 12, 2004, pp. 1528-1534. doi:10.1002/jsfa.1811
- N. Vlachos, Y. Skopelitis, M. Psaroudaki and V. Konstantinidou, “Application of Fourier Transform Infrared Spectroscopy to Edible Oils,” Analysis Chemical Acta, Vol. 573, 2006, pp. 459-465.
- M. Lazzari and O. Chiantore, “Drying and Oxidative Degradation of Linseed Oils,” Polymer Degradation and Stability, Vol. 65, No. 2, 1999, pp. 303-313. doi:10.1016/S0141-3910(99)00020-8
- M. Chaijan, S. Benjakul, W. Visessaguan and C. Faustman, “Changes of Lipids in Sardine (Sardinellagibbosa) Muscle during Iced Storage,” Food Chemistry, Vol. 99, No. 1, 2006, pp. 81-83. doi:10.1016/j.foodchem.2005.07.022
- M. D. Guillén and N. Cabo, “Usefulness of the Frequency Data for the Fourier Transfor Infrared Spectra to Evaluate the Degree of Oxidation of Edible Oils,” Journal of Agricultural and Food Chemistry, Vol. 47, 1999, pp. 709- 719.
- M. D. Guillén and N. Cabo, “Infrared Spectroscopy in the Study of Edible Oils and Fats,” Journal f the Science of Food and Agriculture, Vol. 75, No. 1, 1997, pp. 1-11. doi:10.1002/(SICI)1097-0010(199709)75:1<1::AID-JSFA842>3.0.CO;2-R
- F. R. Vandervoot, A. A. Ismail, J. Sedman, J. Dubois and T. Nicodemo, “The Determination of Peroxide Value by Fourier Transform Infrared Spectroscopy,” Journal of American Oil Chemistry Society, Vol. 71, 1994, pp. 921-926.
- B. Muik, B. Lendl and M. J. Ayora-Canada, “Direct Monitoring of Lipid Oxidation in Edible Oils by Fourier Transformer Raman Spectroscopy,” Chemistry and Physics of Lipids, Vol. 134, No. 2, 2005, pp. 173-182. doi:10.1016/j.chemphyslip.2005.01.003
- M. C. M. Moya Moremo, D. M. Olivares, F. J. Amezquita Lopez, G. Adelantado and F. Bosch Reig, “Determination of Unsaturation Grade and Trans Isomers Generated during Thermal Oxidation of Edible Oils and Fats by FTIR,” Journal of Molecular Structure, Vol. 482-483, 1999, pp. 551-556. doi:10.1016/S0022-2860(98)00937-5
- B. C. Smith, “Infrared Spectral Interpretation: A Systematic Approach,” CRC Press, New York, 1998.
- I. N. Hayati, Y. B. Man, C. P. Tan and L. N. Aini, “Monotoring Peroxide Value in Oxidized Emulsions by Fourier Transform Infrared Spectroscopy,” European Journal of Lipid Science and Technology, Vol. 107, No. 12, 2005, pp. 886-895. doi:10.1002/ejlt.200500241
- K. Al-Sayed Mahmoud, “Extraction, Fractionnement et Caractérisation des Lipides Polyinsaturés d’œuf de la Truite Arc-en-Ciel,” Mémoire de Thèse de Doctorat, 2007, p. 133.
NOTES
*Corresponding author.