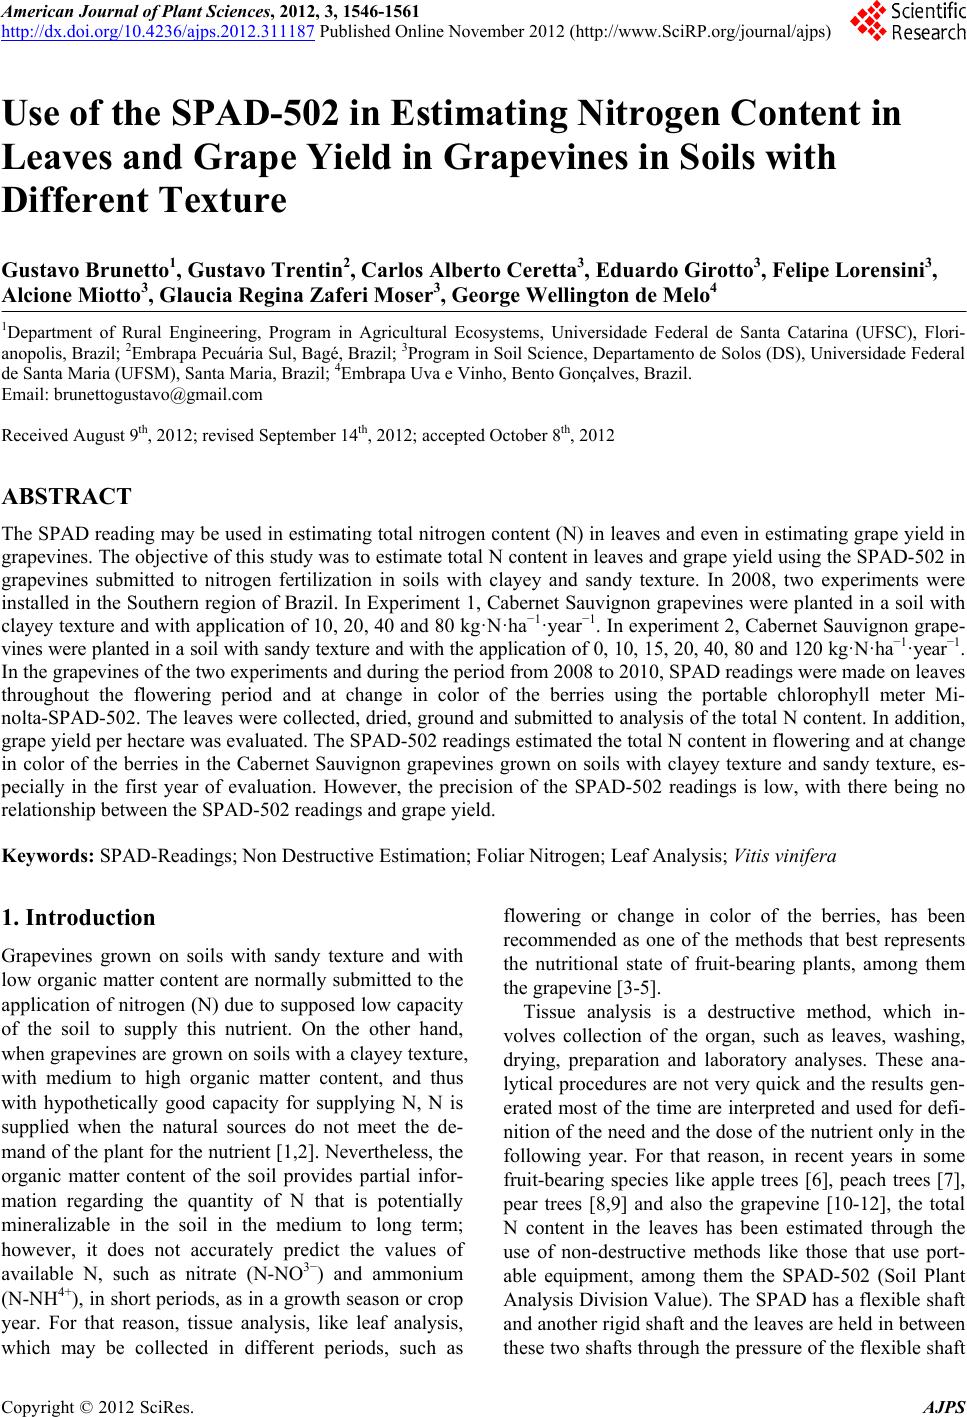
 American Journal of Plant Sciences, 2012, 3, 1546-1561 http://dx.doi.org/10.4236/ajps.2012.311187 Published Online November 2012 (http://www.SciRP.org/journal/ajps) Use of the SPAD-502 in Estimating Nitrogen Content in Leaves and Grape Yield in Grapevines in Soils with Different Texture Gustavo Brunetto1, Gustavo Trentin2, Carlos Alberto Ceretta3, Eduardo Girotto3, Felipe Lorensini3, Alcione Miotto3, Glaucia Regina Zaferi Moser3, George Wellington de Melo4 1Department of Rural Engineering, Program in Agricultural Ecosystems, Universidade Federal de Santa Catarina (UFSC), Flori- anopolis, Brazil; 2Embrapa Pecuária Sul, Bagé, Brazil; 3Program in Soil Science, Departamento de Solos (DS), Universidade Federal de Santa Maria (UFSM), Santa Maria, Brazil; 4Embrapa Uva e Vinho, Bento Gonçalves, Brazil. Email: brunettogustavo@gmail.com Received August 9th, 2012; revised September 14th, 2012; accepted October 8th, 2012 ABSTRACT The SPAD reading may be used in estimating total nitrogen content (N) in leaves and even in estimating grape yield in grapevines. The objective of this study was to estimate total N content in leaves and grape yield using the SPAD-502 in grapevines submitted to nitrogen fertilization in soils with clayey and sandy texture. In 2008, two experiments were installed in the Southern region of Brazil. In Experiment 1, Cabernet Sauvignon grapevines were planted in a soil with clayey texture and with application of 10, 20, 40 and 80 kg·N·ha−1·year−1. In experiment 2, Cabernet Sauvignon grape- vines were planted in a soil with sandy texture and with the application of 0, 10, 15, 20, 40, 80 and 120 kg·N·ha−1·year−1. In the grapevines of the two experiments and during the period from 2008 to 2010, SPAD readings were made on leaves throughout the flowering period and at change in color of the berries using the portable chlorophyll meter Mi- nolta-SPAD-502. The leaves were collected, dried, ground and submitted to analysis of the total N content. In addition, grape yield per hectare was evaluated. The SPAD-502 readings estimated the total N content in flowering and at change in color of the berries in the Cabernet Sauvignon grapevines grown on soils with clayey texture and sandy texture, es- pecially in the first year of evaluation. However, the precision of the SPAD-502 readings is low, with there being no relationship between the SPAD-502 readings and grape yield. Keywords: SPAD-Readings; Non Destructive Estimation; Foliar Nitrogen; Leaf Analysis; Vitis vinifera 1. Introduction Grapevines grown on soils with sandy texture and with low organic matter content are normally submitted to the application of nitrogen (N) due to supposed low capacity of the soil to supply this nutrient. On the other hand, when grapevines are grown on soils with a clayey texture, with medium to high organic matter content, and thus with hypothetically good capacity for supplying N, N is supplied when the natural sources do not meet the de- mand of the plant for the nutrient [1,2]. Nevertheless, the organic matter content of the soil provides partial infor- mation regarding the quantity of N that is potentially mineralizable in the soil in the medium to long term; however, it does not accurately predict the values of available N, such as nitrate (N-NO3−) and ammonium (N-NH4+), in short periods, as in a growth season or crop year. For that reason, tissue analysis, like leaf analysis, which may be collected in different periods, such as flowering or change in color of the berries, has been recommended as one of the methods that best represents the nutritional state of fruit-bearing plants, among them the grapevine [3-5]. Tissue analysis is a destructive method, which in- volves collection of the organ, such as leaves, washing, drying, preparation and laboratory analyses. These ana- lytical procedures are not very quick and the results gen- erated most of the time are interpreted and used for defi- nition of the need and the dose of the nutrient only in the following year. For that reason, in recent years in some fruit-bearing species like apple trees [6], peach trees [7], pear trees [8,9] and also the grapevine [10-12], the total N content in the leaves has been estimated through the use of non-destructive methods like those that use port- able equipment, among them the SPAD-502 (Soil Plant Analysis Division Value). The SPAD has a flexible shaft and another rigid shaft and the leaves are held in between these two shafts through the pressure of the flexible shaft Copyright © 2012 SciRes. AJPS  Use of the SPAD-502 in Estimating Nitrogen Content in Leaves and Grape Yield in Grapevines in Soils with Different Texture 1547 in the direction of the rigid shaft. The flexible shaft has two diodes that emit light beams at 650 nm (red) and 940 nm (near infrared), through the leaf tissue, and two de- tectors, located on the rigid shaft, measure light trans- mittance. The light transmitted, dependent on the tone of green in the leaf, is converted into electric signals and the ratio transmitted in the two regions of wavelengths cor- responds to a numeric value, called the SPAD reading and it is expressed in SPAD units [13]. The SPAD read- ing is related to the chlorophyll contents of the leaves determined in laboratory analyses, but also to the total N content [14,15] and even with yield. Nevertheless, cali- bration of the SPAD readings with the total N content in the leaf or with yield is necessary. For that reason, which organ of the plant, normally the leaf, which part of the organ, which position of the plant the organ will be lo- cated, which season, among other aspects, must be pre- defined for performance of the SPAD readings and, pref- erentially, they should be obtained in experiments with plants grown in soils with different textures, organic matter content and availability of mineral N, which may be created by the application of increasing doses of min- eral nitrogen fertilizer in the soil. For that reason, it is expected that the N content in the soil and, consequently, inside the plant is variable, which may be diagnosed by the total N content in the leaf. After that, the organ (leaf) where the reading was performed must be collected, dried, ground and prepared for analysis of total N content. Afterwards, the SPAD readings must be related to the total N content in the organ, thus obtaining an equation that will allow estimation of the total N content and even an estimation of yield. This value, interpreted in tables of the critical level or ranges of sufficiency, may define the need for application of N and/or its dose. The objective of the present study was to estimate, through use of the SPAD-502, the total N content in leaves and grape yield in grapevines submitted to nitro- gen fertilization in soils with clayey and sandy texture. 2. Material and Methods 2.1. Description of the Experiments 2.1.1. Experiment 1—Use of the SPAD-502 in Estimation of Total Nitrogen Content in Leaves and of Grape Yield in Grapevines Submitted to Nitrogen Fertilization and Grown in Soil with a Clayey Texture Experiment 1 was conducted in clayey soil in a vineyard in the experimental area of Embrapa Uva e Vinho in the municipality of Bento Gonçalves, Rio Grande do Sul (RS), region of the Serra Gaúcha (Gaucho Highlands), South of Brazil. The vineyard was of the cultivar Caber- net Sauvignon, grafted on the root stock SO4 at a density of 2666 plants per hectare, spacing of 1.5 m between plants and 2.5 m between rows. The vineyard was im- planted in 1986 and the plants were trained in a trellis system. The climate in the region has had temperatures from 12.8˚C to 21.8˚C throughout the years and precipi- tation of around 1736 mm, well distributed through the entire year. The soil was an Udorthent soil [16] and, in the layer from 0 - 20 cm, before implementing the ex- periment, it exhibited the following attributes: clay 240 g·kg−1, organic matter 27.0 g·kg−1, pH in water 6.3; ex- changeable Al 0.0 cmolc·dm−3 (KCl extraction solution 1 mol· L −1); exchangeable Ca 8.8 cmolc·dm−3 (KCl extrac- tion solution 1 mol·L−1); exchangeable Mg 3.3 cmolc·dm−3 (KCl extraction solution 1 mol·L−1); available P 18.9 mg·dm−3 (Mehlich 1 extraction solution) and available K 188 mg·dm−3 (Mehlich 1 extraction solution). The grapevines were submitted to the application of 0, 10, 20, 40 and 80 kg·N·ha−1 in August 2008 and also in 2009, totaling throughout the two years 0, 20, 40, 80 and 160 kg·N·ha−1. The doses of N were applied a single time at the beginning of flowering of the plants, in accordance with the official recommendation for fertilization and liming for grapevines established in Brazil for the states of Rio Grande do Sul and Santa Catarina [17]. The N was applied manually in the form of urea (45% N) in the soil surface, without incorporation, in strips of 0.5 m width under the plant canopy on the same side of the planting row. Throughout the grapevine cycle, the strip where the N was applied was submitted to application of Glyphosate to avoid the occurrence of weeds. In the two planting seasons, the grapevines were submitted to ap- plication of phosphorus (P) and potassium (K), following the official recommendations for the crop [17]. The ex- perimental design was randomized blocks with three rep- lications, with each plot formed of five plants, where the three center plants were assessed. 2.1.2. Experiment 2—Use of the SPAD-502 in Estimation of the Total Nitroge n Co nten t in Leaves and of Grape Yield in Grapevines Submitted to Nitrogen Fertilization and Grown in Soil with a Sandy Texture Experiment 2 was conducted in sandy soil in a vineyard of a property in the municipality of Rosário do Sul, Rio Grande do Sul, region of the Campanha Gaúcha (Gaucho Pampa), South of Brazil. The vineyard was of Cabernet Sauvignon, grafted on the root stock SO4 at a density of 3704 plants per hectare, spacing of 1.0 m between plants and 2.7 m between rows. The vineyard was implanted in 2004 and the plants were trained in an vertical trellis. The climate of the region is Cfa, with average temperatures ranging from 11.9˚C to 23.5˚C and with annual average rainfall of 1599 mm. The soil was a Sandy Typic Copyright © 2012 SciRes. AJPS  Use of the SPAD-502 in Estimating Nitrogen Content in Leaves and Grape Yield in Grapevines in Soils with Different Texture 1548 Hapludalf soil [16] and, in the layer from 0 - 20 cm, be- fore implementing the experiment, it exhibited the fol- lowing attributes: clay 70 g·kg−1, organic matter 10.0 g·kg−1, pH in water 5.5, exchangeable Al 0.0 cmolc·dm−3 (KCl extraction solution 1 mol·L−1), exchangeable Ca 0.9 cmolc·dm−3 (KCl extraction solution 1 mol·L−1), ex- changeable Mg 0.6 cmolc·dm−3 (KCl extraction solution 1 mol·L−1), available P 30.1 mg·dm−3 (Mechlich 1 ex- traction solution) and available K 48 mg·dm−3 (Mehlich 1 extraction solution). The Cabernet Sauvignon grapevines were submitted to the application of 0, 10, 15, 20, 40, 80 and 120 kg·N·ha−1, in August 2008 and also in 2009, totaling in the two crop seasons 0, 20, 30, 40, 80, 160 and 240 kg·N·ha−1. The source of N used was urea (45% N) and its mode of ap- plication, as well as weed control and fertilization with P and K, were the same as described in experiment 1. The experimental design was randomized blocks with three replications, with each plot formed of five plants, where assessments were performed on the three center plants. 2.2. SPAD Readings and Assessments of Total N Content in the Leaves and Grape Yield In October 2008 and 2009, during flowering of the grapevines, SPAD readings were performed, using the portable chlorophyll meter Minolta-SPAD-502. Readings were performed on mature leaves opposite the first bunch of the new shoot. Already in January 2009 and 2010, throughout the change in color of the berries, the SPAD readings were performed on mature leaves, located in the middle third of the new shoot. In the two periods, the readings were taken on three leaves, one on each new shoot. One leaf was located in the outer part of the plants, on the right side of the planting row, another leaf was located in the outer side of the plants, but at the left side of the planting row, and a third leaf was found in the center of the plant. Three readings were performed on each leaf in approximately the center part of the leaf. Soon after each reading, in the two periods of assessment, the same leaf submitted to SPAD reading was collected and reserved. After that, the leaf was dried in a forced air laboratory oven at a temperature of 65˚C, until constant weight. Soon afterwards, the leaves were ground in a Wiley type knife mill, having particles with an average diameter of approximately 0.1 mm at the end of the process, which were then prepared for analysis of total N, following the methodology proposed by [18], which may thus be described in summary fashion: 0.2 g of dry plant tissue was added to a 100 mL digestion tube, with the addition of 0.7 g of digestion mixture (90.9% Na2SO4 and 9.1% CuSO4·5H2O), 2 mL of H2SO4 concentrate and 1 mL of H2O2. After that, the tubes were placed and heated in a dry block at a temperature of 150˚C. Through- out digestion, the temperature was gradually raised (50˚C every 30 minutes), up to 350˚C. After the extracts of the samples exhibited a clear greenish yellow color, they remained in the dry block at a temperature of 350˚C for 60 minutes more. Soon afterwards, the digestion tubes were removed from the block. After that, 20 mL of dis- tilled water was added to each digestion tube. Then, 10 mL of NaOH 10 mol·L−1 was added to each digestion tube and it was immediately connected to the semi micro Kjedahl steam stripping apparatus for distillation of total N, until collecting 35 mL of distillate in 5 mL of the in- dicator solution, boric acid. This extract was then titrated with H2SO4 0.05 mol·L−1, which allowed quantification of the total N content in each sample. In March 2009 and 2010, all the grape bunches from each plant were collected and weighed and then grape yield per hectare was determined. 2.3. Statistical Analysis The results of the SPAD readings, of the total nitrogen content in the leaves, and grape yield obtained in the crop year of 2008/2009 and 2009/2010 were submitted to analysis of variance and when the effects were signify- cant, they were adjusted by the regression equations, testing the linear model by the F test, with an error prob- ability less than 5% (P < 0.05). To validate the equations generated, independent data were used, derived from the 2009/2010 crop year, which we considered as observed data. Also to assess perform- ance of the models, the correlation coefficient (r) [19], the Willmott dw index [20], the c index [19] and the root mean square error (RQME) [21] were used. Quantification of the association between two or more variables was established by r, which varies from −1 to 1 [22], being calculated by the equation: 0.5 22 111 nnn iii rOiOEiEOiO EiE where: Ei = estimated values; Oi = observed values; E = represents the mean of the estimated values; O = represents the mean of the observed values. The agreement index, designated dw, quantifies the accuracy of the model. Its values vary from zero, for no agreement, to 1, for perfect agreement [20]. The dw value is calculated by the formula [19]: 2 2 11 1 nn ii dwEi OiEi OOiO The c coefficient, proposed by [19] is obtained by the product between the r and dw, and the interpretation is the following: excellent (c > 0.85); very good (c from Copyright © 2012 SciRes. AJPS 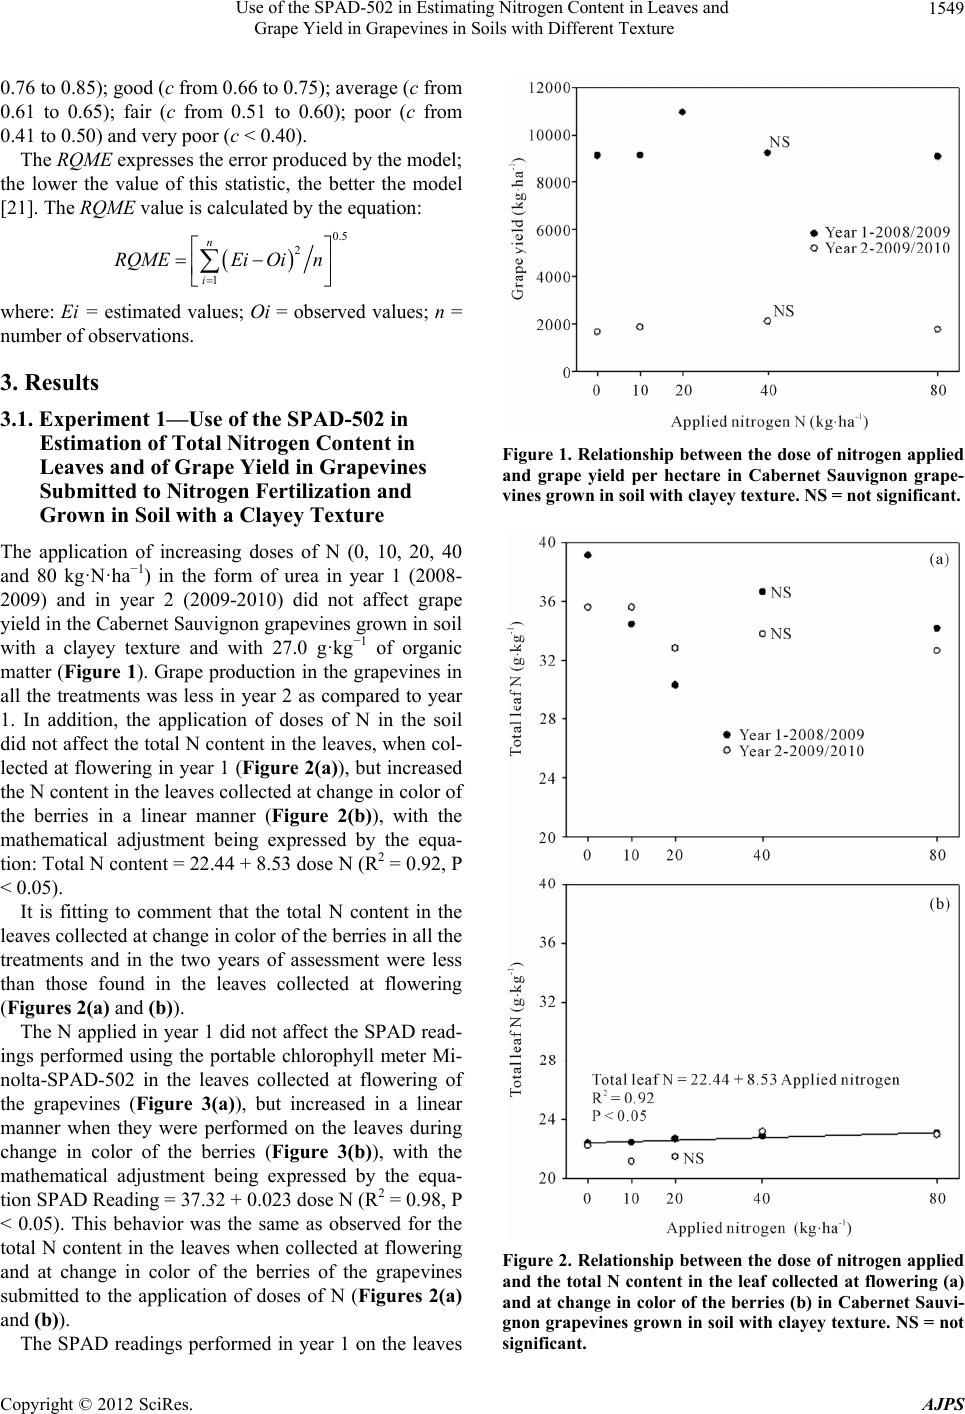 Use of the SPAD-502 in Estimating Nitrogen Content in Leaves and Grape Yield in Grapevines in Soils with Different Texture 1549 0.76 to 0.85); good (c from 0.66 to 0.75); average (c from 0.61 to 0.65); fair (c from 0.51 to 0.60); poor (c from 0.41 to 0.50) and very poor (c < 0.40). The RQME expresses the error produced by the model; the lower the value of this statistic, the better the model [21]. The RQME value is calculated by the equation: 0.5 2 1 n i RQMEEi Oin where: Ei = estimated values; Oi = observed values; n = number of observations. 3. Results 3.1. Experiment 1—Use of the SPAD-502 in Estimation of Total Nitrogen Content in Leaves and of Grape Yield in Grapevines Submitted to Nitrogen Fertilization and Grown in Soil with a Clayey Texture The application of increasing doses of N (0, 10, 20, 40 and 80 kg·N·ha−1) in the form of urea in year 1 (2008- 2009) and in year 2 (2009-2010) did not affect grape yield in the Cabernet Sauvignon grapevines grown in soil with a clayey texture and with 27.0 g·kg−1 of organic matter (Figure 1). Grape production in the grapevines in all the treatments was less in year 2 as compared to year 1. In addition, the application of doses of N in the soil did not affect the total N content in the leaves, when col- lected at flowering in year 1 (Figure 2(a)), but increased the N content in the leaves collected at change in color of the berries in a linear manner (Figure 2(b)), with the mathematical adjustment being expressed by the equa- tion: Total N content = 22.44 + 8.53 dose N (R2 = 0.92, P < 0.05). It is fitting to comment that the total N content in the leaves collected at change in color of the berries in all the treatments and in the two years of assessment were less than those found in the leaves collected at flowering (Figures 2 (a) and (b)). The N applied in year 1 did not affect the SPAD read- ings performed using the portable chlorophyll meter Mi- nolta-SPAD-502 in the leaves collected at flowering of the grapevines (Figure 3(a)), but increased in a linear manner when they were performed on the leaves during change in color of the berries (Figure 3(b)), with the mathematical adjustment being expressed by the equa- tion SPAD Reading = 37.32 + 0.023 dose N (R2 = 0.98, P < 0.05). This behavior was the same as observed for the total N content in the leaves when collected at flowering and at change in color of the berries of the grapevines submitted to the application of doses of N (Figures 2(a) and (b)). The SPAD readings performed in year 1 on the leaves Figure 1. Relationship betwee n the dose of nitrogen applied and grape yield per hectare in Cabernet Sauvignon grape- vines grown in soil with clayey texture. NS = not significant. Figure 2. Relationship betwee n the dose of nitrogen applied and the total N content in the leaf collected at flowering (a) and at change in color of the berries (b) in Cabernet Sauvi- gnon grapevines grown in soil with clay ey texture. NS = not significant. Copyright © 2012 SciRes. AJPS 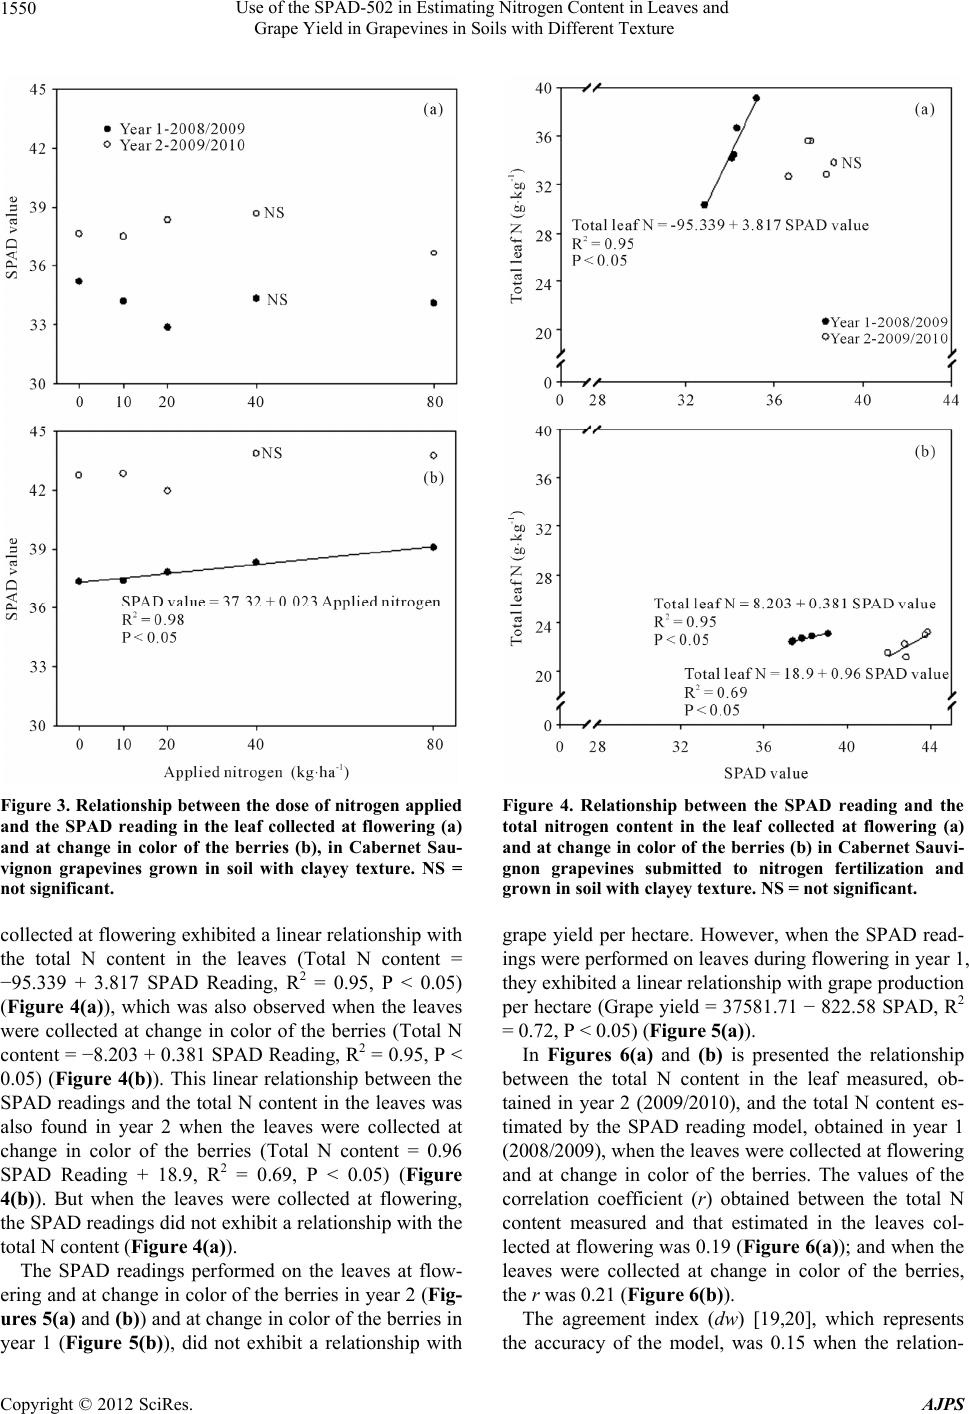 Use of the SPAD-502 in Estimating Nitrogen Content in Leaves and Grape Yield in Grapevines in Soils with Different Texture 1550 Figure 3. Relationship betwee n the dose of nitrogen applied and the SPAD reading in the leaf collected at flowering (a) and at change in color of the berries (b), in Cabernet Sau- vignon grapevines grown in soil with clayey texture. NS = not significant. collected at flowering exhibited a linear relationship with the total N content in the leaves (Total N content = −95.339 + 3.817 SPAD Reading, R2 = 0.95, P < 0.05) (Figure 4(a)), which was also observed when the leaves were collected at change in color of the berries (Total N content = −8.203 + 0.381 SPAD Reading, R2 = 0.95, P < 0.05) (Figure 4(b)). This linear relationship between the SPAD readings and the total N content in the leaves was also found in year 2 when the leaves were collected at change in color of the berries (Total N content = 0.96 SPAD Reading + 18.9, R2 = 0.69, P < 0.05) (Figure 4(b)). But when the leaves were collected at flowering, the SPAD readings did not exhibit a relationship with the total N content (Figure 4(a)). The SPAD readings performed on the leaves at flow- ering and at change in color of the berries in year 2 (Fig- ures 5(a) and (b)) and at change in color of the berries in year 1 (Figure 5(b)), did not exhibit a relationship with Figure 4. Relationship between the SPAD reading and the total nitrogen content in the leaf collected at flowering (a) and at change in color of the berries (b) in Cabernet Sauvi- gnon grapevines submitted to nitrogen fertilization and grown in soil with clayey texture. NS = not significant. grape yield per hectare. However, when the SPAD read- ings were performed on leaves during flowering in year 1, they exhibited a linear relationship with grape production per hectare (Grape yield = 37581.71 − 822.58 SPAD, R2 = 0.72, P < 0.05) (Figure 5(a )). In Figures 6(a) and (b) is presented the relationship between the total N content in the leaf measured, ob- tained in year 2 (2009/2010), and the total N content es- timated by the SPAD reading model, obtained in year 1 (2008/2009), when the leaves were collected at flowering and at change in color of the berries. The values of the correlation coefficient (r) obtained between the total N content measured and that estimated in the leaves col- lected at flowering was 0.19 (Figure 6(a)); and when the leaves were collected at change in color of the berries, the r was 0.21 (Figure 6(b)). The agreement index (dw) [19,20], which represents the accuracy of the model, was 0.15 when the relation- Copyright © 2012 SciRes. AJPS 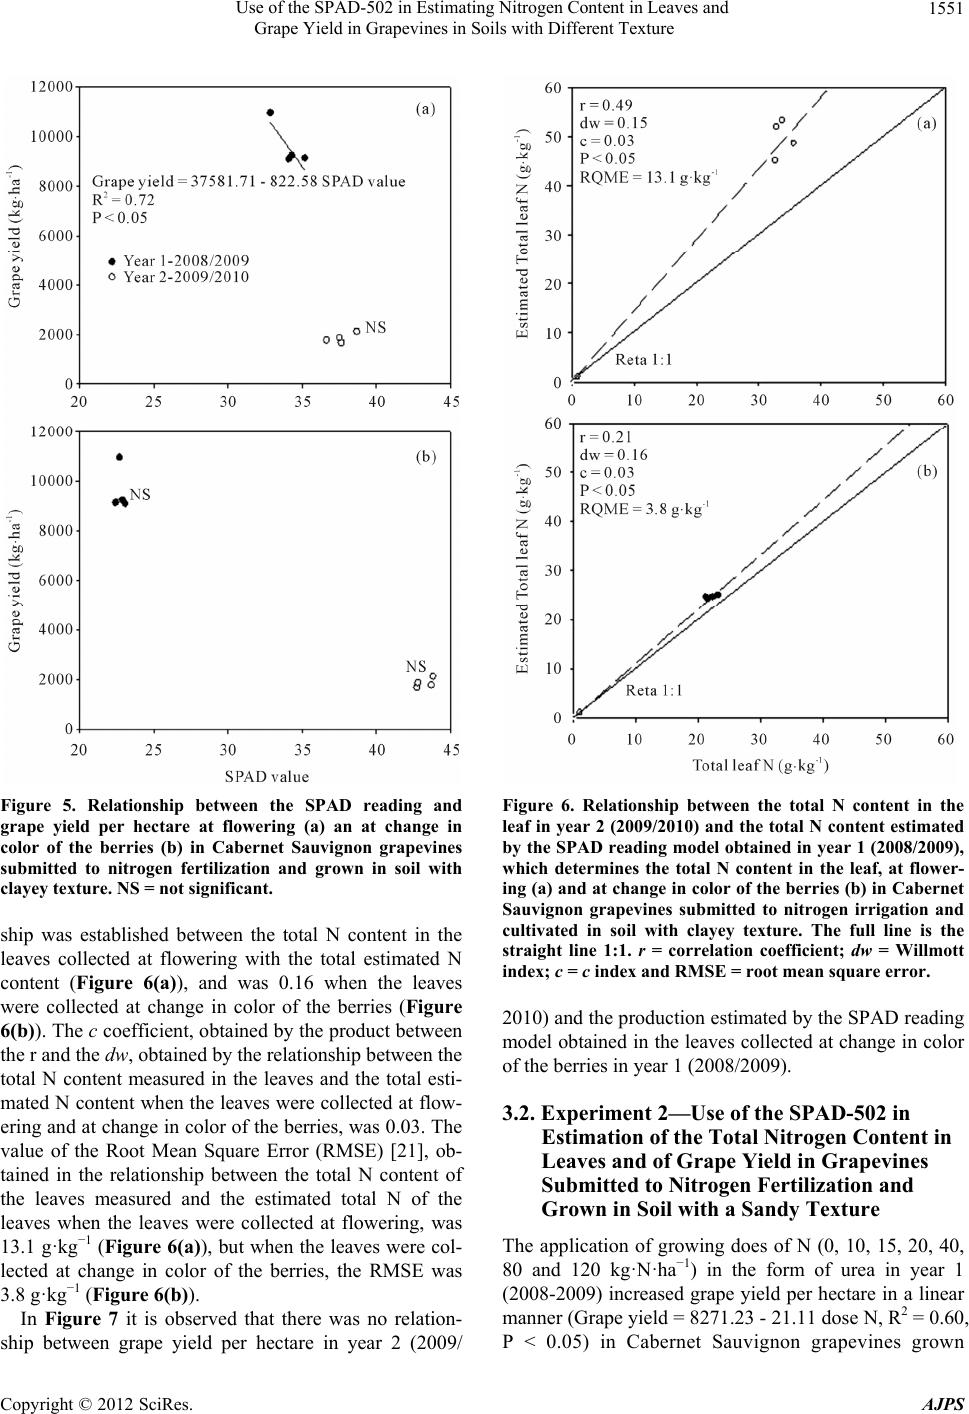 Use of the SPAD-502 in Estimating Nitrogen Content in Leaves and Grape Yield in Grapevines in Soils with Different Texture 1551 Figure 5. Relationship between the SPAD reading and grape yield per hectare at flowering (a) an at change in color of the berries (b) in Cabernet Sauvignon grapevines submitted to nitrogen fertilization and grown in soil with clayey texture. NS = not significant. ship was established between the total N content in the leaves collected at flowering with the total estimated N content (Figure 6(a)), and was 0.16 when the leaves were collected at change in color of the berries (Figure 6(b)). The c coefficient, obtained by the product between the r and the dw, obtained by the relationship between the total N content measured in the leaves and the total esti- mated N content when the leaves were collected at flow- ering and at change in color of the berries, was 0.03. The value of the Root Mean Square Error (RMSE) [21], ob- tained in the relationship between the total N content of the leaves measured and the estimated total N of the leaves when the leaves were collected at flowering, was 13.1 g·kg−1 (Figure 6(a)), but when the leaves were col- lected at change in color of the berries, the RMSE was 3.8 g·kg−1 (Figure 6(b)). In Figure 7 it is observed that there was no relation- ship between grape yield per hectare in year 2 (2009/ Figure 6. Relationship between the total N content in the leaf in year 2 (2009/2010) and the total N content estimated by the SPAD reading model obtained in year 1 (2008/2009), which determines the total N content in the leaf, at flower- ing (a) and at change in color of the berries (b) in Cabernet Sauvignon grapevines submitted to nitrogen irrigation and cultivated in soil with clayey texture. The full line is the straight line 1:1. r = correlation coefficient; dw = Willmott index; c = c index and RMSE = root mean square error. 2010) and the production estimated by the SPAD reading model obtained in the leaves collected at change in color of the berries in year 1 (2008/2009). 3.2. Experiment 2—Use of the SPAD-502 in Estimation of the Total Nitrogen Content in Leaves and of Grape Yield in Grapevines Submitted to Nitrogen Fertilization and Grown in Soil with a Sandy Texture The application of growing does of N (0, 10, 15, 20, 40, 80 and 120 kg·N·ha−1) in the form of urea in year 1 (2008-2009) increased grape yield per hectare in a linear manner (Grape yield = 8271.23 - 21.11 dose N, R2 = 0.60, P < 0.05) in Cabernet Sauvignon grapevines grown Copyright © 2012 SciRes. AJPS  Use of the SPAD-502 in Estimating Nitrogen Content in Leaves and Grape Yield in Grapevines in Soils with Different Texture 1552 Figure 7. Relationship between grape yield in year 2 (2009/ 2010) and grape yield estimated by the SPAD reading model obtained in the leaf at change in color of the berries in year 1 (2008/2009) in Cabernet Sauvignon grapevines submitted to nitrogen fertilization and cultivated in soil with a clayey texture. The full line is the straight line 1:1. r = correlation coefficient; dw = Willmott index; c = c index and RMSE = root mean square error. NS = not significant. in soil with sandy texture and with 10.0 g·kg−1 of organic matter (Figure 8). In the same way, in year 2, the appli- cation of increasing doses of N affected grape yield per hectare; however, the quantity of grapes produced di- minished with the increase of the dose applied (Grape yield = 4126.77 − 17.6 dose N, R2 = 0.66, P < 0.05) (Figure 8). Grape yield calculations per hectare in year 2 in all the treatments with the application of N were less than those found in year 1. The application of growing doses of N in the grapevines, for its part, increased the total N content in the leaves collected at flowering in year 1 (Total N content = 34.85 + 0.18 dose N, R2 = 0.96, P < 0.05) and in year 2 (Total N content = 25.54 + 0.09 dose N, R2 = 0.96, P < 0.05) (Figure 9(a)) in a linear manner. The increase of total N content in the leaves also occurred when they were collected at change in color of the berries in year 1 (Total N content = 22.44 + 8.53 dose N, R2 = 0.92, P < 0.05) and in year 2 (Total N content = 20.6 + 0.02 dose N, R2 = 0.63, P < 0.05) (Figure 9(b)). Nevertheless, in year 2, the leaves collected at flowering of the grapevines and at change in color of the berries exhibited lower N content when compared to leaves col- lected in year 1. The application of growing doses of N in the grape- vines increased the total N content in the leaves collected at flowering in year 1 (Total N content = 34.85 + 0.18 dose N, R2 = 0.96, P < 0.05) and in year 2 (Total N con- tent = 25.54 + 0.09 dose N, R2 = 0.96, P < 0.05) in a lin- ear manner (Figure 9(a)). The increase in the total N content in the leaves also occurred when they were col- lected at change in color of the berries in year 1 (Total N Figure 8. Relationship betwee n the dose of nitrogen applied and grape yield per hectare in Cabernet Sauvignon grape- vines cultivated in soil with a sandy texture. Figure 9. Relationship betwee n the dose of nitrogen applied and the total N content in the leaf collected at flowering (a) and at change in color of the berries (b) in Cabernet Sauvi- gnon grapevines grown in soil with a sandy texture. Copyright © 2012 SciRes. AJPS  Use of the SPAD-502 in Estimating Nitrogen Content in Leaves and Grape Yield in Grapevines in Soils with Different Texture 1553 content = 22.44 + 8.53 dose N, R2 = 0.92, P < 0.05) and in year 2 (Total N content = 20.6 + 0.02 dose N, R2 = 0.63, P < 0.05) (Figure 9(b)). Nevertheless, in year 2, the leaves collected at flowering of the grapevines and at change in color of the berries exhibited lower N content when compared with leaves collected in year 1. The application of N in the soil in year 1 increased the SPAD reading in a linear manner in the leaves of the grapevines collected at flowering (SPAD Reading = 35.1 + 0.04 dose N, R2 = 0.92, P < 0.05) (Figure 10(a)) and at change in color of the berries (SPAD Reading = 41.5 + 0.04 dose N, R2 = 0.66, P < 0.05) (Figure 10(b)). Nev- ertheless, N application did not affect the SPAD reading in year 2 performed on the leaves during flowering and at change in color of the berries (Figures 10(a) and (b)), which in this same year exhibited the lowest contents of total N (Figures 9(a) and (b)). SPAD readings in year 1 exhibited linear relationship Figure 10. Relationship between the dose of nitrogen ap- plied and the SPAD-502 readings in the leaf collected at flowering (a) and at change in color of the berries (b) in Cabernet Sauvignon grapevines grown in soil with sandy texture. NS = not significant. with the total N content in the leaves collected at flower- ing (Total N content = −134.30 + 4.83 SPAD, R2 = 0.94*) (Figure 11(a)), as well as when collected at change in color of the berries (Total N content = 11.408 + 0.453 SPAD, R2 = 0.99, P < 0.05) (Figure 11(b)). In year 2, there was no relationship between the SPAD readings and the total N content in the leaves collected at flower- ing and at change in color (Figures 11(a) and (b)). The SPAD readings, when performed on leaves during flowering of the grapevines, exhibited a linear relation- ship with grape yield per hectare (Grape production = −8786.08 + 488.66 SPAD reading, R2 = 0.59, P < 0.05) (Figure 12(a)), which was also found when the SPAD readings were performed on leaves at change in color of the berries (Grape yield = −21375.81 + 981.97 SPAD reading, R2 = 0.93, P < 0.05) (Figure 12(b)). However, the SPAD readings performed in year 2 on the leaves of the grapevines in flowering or during change in color of Figure 11. Relationship between the SPAD-502 reading and the total nitrogen content in the leaf collected at flowering (a) and at change in color of the berries (b) in Cabernet Sauvignon grapevines submitted to nitrogen fertilization and grown in soil with sandy texture. NS = not significant. Copyright © 2012 SciRes. AJPS  Use of the SPAD-502 in Estimating Nitrogen Content in Leaves and Grape Yield in Grapevines in Soils with Different Texture 1554 Figure 12. Relationship between the SPAD reading and grape yield per hectare when performed on leaves at flow- ering (a) and at change in color of the berries (b), in Cab- ernet Sauvignon grapevines submitted to nitrogen fertiliza- tion and cultivated in soil with sandy texture. NS = not sig- nificant. the berries did not exhibit a relationship with grape yield per hectare (Figures 12(a) and (b)). In Figures 13(a) and (b) is presented the relationship between the total N content in the measured leaf, ob- tained in year 2 (2009/2010) and the total N content es- timated by the SPAD reading model, obtained in year 1 (2008/2009), when the leaves were collected at flowering and at change in color of the berries. The r obtained in the relationship between the total N content measured and that estimated, when the leaves were collected at flowering, was 0.65 and when the leaves were collected at change in color of the berries, the r was 0.21. The dw was 0.62 when the relationship between the total N con- tent measured in the leaf collected at flowering and the total N content estimated in the leaf (Figure 13(a)) was established, but when the leaves were collected at change in color of the berries, the dw was 0.15 (Figure 13(b)). Figure 13. Relationship between the total N content in the leaf in year 2 (2009/2010) and the total N content estimated by the SPAD reading model obtained in year 1 (2008/2009), at flowering (a) and at change in color of the berries (b) in Cabernet Sauvignon grapevines submitted to nitrogen fer- tilization and grown in soil with sandy texture. The full line is the straight line 1:1. r = correlation coefficient; dw = Willmott index; c = c index and RMSE = root mean square error. The c coefficient obtained by the relationship between the total N content measured in the leaves and the total N estimated when the leaves were collected at flowering (Figure 13(a)) was 0.40, and when the leaves were col- lected at change in color of the berries (Figure 13(b)), the value was 0.03. The RMSE value obtained between the relationship between the total N content of the leaves measured and the total N of the leaves estimated when the leaves were collected at flowering was 6.3 g·kg−1 (Figure 13(a)), but when the leaves were collected at change in color of the berries, the RMSE was 14.6 g·kg−1 (Figure 13(b)). In Figure 14, it may be observed that there was no relation- ship between grape yield in year 2 (2009/2010) and the yield estimated by the SPAD reading model performed Copyright © 2012 SciRes. AJPS  Use of the SPAD-502 in Estimating Nitrogen Content in Leaves and Grape Yield in Grapevines in Soils with Different Texture 1555 Figure 14. Relationship between grape yield in year 2 (2009/ 2010) and grape yield estimated by the SPAD reading model obtained in year 1 (2008/2009) when the reading was performed on leaves collected at flowering (a) and at change in color of the berries (b) in Cabernet Sauvignon grapevines submitted to nitrogen fertilization and cultivated in soil with sandy texture. The full line is the straight line 1:1. r = correlation coefficient; dw = Willmott index; c = c index and RMSE = root mean square error. NS = not significant. on the leaf during flowering and at change in color in year 1 (2008/2009). 4. Results The Cabernet Sauvignon grapevines, grown in experi- ment 1 on a soil with clayey texture and with 27.0 g·kg−1 of organic matter, did not increase grape yield with the application of up to 80 kg·N·ha−1, in the first and second year of assessment (Figure 1). This may have occurred because the moisture conditions in the soil and the mild temperatures throughout all the months of the years may have favored the mineralization of the labile organic matter of the soil, as well as the decomposition of sense- cent plant residues deposited on the soil surface [23] which, in the case of Experiment 1, are especially the residues deposited between the rows of the grapevines. For that reason, an increase in the availability of N in the soil is expected, derived from the organic matter and the residues in decomposition, which, together with the inner reserves of N accumulated in the grapevines, especially in the perennial organs like the roots [24-28], may meet the plant demand for the nutrient, which may be one of the possible explanations for the lack of response to the application of N. According to [2], using the same type of soil and in the same region as Experiment 1, the Cab- ernet Sauvignon grapevines increase grape production up to a dose of around 15 kg·N·ha−1, which reinforces the possibility that the mineralization of the organic matter, of the cover plant residues, plus the inner reserves of N provide a large part of the N taken up by the plants. Nev- ertheless, when the Cabernet Sauvignon grapevines were grown in soils with a sandy texture, in other words, in Experiment 2, with 10.0 g·kg−1 of organic matter, the application of N increased grape production in the first year up to the dose of 120 kg·N·ha−1 (Figure 8). Never- theless, in the second year, grape yield diminished with the increase in the dose of N (Figure 2), which may be associated in part with the high availability of N in the soil and the water, since the rainfall in this year, espe- cially in the months of September, November and De- cember was frequent and in large quantity (Tables 1 and 2), which stimulates uptake of forms of N in the soil, de- tected by the increase of total N content in the leaves collected at flowering and at change in color of the ber- ries (Figures 9(a) and (b)). For that reason, stimulation of plant vigor is expected, which may have decreased the incidence of solar radiation in the inner part of the plant, favoring the occurrence of fungal diseases, especially in wetter years, as was the second year of assessment, which, consequently, may have decreased the number of fertile flowers, resulting in lower grape production per hectare [29,30]. The application of N on the Cabernet Sauvignon grapevines grown in soil with a clayey texture had little effect on the N content in the leaves during flowering and at change in color of the berries (Figures 2(a) and (b)), with an increase in the content of the nutrient being found only in the leaves collected in the first year during the change in color of the berries. That may be caused by the low utilization of the applied N by the grapevine, as reported by [27] in Riesling Renano and Chardonnay grapevines grown in the same type of clayey soil as ex- periment 1 and submitted to the application of N in the form of urea enriched with the tracer 15 N. That may also be one of the possible explanations for the lack of increase in grape production (Figure 1). But when the N was applied on grapevines grown in soil with a sandy texture, the total N content in the leaves during flowering Copyright © 2012 SciRes. AJPS  Use of the SPAD-502 in Estimating Nitrogen Content in Leaves and Grape Yield in Grapevines in Soils with Different Texture Copyright © 2012 SciRes. AJPS 1556 Table 1. Monthly average of minimum, mean, and maximum air temperature, and accumulated rainfall and sunshine dura- tion in the agricultural year, and climatological normal minimum, mean, and maximum air temperature, and accumulated rainfall and sunshine at Bento Gonçalves (RS), Brazil (Experiment 1). Agricultural Year 1 Agricultural Year 2 Climatological normal Temperature Min. Mean Max. Min. Mean Max. Min. Mean Max. Month -------------------------------------------------------------------------------˚C------------------------------------------------------------------------------- July 11.0 14.9 19.6 6.3 10.2 15.1 9.1 12.9 18.2 August 9.8 14.1 19.5 10.3 15.2 20.8 9.3 13.6 19.2 September 8.8 13.2 18.5 10.2 14.6 19.2 10.6 14.9 20.4 October 13.1 16.8 21.2 12.0 16.7 22.6 12.3 17.0 22.8 November 14.7 19.4 25.0 17.6 21.6 26.7 14.2 18.9 24.8 December 15.6 20.3 26.2 17.0 21.2 26.4 16.0 20.7 26.7 January 16.1 20.4 25.7 18.1 22.0 26.8 17.3 21.8 27.8 February 17.8 21.7 26.6 19.1 23.0 28.4 17.3 21.7 27.5 March 17.1 21.0 26.2 16.8 20.7 25.6 16.1 20.3 26.0 April 13.7 18.4 24.1 13.4 17.5 22.4 13.3 17.5 22.9 May 11.1 15.6 20.8 11.1 14.2 17.7 10.4 14.5 20.0 June 7.5 11.2 15.9 9.0 13.1 18.0 8.6 12.8 17.9 Average 13.0 17.3 22.4 13.4 17.5 22.5 12.9 17.2 22.9 Agricultural Year 1 Agricultural Year 2 Climatological normal Agricultural Year 1 Agricultural Year 2 Climatological normal Rainfall Sunshine Month -----------------------------------mm----------------------------------- ----------------------------------hour---------------------------------- July 73.0 97.8 161.0 175.7 144.9 154.0 August 198.5 257.9 165.0 193.5 183.0 159.0 September 144.1 411.7 185.0 185.8 134.4 162.0 October 309.6 145.1 156.0 154.8 194.1 192.0 November 70.3 359.5 140.0 240.8 141.1 219.0 December 85.8 232.6 144.0 261.7 224.3 239.0 January 269.6 296.4 140.0 235.7 189.2 231.0 February 144.5 167.1 139.0 174.0 205.3 199.0 March 90.6 57.2 128.0 228.1 192.5 208.0 April 24.2 142.1 114.0 243.4 180.1 173.0 May 134.7 154.7 107.0 162.3 98.4 162.0 June 82.9 129.9 157.0 155.4 142.4 142.0 Sum 1627.8 2452.0 1736.0 2411.2 2029.7 2240.0  Use of the SPAD-502 in Estimating Nitrogen Content in Leaves and Grape Yield in Grapevines in Soils with Different Texture 1557 Table 2. Monthly average of minimum, mean, and maximum air temperature, and accumulated rainfall and sunshine dura- tion in the agricultural year, and climatological normal minimum, mean, and maximum air temperature, and accumulated rainfall and sunshine at Rosario do Sul (RS), Brazil (Experiment 2). Agricultural Year 1 Agricultural Year 2 Climatological normal Temperature Min. Mean Max. Min. Mean Max. Min. Mean Max. Month -------------------------------------------------------------------------------˚C------------------------------------------------------------------------------- July 11.7 14.9 18.2 4.5 10.2 15.8 16.4 23.5 29.6 August 8.6 12.7 18.5 9.4 15.5 20.6 16.8 22.6 28.6 September 8.2 12.1 19.2 9.4 14.4 18.8 15.4 21.2 27.0 October 13.1 16.8 23.2 11.1 18.4 23.9 12.7 17.7 23.1 November 16.0 21.1 29.0 16.7 21.8 26.0 10.1 14.6 19.9 December 16.9 22.3 30.3 16.8 23.1 27.7 8.4 12.3 17.1 January 18.0 23.3 32.1 17.9 25.1 30.1 7.9 11.9 17.2 February 18.4 22.6 30.6 18.9 24.3 28.9 9.1 13.4 19.2 March 17.5 20.8 28.9 17.2 23.2 28.5 9.8 14.6 20.2 April 13.4 17.5 27.0 12.6 18.7 23.9 12.6 17.5 23.1 May 10.3 16.6 22.1 11.2 15.3 19.2 14.3 19.7 25.5 June 5.1 10.8 16.0 8.6 13.0 17.2 16.6 22.2 28.3 Average 13.1 17.6 24.6 12.8 18.6 23.4 12.5 17.6 23.2 Agricultural Year 1 Agricultural Year 2 Climatological normal Agricultural Year 1 Agricultural Year 2 Climatological normal Rainfall Sunshine Month -----------------------------------mm----------------------------------- -----------------------------------hour----------------------------------- July 129.9 66.1 120.4 139.8 177.1 155.0 August 145.2 45.3 76.2 200.3 190.5 166.0 September 91.5 269.4 147.3 174.2 167.3 179.0 October 188.1 135.9 155.8 196.8 274.8 222.0 November 29.0 540.8 118.0 278.4 121.9 247.0 December 61.4 219.0 127.8 295.1 236.8 274.0 January 68.6 204.1 138.8 274.5 267.4 264.0 February 256.0 240.7 137.2 219.9 197.5 219.0 March 70.2 58.9 135.9 251.7 247.7 227.0 April 11.8 132.0 183.6 233.2 219.3 192.0 May 123.6 133.4 125.8 167.1 121.8 174.0 June 22.4 33.7 132.1 174.4 130.1 134.0 Sum 1197.7 2079.3 1598.9 2605.4 2352.2 2453.0 Copyright © 2012 SciRes. AJPS  Use of the SPAD-502 in Estimating Nitrogen Content in Leaves and Grape Yield in Grapevines in Soils with Different Texture Copyright © 2012 SciRes. AJPS 1558 and change in color of the berries increased (Figure 9(a) and (b)), showing that part of the N applied was taken up by the plants, moreover, increasing grape production in the first year (Figure 8). The addition of doses of N in grapevines grown in soils with clayey texture did not affect the SPAD read- ings performed on the leaves during flowering in the first year and in the second year (Figures 3(a) and (b)) and that performed on the leaves throughout the change in color of the berries in the second year (Figure 3(b)). This may have occurred because the application of N did not increase the total N content in the leaves (Figures 2(a) and (b)) which, consequently, may not have increased the chlorophyll content in the leaves, since the total N content in the leaves normally and for most crops is highly related to the chlorophyll content [31-34], and the chlorophyll content to the SPAD reading [35,36]. This may be a plausible explanation because in the grapevines grown in soils with a sandy texture, the total N content in the leaves collected at flowering and at change in color increased with the dose of N applied (Figures 9(a) and (b)), which, moreover, promoted the increase of the SPAD readings, in this case of the leaves collected at flowering and at change in color of the berries in the first year of assessment (Figures 10(a) and (b)). When the total N content in the leaves was less, for example, in the leaves collected at flowering and at change in color of the berries in the second year (Figures 9(a) and (b)), no relationship was found between the dose applied and the SPAD reading (Figures 10(a) and (b)). Nevertheless, it is fitting to report that the SPAD 502 has adequate sensi- tivity to detect the increase of the chlorophyll content in leaves that have up to 300 mg·m−2 of chloroplasts [37] The SPAD readings performed on the grapevines submitted to application of N and grown in soil with clayey and sandy texture exhibited a positive linear rela- tionship with the total N content in the leaves collected at flowering and at change in color of the berries in year 1. On the other hand, in year 2, this relationship was only found when the leaves were collected at change in color in the grapevines with application of N and grown in soil with clayey texture (Figures 4(a) and (b), 11(a) and (b)). The relationship between the two variables allows the SPAD reading to estimate the total N content in the leaves which, consequently, may be used to define the need for and the dose of the nutrient to be added. Thus, the collection of leaves, drying and chemical analysis in the laboratory may be unnecessary for the determination of total N content, which is a slower procedure with a higher cost. It is desirable for the SPAD reading to have the capac- ity of estimating the total N in the leaves in earlier phenological stages, such as flowering, because this would allow the nitrogen fertilization, when necessary, to be applied in the same vegetation and productive cycle of the plant. The relationship between the SPAD reading and total N content in the grapevine leaves was also re- ported by Porro et al. [38] in Chardonnay grapevines grown in Italy. This author reports that the best determi- nation coefficients (R2) between the two variables were found when the leaves were collected in the fruit-set, similar to that which was obtained by Porro et al. (1995). Nevertheless, these authors report that the relationship between the SPAD reading and the total N content is not found every year, which was also obtained in the present study because, for example, in year 2, in the grapevines grown in the soil with sandy texture, no relationship was found between the SPAD reading and the total N content in leaves during flowering and at change in color of the berries (Figures 11(a) and (b)). That may be explained, in part, by the lower total N contents in leaves in all the treatments (Figures 9(a) and (b)), probably caused by the greater leaching of N-NO3− in the soil profile, which may happen in soils planted to fruit bearing plants, like grapevines, in traditional producer regions in the world [39,40], especially because the rainfall in that year was high (Tables 1 and 2) and the soil has a sandy texture. Thus, it is observed that the SPAD reading may indeed have the potential for estimating the total N content in leaves during flowering and at change in color of the berries, both in Cabernet Sauvignon grapevines grown in soils with clayey texture, as well as sandy texture; nev- ertheless, this is highly dependent on the year of assess- ment, as has already been reported by [12,39]. The SPAD readings did not exhibit a relationship with grape yield per hectare when they were performed on the leaves during the change in color of the berries in the two years, as well as in flowering in year 2 in the grapevines submitted to application of N and grown in soil with clayey texture (Figures 5(a) and (b)). Nevertheless, the SPAD readings exhibited a positive relationship with grape yield when they were performed on the leaves of grapevines grown in soil with sandy texture during flow- ering and at change in color of the berries in year 1 (Figures 12(a) and (b)). These data obtained throughout one year of assessment show that it is possible to esti- mate production using the SPAD reading performed at flowering or at change in color of the berries. Neverthe- less, in year 2, there was no relationship between the SPAD readings and production (Figures 12(a) and (b)), showing the variability of results from one year to the next. When the relationship was established between the to- tal N content measured in the leaves, which was obtained in year 2 and the total N content estimated by the SPAD reading model, generated in year 1, it was observed that  Use of the SPAD-502 in Estimating Nitrogen Content in Leaves and Grape Yield in Grapevines in Soils with Different Texture 1559 the leaves collected at flowering and at change in color of the berries in grapevines submitted to application of N and grown in soils with clayey texture exhibited similar correlation coefficient values, although low (Figures 6(a) and (b)). However, when the same model was estab- lished, but with the leaves of the grapevines submitted to application of N in soils with sandy texture, it was ob- served that the greatest correlation coefficient was found when the leaves were collected at flowering, if compared to those collected at change in color of the berries (Fig- ures 13(a) and (b)). The agreement indexes (dw) [19,20], obtained in the relationship between the total N content measured and that estimated in the leaves collected at flowering and at change in color of the berries in the grapevines grown in soils with clayey texture, were near to zero (Figures 6(a) and (b)), indicating little agreement between the two variables. On the other hand, when the relationship between the total N content measured and that estimated was obtained in the leaves collected at flowering of the grapevines grown in soils with sandy texture, the dw was greater and nearer to one (1) which, consequently, shows greater agreement if compared to the value of dw found when the leaves were collected at change in color of the berries (Figures 13(a) and (b)). The c coefficient values, obtained by the product be- tween r and the dw, in the relationship between the total N content measured in the leaves and the total N content estimated, in the leaves collected at flowering and at change in color of the berries, both in the grapevines submitted to the application of N and those grown in soil with a clayey and sandy texture, indicated a very poor performance (c < 0.40) (Figures 6(a), (b), 13(a) and (b)). On the other hand, the value of the RMSE [21], obtained in the relationship between the total N content of the leaves measured and the total N of the leaves estimated by the SPAD reading model when the leaves were col- lected at change in color of the berries was less and, consequently, it is a better model (Figures 6(a) and (b)), in comparison with the value of RMSE obtained when the leaves were collected at flowering (Figures 13(a) and (b)). Nevertheless, in the grapevines grown in soils with sandy texture, the values of RMSE obtained were con- trary to those found in the grapevines grown in clayey soil, with the lowest values of RMSE being verified when the leaves were collected at flowering. The statis- tical values, like dw, but especially the c index, shows that the models generated by the SPAD readings to esti- mate the total N content in the leaves collected at flow- ering and at change in color of the berries, both in the grapevines grown in soil with clayey texture as well as sandy texture, in a general sense, exhibit low accuracy in determination of the total N content in the leaves. When the relationship between the production measured and the production estimated was established using the SPAD reading model, performed on the leaves of the grapevines grown in clayey soils during the change in color of the berries or in the leaves of the grapevines grown in soil with sandy texture during the flowering and change in color of the berries, the SPAD readings also did not ex- hibit accuracy in estimating grape production (Figures 7, 14(a) and (b)). 5. Conclusion The SPAD-502 readings estimated the total N content in the leaves at flowering and at change in color of the ber- ries in the Cabernet Sauvignon grapevines grown in soils with clayey and sandy texture, especially in the first year of assessment. However, the accuracy of the SPAD readings in estimation of the total N content is low and, in estimation of grape yield, it is non-existent. 6. Acknowledgements To the CAPES Foundation (Brazilian Federal Agency for Support and Evaluation of Graduate Education) for fi- nancing the project “Prediction of fertilization in grape- vines with the aim of quality grapes and wines in the southern region of Brazil” (National Post Doctorate Pro- gram-PNPD 2007, public notice 034/2007) and for the Post Doctorate fellowship which was granted to the first, second and fifth authors. To Fapergs (Research Support Foundation of Rio Grande do Sul) for the financial assis- tance (Process no. 0903999). To Embrapa Uva e Vinho and the Citrosul company for making vineyards available for performance of the experiments. REFERENCES [1] G. Brunetto, C. A. Ceretta, J. Kaminski, G. W. B. Melo, C. R. Lourenzi, V. Furlanetto and A. Moraes, “Aplicação de Nitrogênio em Videiras na Campanha Gaúcha: Pro- dutividade e Carac-Terísticas Químicas do Mosto da Uva,” Ciencia Rural, Vol. 37, No. 2, 2007, pp. 389-393. doi:10.1590/S0103-84782007000200014 [2] G. Brunetto, C. A. Ceretta, J. Kaminski, G. W. B. Melo, E. Girotto, E. E. Trentin, C. R. Lourenzi, R. C. B. Vieira and L. C. Gatiboni, “Produção e Composição Química da uva de Videiras Cabernet Sauvignon Submetidas à Adubação Nitrogenada,” Ciência Rural, Vol. 39, No. 7, 2009, pp. 2035-2041. doi:10.1590/S0103-84782009005000162 [3] E. Fallahi, “Preharvest Nitrogen Optimization for Maxi- mizing Yield and Postharvest Fruit Quality of Apples,” Acta Horticulturae, No. 448, 1997, pp. 415-417. [4] A. K. Alva, S. Paramasivam and W. D. Graham, “Impact of Nitrogen Management Practices on Nutritional Status and Yield of Valencia Orange Trees and Groundwater Nitrate,” Journal of Environmental Quality, Vol. 27, No. Copyright © 2012 SciRes. AJPS  Use of the SPAD-502 in Estimating Nitrogen Content in Leaves and Grape Yield in Grapevines in Soils with Different Texture 1560 4, 1998, pp. 904-910. doi:10.2134/jeq1998.00472425002700040026x [5] O. A. Rubio-Covarrubias, P. H. Brown, S. A. Weinbaum, R. S Johnson and R. I. Cabrera, “Evaluating Foliar Ni- trogen Compounds as Indicators of Nitrogen Status in Prunus persica Trees,” International Society for Horti- cultural Science, Vol. 120, No. 1, 2009, pp. 27-33. [6] D. Neilsen, E. J. Hogue, G. H. Neilsen and P. Parcho- mchuk, “Using SPAD-502 Values to Assess the Nitrogen Status of Apple Trees,” American Society for Horticul- tural Science, Vol. 30, No. 3, 1995, pp. 508-512. [7] T. Thomidis and C. Tsipouridis, “Influence of Rootstocks, pH, Iron Supply (in Nutrient Solutions) and Agrobacte- rium radiobacter on Chlorophyll and Iron Concentration in Leaves of a Peach Variety,” Journal of Plant Nutrition and Soil Science, Vol. 28, 2005, pp.1833-1842. [8] F. J. Peryea and R. Kammereck, “Use of Minolta SPAD- 502 Chlorophyll Meter to Quantify the Effectiveness of Mid-Summer Trunk Injection of Iron on Chlorotic Pear Trees,” Journal of Plant Nutrition and Soil Science, Vol. 20, 1997, pp. 1457-1463. [9] C. S. Chang and L. R Chang, “Two Rapid Determination Methods for Total Chlorophyll Content in Fruit Tree Leaves,” Taichung District Agricultural Improvement Station, Vol. 59, 1998, pp. 37-45. [10] D. Rupp and L. Trankle, “A Non-Destructive Measure- ment Method for Chlorophyll in Grapevines,” Mitteilun- gen Klosterneuburg, Rebe und Wein, Obstbau und Fru- echteverwertung, Vol. 45, No. 5-6, 1995, pp. 139-142. [11] D. Porro, C. Dorigatti, M. Stefanini and A. Ceschini, “Use of SPAD Meter in Diagnosis of Nutritional Status in Apple and Grapevine,” International Society for Horti- cultural Science, Vol. 564, 2001, pp. 243-252. [12] D. Porro, M. Bertamini, C. Dorigatti, M. Stefanini and A. Ceschini, “Lo SPAD nella Diagnosi dello Stato Nutri- zionale della Vite,” L’Informatore Agrario, Vol. 57, 2001, pp. 49-55. [13] J. M. Swiader and A. Moore, “SPAD-Chlorophyll Re- sponse to Nitrogen Fertilization and Evaluation of Nitro- gen Status in Dryland and Irrigated Pumpkins,” Journal of Plant Nutrition and Soil Science, Vol. 25, 2002, pp. 1089-1100. [14] S. C. Chapman and H. J. Barreto, “Using Chlorophyll Meter to Estimate Specific Leaf Nitrogen of Tropical Maize during Vegetative Growth,” Agronomy Journal, Vol. 89, No. 4, 1997, pp. 557-562. doi:10.2134/agronj1997.00021962008900040004x [15] P. L. Minotti, D. E. Halseth and J. B. Sieckza, “Field Chlorophyll Measurements to Assess the Nitrogen Status of Potato Varieties,” American Society for horticultural Science, Vol. 29, No. 12, 1994, pp. 1497-1500. [16] Soil Survey Staff, “Soil Taxonomy: A Basic System of Soil Classification for Making and Interpreting Soil Sur- veys,” 2nd Edition, US Government Printing Office, Washington, 1999. [17] CQFS-RS/SC, “Manual de Adubação e Calagem para os Estados do Rio Grande do Sul e de Santa Catarina,” 10th Edition, SBCS-NRS, Porto Alegre, 2004. [18] M. J. Tedesco, C. Gianello, C. A. Bissani, H. Bohnen and S. J. Volkweiss, “Análise do Solo, Planta e Outros Materiais,” 2nd Edition, Universidade Federal do Rio Grande do Sul, Porto Alegre, 1995. [19] P. Camargo and P. C. Sentelhas, “Avaliação do Dese- mpenho de Diferentes Métodos de Estimativa da Eva- potranspiração Potencial no Estado de São Paulo, Brasil,” Revista Brasileira de Meteorologia, Vol. 5, 1997, pp. 89-97. [20] C. J. Willmott, “On the Validation Models,” Physical Geographe, Vol. 2, 1981, pp. 184-194. [21] N. A. Streck, “A Generalized Nonlinear Air Temperature Response Function for Node Appearance Rate in Musk- melon (Cucumis melo L.),” Revista Brasileira de Meteo- rologia, Vol. 10, No. 2, 2002, pp. 105-111. [22] P. R. Schneider, “Análise de Regressão Aplicada à Engenharia Florestal,” 2nd Edition, UFSM, Santa Maria, 1998. [23] S. Agehara and D. D. Warncke, “Soil Moisture and Tem- perature Effects on Nitrogen Release from Organic Ni- trogen Sources,” Soil Science Society of America Journal, Vol. 69, No. 6, 2005, pp. 1844-1855. doi:10.2136/sssaj2004.0361 [24] T. R. Bates, R. M. Dunst and P. Joy, “Seasonal Dry Mat- ter, Starch, and Nutrient Distribution in Concord Grape- vine Roots,” American Society for Horticultural Science, Vol. 37, No. 2, 2002, pp. 313-316. [25] C. Zapata, E. Deléens, S. Chaillou and C. Magné, “Parti- tioning and Mobilization of Starch and N Reserves in Grapevine (Vitis vinifera L.),” Journal of Plant Physiol- ogy, Vol. 161, 2004, pp. 1031-1040. doi:10.1016/j.jplph.2003.11.009 [26] G. Brunetto, J. Kaminski, G. W. B. Melo, L. C. Gatiboni and S. Urquiaga, “Absorção e Redistribuição do Nitro- gênio Aplicado via Foliar em Videiras Jovens,” Revista Brasileira de Fruticultura, Vol. 27, No. 1, 2005, pp. 110- 114. doi:10.1590/S0100-29452005000100030 [27] G. Brunetto, J. Kaminski, G. M. B. Melo and D. S. Rheinheimer, “Recuperação e Distribuição do Nitrogênio Fornecido a Videiras Jovens,” Pesquisa Agropecuária Brasileira, Vol. 41, No. 8, 2006, pp. 1299-1304. doi:10.1590/S0100-204X2006000800013 [28] G. Brunetto, M. Ventura, F. Scandellari, C. A. Ceretta, J. Kaminski, G. W. B. Melo and M. Tagliavini, “Nutrients Release during the Decomposition of Mowed Perennial Ryegrass and White Clover and Its Contribution to Ni- trogen Nutrition of Grapevine,” Nutrient Cycling in Agro- ecosystems, Vol. 90, 2011, pp. 299-308. doi:10.1007/s10705-011-9430-8 [29] M. Keller, R. M. Pool and T. Henick-Kling, “Excessive Nitrogen Supply and Shoot Trimming Can Impair Colour Development in Pinot Noir Grapes and Wine,” Australian Journal of Grape and Wine Research, Vol. 5, No. 2, 1999, pp. 45-55. doi:10.1111/j.1755-0238.1999.tb00151.x [30] E. Duchêne, C. Schneider and J. P. Gaudillère, “Effects of Nitrogen Nutrition Timing on Fruit Set of Grapevine cv. Copyright © 2012 SciRes. AJPS  Use of the SPAD-502 in Estimating Nitrogen Content in Leaves and Grape Yield in Grapevines in Soils with Different Texture Copyright © 2012 SciRes. AJPS 1561 Grenache,” Vitis, Landau, Vol. 40, 2001, pp. 45-46. [31] D. W. Reeves, P. L. Mask, C. W. Wood and D. P. De- laney, “Determination of Wheat Nitrogen Status with a Hand-Held Chlorophyll Meter: Influence of Management Practices,” Journal of Plant Nutrition and Soil Science, Vol. 16, No. 5, 1993, pp. 781-796. [32] W. Feibo, W. Lianghuan and X. Fuha, “Chlorophyll Me- ter to Predict Nitrogen Sidedress Requirements for Short- Season Cotton,” Field Crops Research, Vol. 56, No. 3, 1998, pp. 309-314. doi:10.1016/S0378-4290(97)00108-1 [33] T. Matsunaka, Y. Watanabe, T. Miyawaki and N. Ichi- kawa, “Prediction of Grain Protein Content in Winter Wheat through Leaf Color Measurements Using a Chlo- rophyll Meter,” Soil Science & Plant Nutrition, Vol. 43, 1997, pp. 127-134. doi:10.1080/00380768.1997.10414721 [34] G. Lemaire, M. Jeuffroy and F. Gastal, “Diagnosis Tool for Plant and Crop N Status in Vegetative Stage Theory and Practices for Crop N Management,” European Jour- nal of Agronomy, Vol. 28, No. 4, 2008, pp. 614-624. doi:10.1016/j.eja.2008.01.005 [35] R. D Marquard and J. L. Tipton, “Relationship between Extractablechlorophyllandan in Situ Method to Estimate Leaf Greenness,” American Society for Horticultural Sci- ence, Vol. 22, 1987, pp. 13-27. [36] T. S. Hawkins, E. S. Gardiner and G. S. Comer, “Model- ing the Relationship between Extractable Chlorophyll and SPAD-502 Readings for Endangered Plant Species Re- search,” Journal for Nature Conservation, Vol. 17, No. 2, 2009, pp. 123-127. doi:10.1016/j.jnc.2008.12.007 [37] M. R. Steele, A. A. Gitelson and D. C. Rundquist, “A Comparison of Two Techniques for Non-Destructive Measurement of Chlorophyll Content in Grapevine Lea- ves,” Agronomy Journal, Vol. 100, No. 3, 2008, pp. 779- 782. doi:10.2134/agronj2007.0254N [38] D. Porro, M. Stefanini, O. Failla and G. Stringari, “Opti- mal Leaf Sampling Time in Diagnosis of Grapevine Nu- tritional Status,” International Society for Horticultural Science, Vol. 383, 1995, pp. 135-142. [39] G. H. Neilsen and D. Neilsen, “Orchard Nutrition to Max- imize Crop Quality and Minimize Environmental Degra- dation,” International Society for Horticultural Science, Vol. 448, 1997, pp. 365-373. [40] K. Barlow, W. Bond, B. Holzapfel, J. Smith and R. Hutton, “Nitrogen Concentrations in Soil Solution and Surface Run-Off on Irrigated Vineyards in Australia,” Australian Journal of Grape and Wine Research, Vol. 15, No. 2, 2009, pp. 131-143. doi:10.1111/j.1755-0238.2008.00042.x
|