Psychology
2012. Vol.3, No.11, 953-958
Published Online November 2012 in SciRes (http://www.SciRP.org/journal/psych) http://dx.doi.org/10.4236/psych.2012.311143
Copyright © 2012 SciRes. 953
The Effects of Perceptual Grouping and Category Boundary
Salience on Location Memory
Emily K. Farran1*, Sarah C. Connell2, Bhupinderjit K. Pharwaha2
1Department of Psychology and Human Development, Institute of Education, University of London, London, UK
2School of Psychology and Clinical Language Science, University of Reading, Reading, UK
Email: *E.Farran@ioe.ac.uk
Received August 15th, 2012; r evised September 14th, 2012; accepted October 12th, 2012
The type of information used to process spatial layouts was assessed by observing the effect of spatial
category salience and perceptual grouping (a non-spatial category), on a location memory task. Partici-
pants (N = 64) learnt the pairings between twenty objects and twenty marked locations within a “house”.
They then placed the objects in the remembered locations, without the aid of location markers. Spatial
category salience was manipulated by presenting the house as an open space (no boundary condition) or
by dividing the space into quadrants (boundary condition). Perceptual grouping was manipulated by using
identical shapes (control condition) or sets of shapes which identified triads of objects (perceptual group-
ing condition). Both non-spatial and spatial categories improved location memory accuracy. The non-
spatial category produced a prototype effect and the spatial category produced a subdivision effect. Dif-
ferent patterns of category dominance (spatial vs. non-spatial) were observed for level of accuracy com-
pared to distortion effects.
Keywords: Spatial Category; Perceptual Grouping; Memory; Prototype Effect; Subdivision Effect
Introduction
The concept of a “location” is innately relative; it is de-
scribed in reference to elements such as other objects (Hund &
Plumert, 2003), landmarks (Sadalla, Burroughs, & Staplin,
1980) and regions (Plumert & Hund, 2001). The Category Ad-
justment (CA) model (Huttenlocher, Hedges, & Duncan, 1991)
was put forward to explain how individuals encode spatial loca-
tion information and retrieve this information from memory.
According to this model, spatial location coding involves two
steps. Individuals first estimate location using fine-grained
information, i.e. the distance and direction of an object’s loca-
tion from a referent. Second, estimates are adjusted using cate-
gorical information about region membership. Each category is
represented by a prototype at the centre of the region; adjust-
ments are made towards the prototype.
The weightings of fine-grained and categorical information
are dependent on the degree of uncertainty over fine-grained
information. Inexactly represented stimuli are adjusted in ac-
cordance with category membership. This enhances the accu-
racy of a location estimate, but also introduces distortions. For
example, individuals overestimate or underestimate distances
between objects that are in different regions or the same regions
respectively; the subdivision effect (Huttenlocher et a l . , 1991) .
Plumert and Hund (2001) investigated the subdivision effect
in 7-, 9- and 11-year-olds and adults. Participants learnt 20
locations within a 32 inch2 box. Hedges, Corrigan and Craw-
ford (2004) report that space is naturally portioned into regions
divided about the cardinal axes. Plumert and Hund (2001) ex-
ploited this by increasing the salience of the quadrants of the
square box across three conditions: the box either had no
boundaries present, or was divided into quadrants by lines or by
walls. This increased spatial category salience, but also pro-
vided more spatial referents (i.e. lines/walls), another factor
which is known to improve accuracy and prototype formation
(Fitting, Wedell, & Allen, 2005). Results showed that, for all
groups, boundary salience improved accuracy. All groups over-
estimated between quadrant distances. Significantly longer esti-
mates were observed for between than within quadrant dis-
tances for the 11-year-olds and adults only, indicative of a sub-
division effec t in these groups.
There is much support for the use of spatial categories as a
method of adjusting location estimates, but little research relat-
ing to non-spatial categories. Huttenlocher, Hedges and Vevea
(2000) presented participants with stimuli which varied along a
spatial (fish fatness) or non-spatial dimension (square grey-
ness). On removal of each stimulus exemplar, participants were
asked to reproduce it. Biases in estimations were dictated by the
distribution of the exemplars. The pattern of results was similar
across spatial and nonspatial categories, which suggests that the
CA model is not restricted to spatial categories.
Hund and Plumert (2003) used a similar experimental space
to Plumert and Hund (2001), but the objects employed could be
categorised using non-spatial information (e.g. vehicles, ani-
mals). In a “related” condition, items were placed such that
objects belonging to the same non-spatial category were in the
same spatial category (same quadrant). In the “unrelated” con-
dition, object-location pairings were random. In the related con-
dition only, children and adults underestimated the distances
between objects that belonged to the same non-spatial category,
i.e. a prototype effect. This suggests that non-spatial informa-
tion can bias estimates of spatial locations. However, as spatial
and non-spatial categories were congruent one cannot deter-
mine whether the bias observed was due to an amplifying effect
of the non-spatial categories on spatial category representation,
*Corresponding author.
E. K. FARRAN ET AL.
or whether it was independent of spatial categories.
It appears that, at least in terms of distortions, a similar effect
occurs for non-spatial categories, as observed for spatial cate-
gories. However, Hund and Plumert (2003) did not demonstrate
any effects of non-spatial categories on location accuracy. This
might be indicative of a less powerful influence of non-spatial
categories on location memory than spatial categories. This
cannot be determined from their experimental design.
Consideration has not been given to how two or more dis-
torting elements interact with one another, as they inevitably
would in real-world spaces. In this experiment, the relative in-
fluence of spatial category salience and a non-spatial factor,
perceptual grouping, on location memory will be determined.
Perceptual grouping is the grouping together of elements into a
global whole, based on shared properties such as luminance or
shape (Wertheimer, 1923). It has some parallels with the phy-
sical biases observed in location memory; perceptual grouping
is a perceptual effect based on shared perceptual properties,
whilst location biases induce physical grouping based on shared
spatial properties.
Perceptual grouping can have an effect on the perceived spa-
tial characteristics of items. Coren and Girgus (1980) presented
participants with four aligned elements that perceptually
grouped into pairs, e.g. two black and two white equally spaced
circles (luminance grouping). Participants reported within (e.g.
black-black) and between (e.g. black-white) perceptual groups
as closer together and further apart than they really are respec-
tively.
Hommel et al. (2000) showed participants a projected image
of 18 “houses”, grouped by colour or shape. These were ar-
ranged in an approximate oblique four by four formation of
four sets of four items, with two peripheral distracter items.
Interestingly, although they showed an effect of perceptual
grouping for response times to a location judgement task (“Is X
above Y?”), there was no effect of perceptual grouping on dis-
tance estimates. However, the response map was smaller than
the projected image (ratio, 1:2), which might have reduced any
affect of distance estimates. In addition, due to the structured
arrangement, objects were grouped by good continuation,
which could have dictated distance estimates.
The current study, based on Plumert & Hund (2001), inves-
tigated the role of perceptual and spatial factors on location
memory. Category salience was manipulated by dividing the
experimental space using physical boundaries. Target items
could be perceptually grouped by shape similarity. In contrast
to Hund and Plumert (2003), non-spatial categories (in this case,
shapes) crossed spatial category boundaries. This incongruence
enabled us to determine separable influences of perceptual
grouping and spatial category salience on location memory, and
how these two distorting factors interact. Based on the CA
model, it is predicted that increased spatial category salience
will improve accuracy and induce a subdivision effect. If per-
ceptual grouping, a non-spatial category, provides an appropri-
ate referent, then accuracy will also be improved for grouped
compared to control objects, and a prototype effect should be
observed towards the centre of perceptual groups. Both spatial
and non-spatial categories should provoke underestimated
within quadrant distance estimates. Between quadrant distance
estimates should be overestimated if spatial category salience is
a stronger referent, or underestimated if perceptual grouping is
the stronger referent to location memory.
Method
Participants
Sixty-four participants from the University of Reading, with
mean (S.D.) age: 20 years, 4 months (3 years, 0 month) took
part. Participants had normal/corrected to normal vision.
Materials
An open box, referred to as a “house”, was employed (meas-
urements: 32 inches [width] × 32 inches [depth] × 13 inches
[height]). The house could be divided into four equal quadrants
(16 inches2) by inserting 13 inch high opaque walls. The walls
were in place for “boundary” trials only. The base consisted of
a layer of Perspex above a layer of MDF, separated by 0.5 inch
removable floors (32 inches2) could be inserted between the
Perspex and MDF. This ensured that the floor could be changed
without disrupting the location of any objects that had been
placed on the Perspex. There were two training floors, one for
control trials and one for perceptual grouping trials (Figures
1(a) and (b)). Each depicted 20 to-be-remembered locations as
black dots (dot area: 0.3 inch2). Twelve of these dots were ar-
ranged into fou r “target triads” of 3 dots that were each 6 inches
from one another (equilateral triangle formation). If one con-
siders the house in terms of four quadrants, then each target
triad straddled a quadrant boundary, such that two dots were in
the same quadrant of the house, and the third was in an adjacent
quadrant. Each quadrant also featured two of the remaining
eight “distracter” dots. At test, a plain white floor was em-
ployed. To record the locations of placed objects, a measure-
ment floor was inserted. This was a grid of vertical and hori-
zontal lines, spaced at 0.5 inch intervals.
Each participant took part in a control condition and a per-
ceptual grouping condition. These differed in terms of the set of
objects that were employed. In both conditions, objects were 20
different coloured (different for each set: 40 colours in total)
two-dimensional shapes with an area of 2 inches2 and a hole
through their centre. The objects employed in the control con-
dition were all the same, capsule, shape (Figure 1(a)). The
objects employed in the perceptual grouping condition com-
prised of 8 shape types. The target triad locations were paired
with 3 hearts, 3 squares, 3 circles and 3Xs. To explain, within
each target triad the 3 items were the same shape, and the shape
type differed across target triads. The remaining shapes were 2
kites, 2 Hs, 2 triangles and 2 stars. These were paired with the
eight distracter locations (Figure 1(b)).
Design & Procedure
Participants were randomly assigned to either boundary
(house divided into quadrants by opaque walls) or no boundary
(house not divided) conditions (between-participant factor) and
each participant took part in a control and a perceptual grouping
condition (within-participant factor). Thus, there were two in-
dependent variables; boundary condition (boundary, no bound-
ary); and perceptual grouping condition (perceptual grouping,
control). The control condition was carried out first, followed
by the perceptual grouping condition. This was designed to
eliminate the possibility of carryover effects from the percep-
tual grouping condition to the control condition, i.e. by differ-
entiating target triads in the perceptual grouping condition,
participants might have been more likely to notice target triads
Copyright © 2012 SciRes.
954
E. K. FARRAN ET AL.
0
4
8
12
16
20
24
28
32
04812 16 20 24 28 32
location (inch es)
location (inches)
target triads
distracters
(a)
0
4
8
12
16
20
24
28
32
04812 16 20 24 28 32
location (inches)
location (inches)
target triad 1
target triad 2
target triad 3
target triad 4
di st r a ct er t ype 1
dis t ra cte r t ype 2
di st r a ct er t ype 3
dis t ra cte r t ype 4
(b)
Figure 1.
(a) Object locations and shapes employed for the control conditions
(shapes not drawn to proportion). Note, shapes are shown as filled or
unfilled to differentiate target from distracter items. In the experiment,
shapes were individually differentiated using twenty different colours;
(b) Object locations and shapes employed for the perceptual grouping
conditions (shapes not drawn to proportion). Note, all shapes are shown
as black. In the experiment, shapes were individually differentiated
using twenty different colours.
in the control condition (Although, note that Verbeek & Spetch,
2008 report in their location memory study that the order of
control and experimental conditions did not affect perform-
ance).
Each condition comprised of a training phase followed by a
single test trial. In the training phase, a training floor was in
place throughout. Participants watched the experimenter place
the 20 objects on the 20 location dots and were instructed to
remember the object-location pairings. Circular holes in the
centre of each object permitted visibility of the location dots.
Once all 20 objects had been placed by the experimenter, the
participant was asked to turn around so that the house was no
longer in view. The experimenter removed the twenty objects.
The participant faced the house again, was handed each object
in turn (random order) and was asked to place it on the correct
location dot. For each object, if the participants placed it on the
correct location dot, they were handed the next object. If the
participant placed the object on the incorrect location dot, the
experimenter informed them of their error and moved it to the
correct location dot before handing them the next object.
Training trials were repeated until the participant completed a
training trial in which they placed each of the 20 objects on the
correct location dot without error (i.e. the experimenter made
no corrections). This determined that the participant had me-
morised the object-location pairings. The training floor was
then removed and replaced by test floor. In the test trial par-
ticipants were asked to place the objects in the correct locations
onto the plain white floor, this time using their memory of the
precise location of each of the 20 objects.
After completion of the test trial, the test floor was removed
(the objects remained on the clear Perspex) and the measure-
ment floor was inserted and the x and y coordinates of each of
the 20 object placements was measured to the nearest 0.5 inch.
A number of dependent variables were derived, and are ex-
plained fully in the results section. In the training phase, the
dependent variable was the number of training trials required to
reach criterion. In the test phase, the dependent variables were
accuracy score, triad central displacement score and between
and within quadrant distance estimate score.
Results
All data was analysed using statistics software: Statistical
Package for the Social Sciences (SPSS).
Training Phase
The mean (S.D.) number of training trials required to reach
criterion was: boundary, perceptual grouping condition: 4.13
(1.61) trials; boundary, control condition: 6.19 (2.29) trials; no
boundary, perceptual grouping condition: 4.59 (2.17) trials; no
boundary, control condition: 6.78 (3.58) trials. ANOVA was
carried out on the number of training trials, with a between-
participant factor of boundary (boundary, no boundary) and a
within-participant factor of perceptual grouping (control, per-
ceptual grouping). This showed a main effect of perceptual
grouping, F(1,62) = 61.42, p < 0.001 (control > perceptual
grouping). There was no main effect of boundary or boundary
by perceptual grouping interaction (F < 1 for both).
Test Phase
Despite demonstrating competency in the training phase,
some object-location pairings were incorrect at test. Some par-
ticipants transposed the locations of two objects of similar col-
ours or, in the perceptual grouping condition, two objects of
identical shape. Consistent with similar studies (Hund &
Plumert, 2003), transpositions were counted as accurate place-
ments. If transpositions could not be accounted for by object
similarity, they were counted as errors and excluded. Transpo-
sitions and errors were rare; control conditions: 1.6% transposi-
tions, 0.4% errors; perceptual grouping conditions: 0.5% trans-
positions, 0.7% errors.
Accuracy Scores
Accuracy scores measure displacement (inches) between
each observed object placement location at test and the true
location of the object. The accuracy score for each individual is
a mean of their displacement distances across all 20 objects for
that condition. Lower scores indicate higher accuracy (0 =
Copyright © 2012 SciRes. 955
E. K. FARRAN ET AL.
100% accuracy) (Figure 2). Accuracy scores were analysed
using ANOVA with a between-participant factor of boundary
(boundary, no boundary) and a within-participant factor of per-
ceptual grouping (control, perceptual grouping). There was a
significant mai n effect of perceptu al grouping, F(1,62) = 4.07, p =
0.05, due to higher accuracy in the perceptual grouping than con-
trol conditions. There was a main effect of boundary, F(1,62) =
12.57, p = 0.001, due to higher accuracy in the boundary than
no boundary conditions. Although marginal, a boundary by per-
ceptual grouping interaction (F(1,62) = 3.27, p = 0.08) was ex-
plored to reveal that despite an effect of boundary for both con-
trol (t(62) = 4.03, p < 0.001) and perceptual grouping condi-
tions (t(62) = 2.02, p = 0.05) the main effect of perceptual
grouping was driven by the no boundary condition (no bound-
ary: t(31) = 2.48, p = 0.02; boundary: t(31) = 0.16, p = 0.87).
Triad Central Displacement Score: A Measure of
Non-Spatial Categorical Coding
Triad central displacement scores measured the extent to
which observed object placements for target triad items at test
were clustered towards each triad centre (determined according
to the true locations); the true distance between each object and
the triad centre was subtracted from the observed distance be-
tween each object and the triad centre. Positive and negative
scores indicate a displacement away from or towards the triad
centre respectively (Figure 3). The triad displacement score for
each individual is a mean of their displacements for the target
triad locations only (12 locations).
ANOVA was carried out with a between-participant factor of
boundary (boundary, no boundary) and a within-participant
factor of perceptual grouping (control, perceptual grouping).
This showed a main effect of perceptual grouping F(1,62) =
71.59, p 0.001; objects were placed closer to the triad centres
in the perceptual grouping, than the control conditions. One
sample t-tests compared to zero (100% accuracy) revealed that
objects in the perceptual grouping conditions, were grouped
together towards the triad centres (t(63) = –4.34, p < 0.001).
Objects in the control condition were not grouped together, they
were placed significantly further away from the triad centres
than the true locations (t(63) = 7.81, p < 0.001). There was no
effect of boundary (F(1,62) = 2.56, p = 0.12) or perceptual
grouping by boundary interaction (F < 1).
Between and within Quadrant Distance Estimate
Scores: A Me a sure of Spatial Categorical Coding
Each target triad crossed a quadrant boundary; two objects
were within the same quadrant, and the third was in the adja-
cent quadrant. Actual between and within quadrant distances
between pairs of objects in the triad were all 6 inches. Using
target triad locations only, difference scores were created be-
tween each observed and true between and within quadrant dis-
tance, and means created. Positive scores and negative scores
indicate overestimated and underestimated distances respec-
tively (Figure 4).
Distance estimate scores were analysed using ANOVA with
a between-participant factor of boundary (boundary, no bound-
ary) and within-participant factors of perceptual grouping (con-
trol, perceptual grouping) and distance estimate (within quad-
rant, between quadrant). There was a main effect of perceptual
grouping, F(1,62) = 71.63, p 0.001 (perceptual grouping
0.00
0.50
1.00
1.50
2.00
2.50
controlperceptual grouping
Distance (inch es) f rom zero (100% accurate)
Sha
p
e condition
boundary
no bou nd a ry
Figure 2.
Accuracy sco res: mean (S.D.) . Accuracy sco re shows distances in inches
from actual location (a lower score indicates higher accuracy).
-0. 30
-0. 20
-0. 10
0.00
0.10
0.20
0.30
0.40
0.50
0.60
controlperceptu al grouping
Distan ce (inches) from zero (100% accurat e)
boundary
no bounda ry
Figure 3.
Triad central displacement scores: mean (S.D.). Positive and negative
scores indicate displacement away from and towards the triad centre.
-0. 8
-0. 6
-0. 4
-0. 2
0
0.2
0.4
0.6
0.8
1
1.2
boundaryno boundaryboun daryno boundary
controlperceptual grouping
Distance (inches) f rom zero (100% accurat e)
within quadrant
bet ween qu a d rant
Figure 4.
Within and between quadrant distance estimate scores: mean (S.D.).
Positive and negative scores indicate overestimated and underestimated
distances.
score < control score). Separate one sample t-tests compare d to
zero (100% accuracy) demonstrated overestimated distances in
the control condition (t(63) = 7.55, p < 0.001) and underestimated
distances in the perceptual grouping (t(63) = –4.53, p < 0.001).
There was a main effect of boundary, F(1,62) = 4.67, p = 0.04
(no boundary score > boundary score). One sample t-tests
against zero (100% accuracy) showed accurate responses on the
Copyright © 2012 SciRes.
956
E. K. FARRAN ET AL.
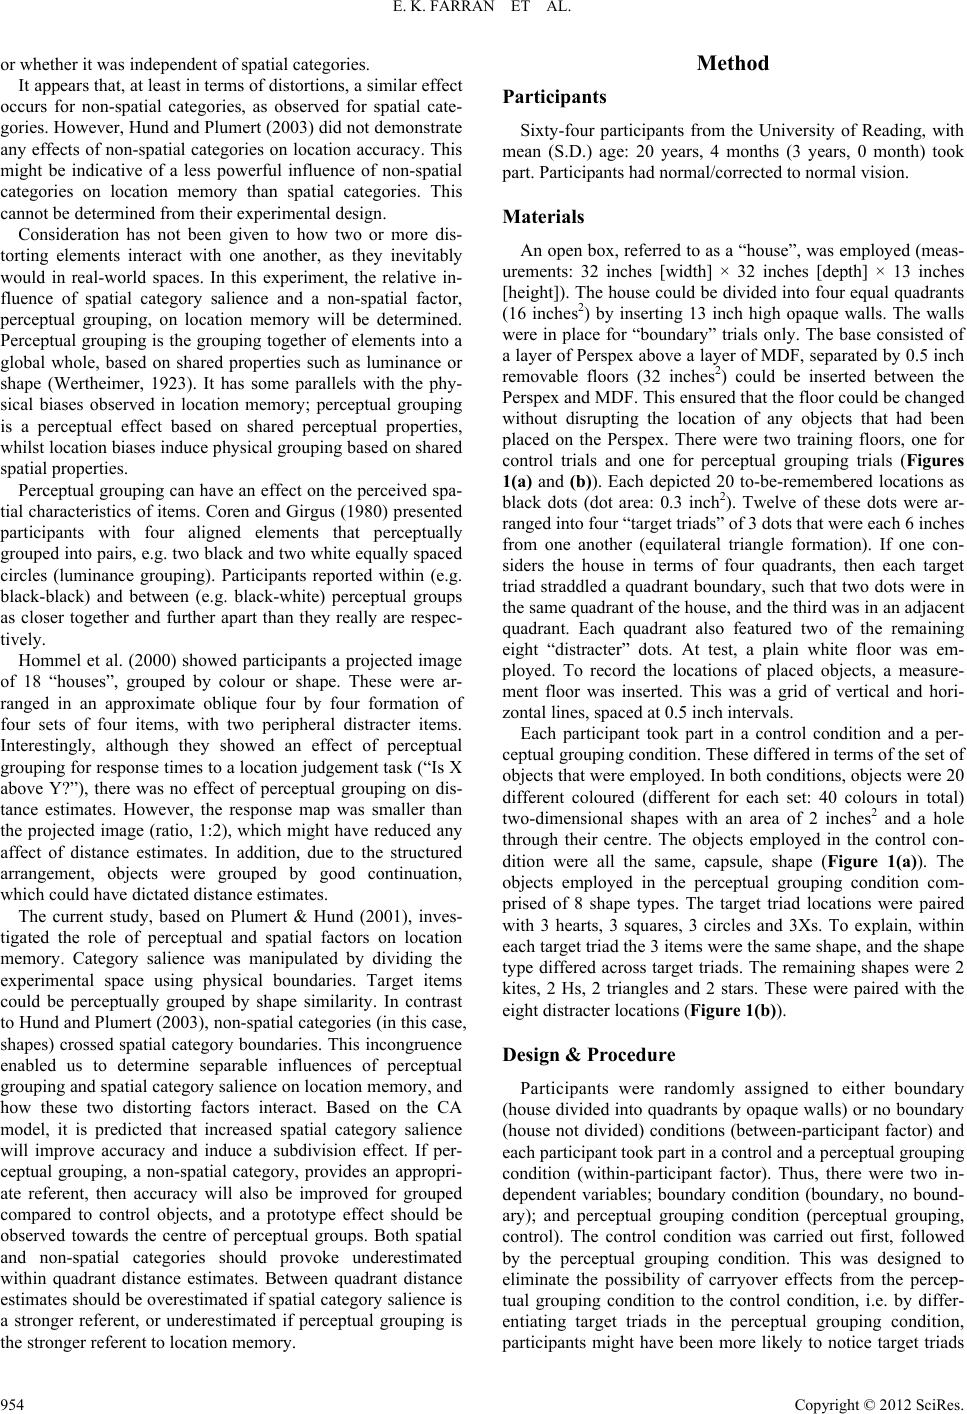
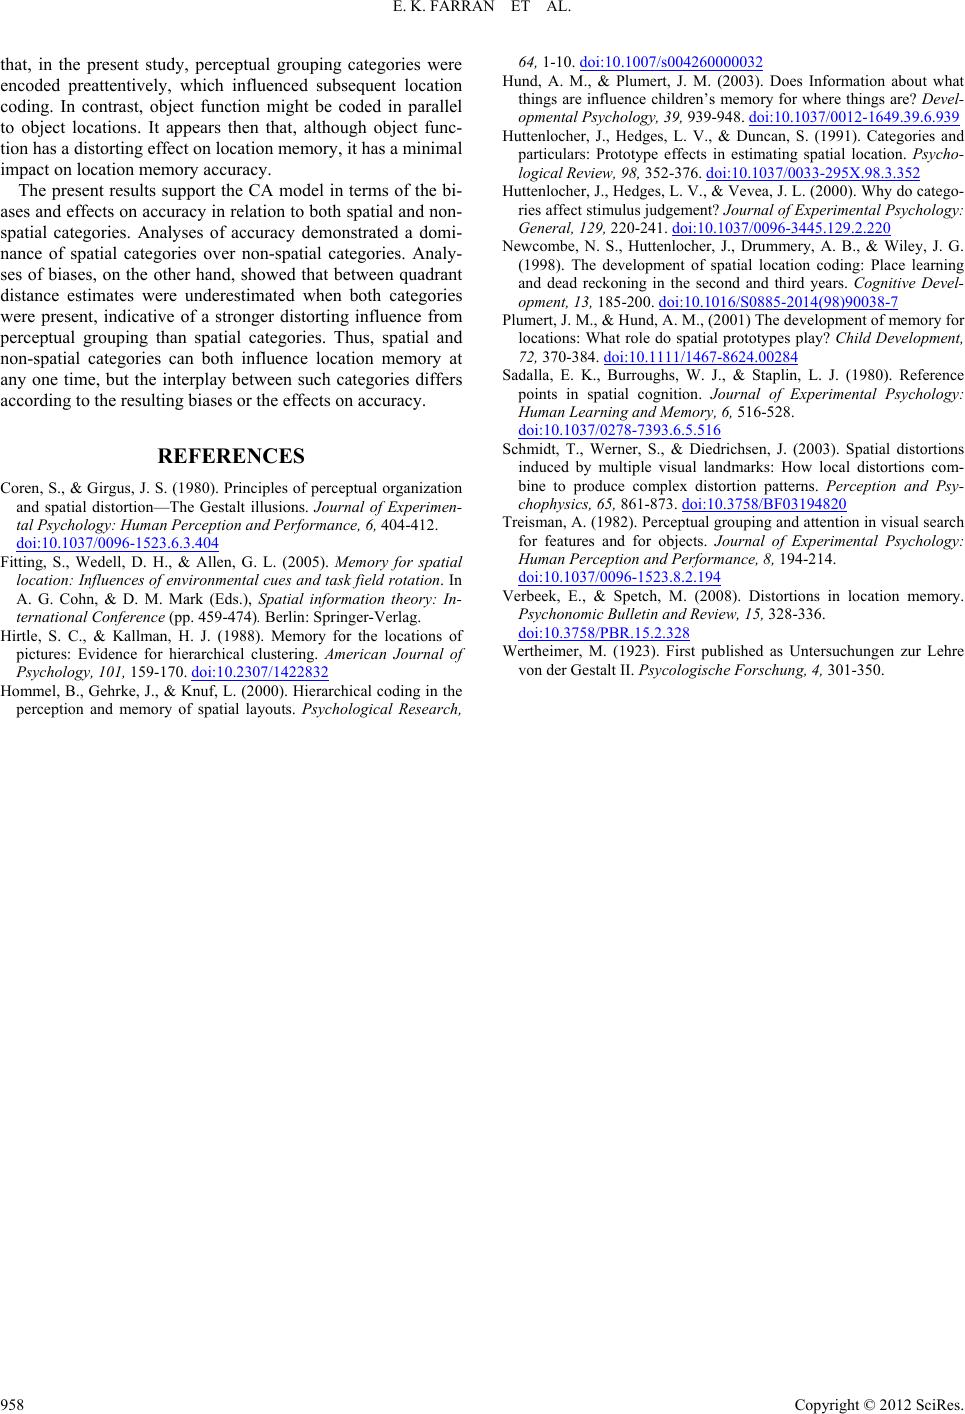
boundary condition (t(31) = 0.87, p = 0.39), but significant over-
estimates in the no bounda ry condition (t(31) = 3.62, p = 0.001).
There was no effect of distance estimate (F < 1) and no two
way interactions (distance estimate by boundary, F < 1; per-
ceptual grouping by boundary, F < 1; distance est imate by per -
ceptual grouping, F(1,62) = 2.35, p = 0.13). There was a signifi-
cant three-way interaction between perceptual grouping, dis-
tance estimate and boundary, F(1,62) = 6.18, p = 0.02. Explora-
tion of this revealed a boundary by distance estimate interaction
for the perceptual grouping condition only (control condition:
F(1,31) = 1.75, p = 0.19; perceptual grouping condition: F(1,31)
= 5.54, p = 0.02) on account of significantly lower within than
between distance estimates in the boundary condition only
(boundary: t(31) = –3.77, p = 0.001; no boundary: t(31) = –0.72,
p = 0.48). Although, note that both within and between quad-
rant distances were underestimated (within: t(31) = –5.15, p <
0.001; between: t(31) = –3.19, p = 0.003).
Discussion
As predicted by the CA model, and consistent with previous
research (Plumert & Hund, 2001), spatial category salience had
a positive effect on accuracy, and also showed evidence of
systematic biases on location memory responses. Importantly, a
similar effect of improved accuracy, and systematic distortions
was also observed for a non-spatial factor, perceptual grouping.
Thus, spatial and non-spatial categorical information influence
spatial estimation. Accuracy and bias are considered separately
below.
Spatial and non-spatial categories had separate effects on lo-
cation memory accuracy. Although marginal, the interaction
between these two factors suggests a dominance of one factor
over the other; although spatial category salience influenced
accuracy regardless of the perceptual grouping condition, an
effect of perceptual grouping on accuracy was observed when
spatial category salience was low (no boundary condition), but
not when it was high (boundary condition). This demonstrates
that locations can be coded with reference to more than one
factor or category, but that improvement to location memory
accuracy is primarily dictated by the strongest available referent.
In this case, high spatial category salience was a stronger ref-
erent than perceptual grouping.
The biases induced by perceptual grouping and spatial cate-
gories on location memory revealed a different pattern to the
accuracy data. When both categories were present (i.e. the per-
ceptual grouping, boundary condition) concurrent distorting
effects were observed; a prototype effect of perceptual grouping
and a subdivision effect of spatial category salience. Thus,
more than one factor can influence location memory at any one
time. This finding is important as it contributes to our under-
standing of real-world location coding, where multiple percep-
tual and spatial referents are present.
The study was designed such that perceptual grouping and
spatial categories were incongruent. Thus, although additive
effects of accuracy could be observed, any distorting effects of
each factor could not, by design, be additive. This enabled us to
determine the relative influence of each factor. Both factors
distorted responses in the predicted directions; however this
was stronger for perceptual grouping than for spatial category
salience. Perceptual grouping distorted responses towards the
centre of each perceptual group, i.e. a prototype effect as pre-
dicted. This occurred universally, irrespective of spatial cate-
gory salience. A subdivision effect was predicted in relation to
spatial categories. This was observed in the boundary condition,
but only for the perceptual grouping condition. In this condition,
the competing effects of perceptual grouping and spatial cate-
gory salience can be observed. Both between and within dis-
tances were underestimated in line with a perceptual grouping
prototype effect, but this was less strong for between than
within quadrant distances, i.e. the pattern dictated by a subdivi-
sion effect across spatial categories. Thus, when perceptual
grouping and spatial category salience compete, the overriding
distorting influence originates from perceptual grouping.
Just as bias effects index categorical coding, performance on
the training trials is also a measure of categorical encoding.
This is because fine-grained information is provided by the
training dots. The pattern of performance in the training phase
showed that fewer training trials were required for the percep-
tual grouping than control conditions to reach criterion, whilst
no difference was observed between boundary and no boundary
conditions. This again suggests that, for categorical coding, per-
ceptual grouping dominates over spatial category salience.
One cannot discuss the bias effects of spatial category sali-
ence in the perceptual grouping conditions, without alluding to
the lack of effect in the control condition. The control condition
is similar to Plumert and Hund (2001), i.e. spatial category
salience is the only influencing factor on performance. Thus,
one would predict distortion effects akin to Plumert and Hund
(2001). The lack of effect in the control condition could relate
to the objects employed. Whilst previous studies used easily
nameable and differentiable objects, the objects used here, by
design, could only be differentiated by colour. Although errors
and transpositions were low, perhaps this influenced the way in
which object-location pairings were remembered. In contrast,
an effect of spatial category salience was observed when shapes
were perceptually grouped. Perhaps perceptual grouping
brought attention to the target triads, thus emphasising that
these groups crossed category boundaries, and in turn introduc-
ing an effect of category salience.
The present results show a consistent pattern of biases to
Hund and Plumert (2003) who also report a prototype effect
towards the centre of groups of non-spatially related objects. By
using incongruent spatial and non-spatial categories, the present
study further qualifies this effect; we have shown that the pro-
totype effect is not related to spatial category. The present re-
sults also support our previous assertion relating to Hommel et
al. (2000). We suggested that they failed to show distortions in
relation to perceptual groups on account of design confounds.
We have shown that, when these confounds are eliminated,
grouping by shape similarity has a distorting effect on object
placements. We cannot, therefore, support Hommel’s et al.
(2000) notion that the organisation of spatial information is not
assessed by distanc e estima tion.
Although Hund and Plumert (2003) report similar biases to
those observed here, they did not find an effect of non-spatial
categories on accuracy, even when spatial categories were not
made salient (equivalent to the “no boundary” condition). This
contrasts to the present results, where accuracy was affected by
non-spatial categories (perceptual grouping) in the no boundary
condition. This difference across studies can be explained by
the nature of each non-spatial category. In Hund and Plumert
(2003) the objects were related by function. Functional catego-
ries require higher level processing than perceptual grouping, a
low-level preattentive process (Treisman, 1982). We suggest
Copyright © 2012 SciRes. 957
E. K. FARRAN ET AL.
Copyright © 2012 SciRes.
958
that, in the present study, perceptual grouping categories were
encoded preattentively, which influenced subsequent location
coding. In contrast, object function might be coded in parallel
to object locations. It appears then that, although object func-
tion has a distorting effect on location memory, it has a minima l
impact on location memory accuracy.
The present results support the CA model in terms of the bi-
ases and effects on accuracy in relation to both spatial and non-
spatial categories. Analyses of accuracy demonstrated a domi-
nance of spatial categories over non-spatial categories. Analy-
ses of biases, on the other hand, showed that between quadrant
distance estimates were underestimated when both categories
were present, indicative of a stronger distorting influence from
perceptual grouping than spatial categories. Thus, spatial and
non-spatial categories can both influence location memory at
any one time, but the interplay between such categories differs
according to the resulting biases or the effects on accuracy.
REFERENCES
Coren, S., & Girgus, J. S. (1980). Principles of perceptual organization
and spatial distortion—The Gestalt illusions. Journal of Experimen-
tal Psychology: Human Perception an d Performance, 6, 404-412.
doi:10.1037/0096-1523.6.3.404
Fitting, S., Wedell, D. H., & Allen, G. L. (2005). Memory for spatial
location: Influences of environmental cues and task field rotation. In
A. G. Cohn, & D. M. Mark (Eds.), Spatial information theory: In-
ternational Conference (pp. 459-474). Berlin: Springer-Verlag.
Hirtle, S. C., & Kallman, H. J. (1988). Memory for the locations of
pictures: Evidence for hierarchical clustering. American Journal of
Psychology, 101, 159-170. doi:10.2307/1422832
Hommel, B., Gehrke, J., & Knuf, L. (2000). Hierarchical coding in the
perception and memory of spatial layouts. Psychological Research,
64, 1-10. doi:10.1007/s004260000032
Hund, A. M., & Plumert, J. M. (2003). Does Information about what
things are influence children’s memory for where things are? Devel-
opmental Psychology, 3 9 , 939-948. doi:10.1037/0012-1649.39.6.939
Huttenlocher, J., Hedges, L. V., & Duncan, S. (1991). Categories and
particulars: Prototype effects in estimating spatial location. Psycho-
logical Review, 98, 352-376. doi:10.1037/0033-295X.98.3.352
Huttenlocher, J., Hedges, L. V., & Vevea, J. L. (2000). Why do catego-
ries affect stimulus judgement? Journal of Experimental Psychology:
General, 129, 220-241. doi:10.1037/0096-3445.129.2.220
Newcombe, N. S., Huttenlocher, J., Drummery, A. B., & Wiley, J. G.
(1998). The development of spatial location coding: Place learning
and dead reckoning in the second and third years. Cognitive Devel-
opment, 13, 185-200. doi:10.1016/S0885-2014(98)90038-7
Plumert, J. M., & Hund, A. M., (2001) The development of memory for
locations: What role do spatial prototypes play? Child Development,
72, 370-384. doi:10.1111/1467-8624.00284
Sadalla, E. K., Burroughs, W. J., & Staplin, L. J. (1980). Reference
points in spatial cognition. Journal of Experimental Psychology:
Human Learning and Memory, 6, 516-528.
doi:10.1037/0278-7393.6.5.516
Schmidt, T., Werner, S., & Diedrichsen, J. (2003). Spatial distortions
induced by multiple visual landmarks: How local distortions com-
bine to produce complex distortion patterns. Perception and Psy-
chophysics, 65, 861-873. doi:10.3758/BF03194820
Treisman, A. (1982). Perceptual grouping and attention in visual search
for features and for objects. Journal of Experimental Psychology:
Human Perception and Performance, 8, 194-214.
doi:10.1037/0096-1523.8.2.194
Verbeek, E., & Spetch, M. (2008). Distortions in location memory.
Psychonomic Bulletin an d Review, 15, 328-336.
doi:10.3758/PBR.15.2.328
Wertheimer, M. (1923). First published as Untersuchungen zur Lehre
von der Gestalt II. Psycolog isc he Forschung, 4, 301-350.