 Creative Education 2012. Vol.3, No.7, 1231-1240 Published Online November 2012 in SciRes (http://www.SciRP.org/journal/ce) http://dx.doi.org/10.4236/ce.2012.37182 Copyright © 2012 SciRes. 1231 The Effects of Teaching Mathematics Performed with the Help of CSCM on Conceptual Learning Ramazan Gürbüz1, Emrullah Erdem1, Selçuk Fırat2 1Department of Elementary Mathematics Education, Faculty of Education, Adiyaman University, Adiyaman, Turkey 2Department of Computer Education and Instructional Technology, Faculty of Education, Adiyaman University, Adiyaman, Turkey Email: rgurbuz@outlook.com, eerdem@outlook.com, sfirat02@gmail.com Received September 3rd, 2012; revised October 5th, 2012; accepted October 19th, 2012 This paper explores the effect of teaching mathematics performed with the help of Computer-Supported Concept Maps (CSCM) on the conceptual learning. To achieve this end, CSCM were developed and used in the process of teaching probability subject. Within the true-experimental research method, a pre- and post-test control groups study was conducted with 39 seventh graders—20 in experimental group, and 19 in the control group. Each group was taught three times/week, 40 min/session, for 2 weeks. A 12-item in- strument was used to collect data. After the teaching intervention, the same instrument was re-adminis- tered to both groups as post-test. The results suggested that students in the experimental group performed significantly better than those in the control group, in terms of conceptual learning. Keywords: Teaching Mathematics; Computer-Supported Concept Maps (CSCM); Conceptual Learning; Cooperative Learning; Probability Introduction The main purpose of education is to teach students the nature of knowledge based on concepts. Concepts can be defined as generalised and symbolised aspect of an encountered event or a learned object. In showing concepts and relationships between them, Concept Maps (CM) are among very important materials. CM strategy, which shows how people learn and make sense of knowledge, was developed as a result of the research project carried out with students studying in University of Cornell by Joseph Novak in the year 1974. CM are defined as tools re- vealing the connections between the concepts in the form of hierarchical and cross-linking (Willerman & Harg, 1991). CM strategy is an educational strategy aiding students in compre- hending subjects, in integrating old and new knowledge, in improving their perceptional levels, and in increasing their suc- cess (Heinze-Fry & Novak, 1990). In this sense, it is thought that CM strategy which has been frequently used recently (Anderson-Inman & Zeitz, 1993; Jonassen, 1996; Anderson- Inman, Ditson, & Ditson, 1998; Novak & Cañas, 2006) can be an effective teaching strategy. But it is more difficult to deter- mine all the probable relationships in a large content concept map and to put them on a limited space on a paper (Novak & Gowin, 1984; Gürbüz, 2006a). For this reason, in recent years, Computer-Supported Concept Maps (CSCM) that have unlim- ited space are employed as teaching materials in learning envi- ronments. Computer-Supported Concept Maps (CSCM) CSCM, which are one of the most effective tools in con- creteization of abstract concepts, are important teaching materi- als (Anderson-Inman & Ditson, 1999), because in the CSCM; concepts, connections, and formulas which have been placed into the gaps in the map are shown on a virtual platform. In this way, students have the opportunity to select among these con- cepts, connections, and formulas (Chang, Sung, & Chen, 2001; Tsai, Lin, & Yuan, 2001). The importance of CSCM is also because they give the opportunity to construct knowledge visu- ally (Gürbüz, 2006a), to construct their concept maps via feed- backs given in computer environment (Chang et al., 2001) and to make learners engaged (Novak & Gowin, 1984; Anderson- Inman & Zeitz, 1993). In addition to these, CSCM provide a lot of advantages such as being able to save and to print documents, to make changes if required, to create big maps, to make con- nections and to zoom (Rautama, 2000). Moreover, practicality, dynamic linking, digital communication, and digital recording can be considered to be the other advantages of the CSCM. The literature mentioned the positive effects of combining computer software with concept maps in learning environments (Anderson-Inman & Zeitz, 1993; Anderson-Inman & Horney, 1996; Anderson-Inman & Ditson, 1999; Simone, Schmid, & McEwen, 2001; Chang, Sung, & Chen, 2002; Baki & Mandacı- Şahin, 2004; Kwon & Cifuentes, 2009; Chiu & Hsiao, 2010; Huang et al., 2012). For example, Anderson-Inman & Horney (1996) indicated that computer-based visualization made learn- ing process more accessible to students, and it alleviates the frustration felt by students during the process of constructing and revising concept maps using paper and pencil. Anderson- Inman & Ditson (1999) stated that CSCM ensured the con- creteization of abstract concepts and thus they could be used in learning environments effectively. In another study, Kwon and Cifuentes (2009) pointed out that the computer-based concept mapping was facilitative of knowledge construction. The cooperative goal structure is also an important factor in order for enhancing the effectiveness of CSCM strategy. This is because the cooperative learning environment requires students  R. GÜRBÜZ ET AL. to work in small, mixed-ability learning groups (Slavin, 1987). The cooperative learning approach increases students’ motiva- tion to learn mathematics while it also enables them to have fun doing that (Johnson & Johnson, 1989) and it helps the students focus on the subject or task by enabling them to work with each other and by providing a comfortable environment to work in (Slavin, 1996). In conjunction with increasing use of computer technology, this cooperative learning approach can be per- formed in computer-supported learning environments more effectively. According to Ledesma (2010), computer technol- ogy makes it possible for the students using it to develop skills that are not developed by other students using pencil and paper and blackboard. In this sense, Matin (2012) points out that computer-supported learning environments will engage stu- dents, give positive interdependence, face-to-face interaction, and will help them develop interpersonal skills and individual accountability in better understanding, critical thinking and judgment. Thus, more effective learning can be ensured by employing the CSCM strategy together with cooperative groups. Recent studies also discussed the positive effects of the in- structtions conducted in cooperative groups with the CSCM (Stoyanova & Kommers, 2002; Brown, 2003; Kwon & Cifuen- tes, 2009). Literature Review Regarding CSCM When searching literature, it is possible to encounter with a great deal of studies mentioning positive effects of CSCM. For example, in their study, Anderson-Inman and Zeitz (1993) con- cluded that computer-based concept mapping using Inspiration TM encouraged students to revise or change their maps more (compared to the maps they drew using paper and pencil) and fostered knowledge representation and construction. In another work, Sturm and Rankin-Erickson (2002) examined the effects of two forms of concept mapping; hand-drawn and computer- generated, on the descriptive essay writing of middle level stu- dents with learning disabilities. Results showed that students’ hand-written descriptive essays and those produced in com- puter-mapping conditions demonstrated significant increases. It was also found that students’ attitudes towards writing were significantly more positive in computer-mapping condition compared to no-mapping and hand-mapping conditions. Baki and Mandacı-Şahin (2004) carried out a study to determine the pre-service elementary teachers’ misconceptions about the sub- ject “set” through CSCM. It was suggested that the students’ concept mapping process using the Inspiration® package pro- gramme could be used as an effective assessment technique. Royer and Royer (2004) investigated the difference between hand drawn and computer generated concept mapping with 9th and 10th graders. They found that the group using the com- puters created more complex maps than the others did. Also, they theorised that computers enabled students to communicate more clearly, to add and revise concept maps more easily, and to discover relationships between sub-concepts more readily. Yavuz (2005) examined the effectiveness of conceptual change instruction accompanied with demonstration and computer assisted concept mapping on seventh grade students’ under- standing matter concepts. The results indicated that this teach- ing process provided a better acquisition of scientific concep- tions related to matter concepts and produced more positive attitudes toward science as a school subject than traditionally designed science instructions. Kwon and Cifuentes (2009) in- vestigated the comparative effects of individually-constructed and collaboratively-constructed computer-based concept map- ping on middle school science concept learning. They found that computer-based concept mapping facilitated knowledge construction and the students had a deeper understanding by working collaboratively rather than by working individually. Chiu and Hsiao (2010) studied how elementary school students generated concept maps in computer-supported collaborative learning. They found that almost 70% of the collaborative groups were classified as passive or reticent and frequently off- task. These student groups were poorly functioning collabora- tive groups and produced poor quality discourses and products. Also, it was concluded that there was a great need for methods such as training or intervening approaches that could enhance the interaction and improve the quality of the discourse in the computer-mediated collaboration for elementary school stu- dents. Huang et al., (2012) explored the effect of multidimen- sional concept mapping instruction on students’ learning per- formance in a web-based computer course. The 103 fourth graders were divided into three groups: multidimensional con- cept map (MCM) instruction group, Novak concept map (NCM) instruction group, and traditional textbook (TT) instruction group. The experimental results suggested that subjects in the MCM group performed significantly better than those in the NCM group which in turn performed significantly better than those in the TT group. As understood from the reviewed literature, CSCM ensure learners perform more effective learnings especially when com- pared to no-mapping and/or hand-mapping conditions. There- fore, in the current study, we examined the effect of teaching mathematics performed with the help of CSCM on the con- ceptual learning. Methodology Participants Within true-experimental research method, this study was conducted with a total of 39 seventh-grade students from an elementary school in Turkey. These students studying in the same class were divided into two groups according to whether their school numbers were even or odd (experimental group (E) = 20 and control group (C) = 19). Students in experimental group were organized as 2-student cooperative groups (see Figure 1(b)). Computer-Supported Concept Maps (CSCM) Material The CSCM material was developed by NetBeans’ editor by using the Java language. While constructing CSCM material, extra attention was paid to ensure that it included all concepts on probability subject taught at 7th grade level and that rela- tionships between these concepts were given in a concise way. For example, the relationship between “Experiment” and “Re- sult” is stated as “what is gathered from experiment is a result”. However, all these concepts and relationships were not given directly; rather, users were given some cues in the system to find them by themselves. For instance, some cues such as “it takes values ranging from 0 to 1” and “it is a concept related to chance” were given for the space in which “probability” con- cept was to be placed. If the user puts a wrong concept, link or Copyright © 2012 SciRes. 1232  R. GÜRBÜZ ET AL. (a) (b) Figure 1. Reflections from experimental group. formula into the system, “you have entered wrong info” feed- back is shown on the screen and, thus, the first cue that will lead the user to correct answer is provided. If the user enters wrong info despite this cue, system gives another cue with a more explanatory feedback. For example, when the user writes “Not-Mutually Exclusive Event” upon seeing the cue “the probability of a randomly selected geometric shape from the screen to be red or hexagon, is related to … concept”, system gives the feedback “Congratulations! Correct Answer”. If the user writes “Mutually Exclusive Event” upon seeing the same cue, system presents another cue (Cue 2) such as “do these two incidents have common units or not?” When, however, the user who cannot find the correct answer despite all these cues, clicks on the Cue 2 in Figure 2, the system will give another more detailed explanation to the user such as: “Let us calculate the probability of a geometric shape selected randomly from the screen in Figure 2 to be red or square together. After analyzing the screen, it is possible to see that when the geometric shape is both red and square, we call this ‘Not-Mutually Exclusive Event’. Therefore, the probability of these two incidents can be calculated by this formula: P(RUS) = P(R) + P(S) − P(R∩S). The reason why we subtract P(R∩S) is that we use red squares both when calculating red shapes and squares”. This material improves students’ self-confidence both because it motivates them and also because it helps create a learning environment in which they can construct information by themselves. Moreover, since this material creates an environment in which students discover the relationships between concepts by themselves, it gives users opportunity to build new relationships they do not anticipate. This material was pilot-studied with 18 seventh-grade stu- dents who did not participate in the real study and were divided into nine groups each consisting of two students. By using the pilot study, the probable deficiencies of the material and the problems, which could be encountered during the application process, were determined and necessary corrections were made. A sample interface from the designed material is illustrated in Figure 3. Instrument The instrument used (Conceptual Learning Test-CLT) was composed of 12 questions (some of them were given in Appen- dix) which were in open-ended format. Some of the questions were developed by the researchers, and some were developed with the help of related literature (Fast, 1997; Pratt, 2000; Baker & Chick, 2007; Nilsson, 2007, 2009; Gürbüz, 2006b; 2010). The validity of the instrument was confirmed by two mathe- matics educators and two mathematics teachers. Furthermore, the pilot test was performed with 34 seventh-grade students who did not participate in the real study. The pilot study re- vealed that questions on the subject of probability were under- standable and clear for seventh-grade students. In this study, the Kuder-Richardson formula 20 (KR-20) reliability coefficient of the instrument was found to be 0.88. Procedure The CLT was administered to both groups as a pretest before instructions. Both groups were encouraged to answer all the questions. A researcher managed the experimental group, while the maths teacher in the study managed the control group by conducting the application process simultaneously. The remain- ing two researchers participated in the study as observers for experimental and control groups by rotating. Each group was taught three times/week, 40 min/session, for 4 weeks. After the instructions, CLT was re-administered to both groups as a post- test. In experimental group, some questions related to daily life such as “what does scoring a goal through a penalty shoot de- Figure 2. A sample cue and explanation given to users by the system. Copyright © 2012 SciRes. 1233  R. GÜRBÜZ ET AL. Copyright © 2012 SciRes. 1234 Figure 3. An interface from CSCM material pend on?”, “the probability of having rain in Adiyaman is 1/4. How do you think I got it?” were asked to students. After these questions had been discussed with students for a while, teach- ing of probability concepts were performed with materials (spinners, dice, dart, board etc. (see Figure 1(a)) by an experi- enced researcher. Then, CSCM was employed in teaching pro- cess after students had been informed about CM and CSCM. In this process, the students were requested to run the computer animations, and they were asked to share their thoughts with their partners. Moreover, the student groups asked questions to each other such as “why are you doing that?” and “how did you get that?” or made statements such as “oh no, that is not right, because…” and “…but that is wrong, because…” during the implementations. This process was ensured by devoting con- siderable class time to solving problems, proposing and justi- fying alternative solutions, critically evaluating alternative cour- ses of action, leading to different methods of solving problems. Students are expected and encouraged to make conjectures, explain their reasoning, validate their assertions, discuss and question their own thinking and the thinking of others, and argue what is mathematically true. Also during this process, the researcher acted as a counselor, cooperator, and supervisor. As a result, students became more active, improved their know- ledge, questioned the knowledge they received, and were able to explain what they had just learned instead of behaving as merely passive receivers. In other words, it could be stated that students in this group learnt subjects the way they wanted. For instance, they reached solution of any given question by con- ducting limitless experiments, by using tree diagrams and by discussing among themselves as they wished. In the control group, the instructions were performed on a teacher-centered basis and delivered verbally, according to the book. The teacher (usual teacher) would note down the ne- cessary points on the chalkboard (talk-and-chalk type instruc- tion). While writing on the board, the teacher framed the important parts using colored chalk. During the process the students sat in their seats silently and listened to the teacher. Then, the teacher gave them some time to take notes from the board. The teacher also asked if they had any questions about the subject. Meanwhile, he walked around the class and ans- wered their questions. In brief, 70% - 75% of the probability subject was composed of only the teacher’s talk. At the end of the lesson, the teacher asked the students to answer the ques- tions at the end of the unit. In the control group, questions such as “suppose that there are some balls numbered from 1 to 8 in a glass jar. When you close your eyes, mix the balls and choose a ball in the jar, what is the probability of getting a ball num- bered with an odd number?” were generated and solved. To sum up, the experiments were done and the results were obtained by imagination without using any other materials or animations. Students in this group learnt based on rules esta- blished by the teacher. When a student asked teacher a question while solving a question, the teacher solved it by reminding students of rules he showed before. For example, when a stu- dent asked a question such as: “Teacher! Why are we adding the scores? Should not we multiply them instead?” the teacher responded: “Let us remember our rule, if two events are discrete, probability of them are added”. 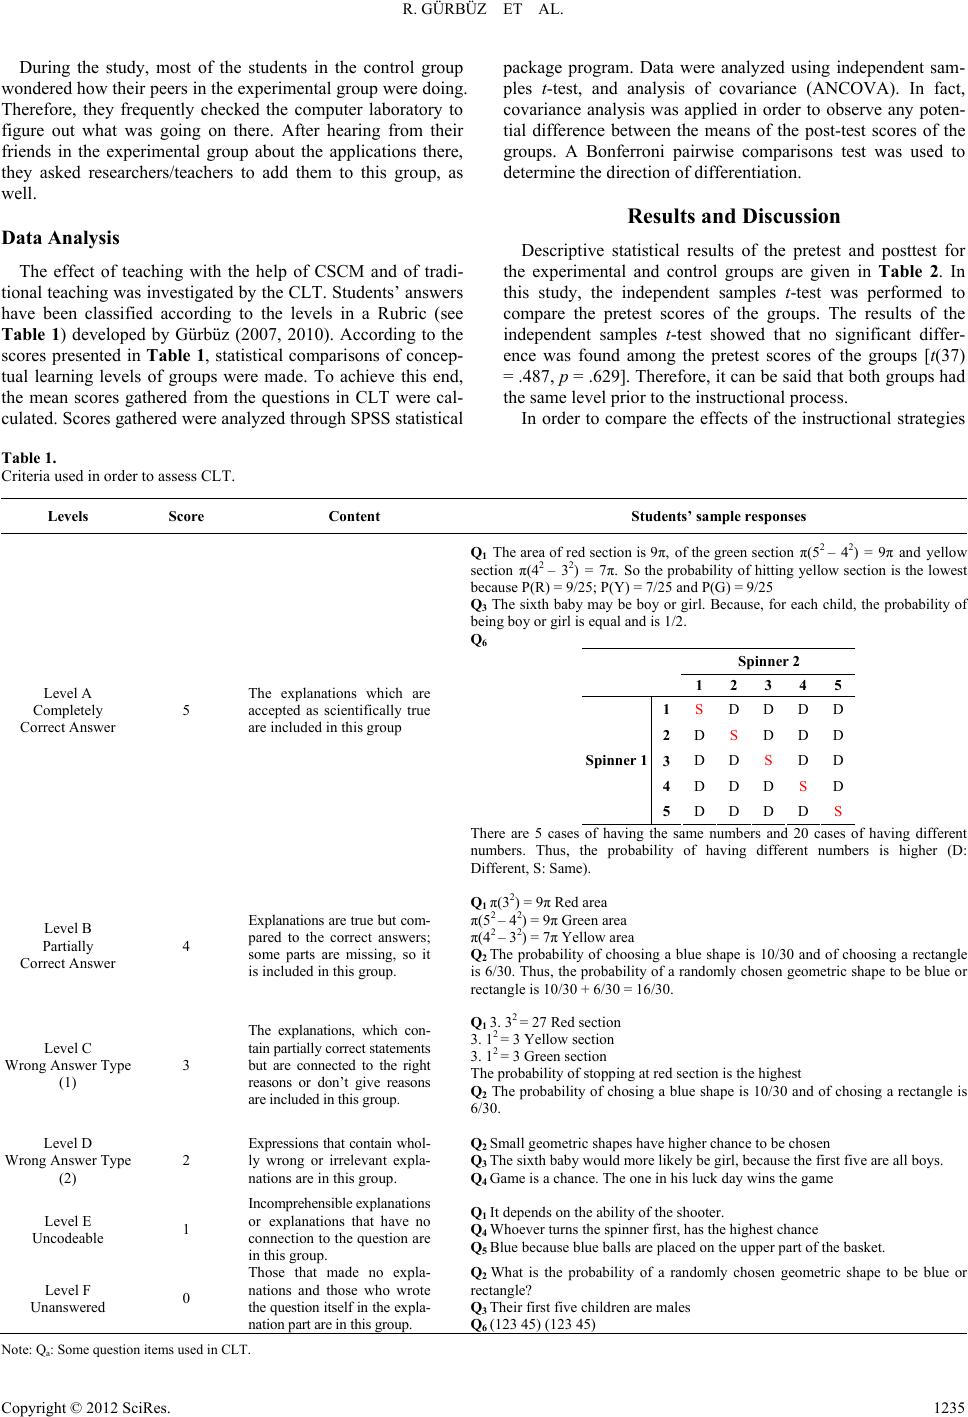 R. GÜRBÜZ ET AL. During the study, most of the students in the control group wondered how their peers in the experimental group were doing. Therefore, they frequently checked the computer laboratory to figure out what was going on there. After hearing from their friends in the experimental group about the applications there, they asked researchers/teachers to add them to this group, as well. Data Analysis The effect of teaching with the help of CSCM and of tradi- tional teaching was investigated by the CLT. Students’ answers have been classified according to the levels in a Rubric (see Table 1) developed by Gürbüz (2007, 2010). According to the scores presented in Table 1, statistical comparisons of concep- tual learning levels of groups were made. To achieve this end, the mean scores gathered from the questions in CLT were cal- culated. Scores gathered were analyzed through SPSS statistical package program. Data were analyzed using independent sam- ples t-test, and analysis of covariance (ANCOVA). In fact, covariance analysis was applied in order to observe any poten- tial difference between the means of the post-test scores of the groups. A Bonferroni pairwise comparisons test was used to determine the direction of differentiation. Results and Discussion Descriptive statistical results of the pretest and posttest for the experimental and control groups are given in Table 2. In this study, the independent samples t-test was performed to compare the pretest scores of the groups. The results of the independent samples t-test showed that no significant differ- ence was found among the pretest scores of the groups [t(37) = .487, p = .629]. Therefore, it can be said that both groups had the same level prior to the instructional process. In order to compare the effects of the instructional strategies Table 1. Criteria used in order to assess CLT. Levels Score Content Students’ sample responses Level A Completely Correct Answer 5 The explanations which are accepted as scientifically true are included in this group Q1 The area of red section is 9π, of the green section π(52 – 42) = 9π and yellow section π(4 2 – 32) = 7π. So the probability of hitting yellow section is the lowest because P(R) = 9/25; P(Y) = 7/25 and P(G) = 9/25 Q3 The sixth baby may be boy or girl. Because, for each child, the proba ility o being boy or girl is equal and is 1/2. Q6 Spinner 2 12 3 4 5 1SD D D D 2DS D D D 3DD S D D 4DD D S D Spinner 1 5D D D D S There are 5 cases of having the same numbers and 20 cases of having different numbers. Thus, the probability of having different numbers is higher (D: Different, S: Same). Level B Partially Correct Answer 4 Explanations are true but com- pared to the correct answers; some parts are missing, so it is included in this group. Q1 π(32) = 9π Red area π(52 – 42) = 9π Green area π(42 – 32) = 7π Yellow area Q2 The probability of choosing a blue shape is 10/30 and of choosing a rectangle is 6/30. Thus, the probability of a randomly chosen geometric shape to be blue o rectangle is 10/30 + 6/30 = 16/30. Level C Wrong Answer Type (1) 3 The explanations, which con- tain partially correct statements but are connected to the right reasons or don’t give reasons are included in this group. Q1 3. 32 = 27 Red section 3. 12 = 3 Yellow section 3. 12 = 3 Green section The probability of stopping at red section is the highest Q2 The probability of chosing a blue shape is 10/30 and of chosing a rectangle is 6/30. Level D Wrong Answer Type (2) 2 Expressions that contain whol- ly wrong or irrelevant expla- nations are in this group. Q2 Small geometric shapes have higher chance to be chosen Q3 The sixth baby would more likely be girl, because the first five are all boys. Q4 Game is a chance. The one in his luck day wins the game Level E Uncodeable 1 Incomprehensible explanations or explanations that have no connection to the question are in this group. Q1 It depends on the ability of the shooter. Q4 Whoever turns the spinner first, has the highest chance Q5 Blue because blue balls are placed on the upper part of the basket. Level F Unanswered 0 Those that made no expla- nations and those who wrote the question itself in the expla- nation part are in this group. Q2 What is the probability of a randomly chosen geometric shape to be blue o rectangl e? Q3 Their first five children are males Q6 (123 45) (123 45) Note: Qa: Some question items used in CLT. Copyright © 2012 SciRes. 1235  R. GÜRBÜZ ET AL. implemented on the groups in the post-test scores using AN- COVA, the tests of homogeneity within the group regression slopes were conducted. As a result of the analysis the slopes were found to be homogenous, as in Group*Pre-test [F(1 - 35) = .609, p = .440], within the groups. Therefore, a covariance analysis was applied in order to observe any potential differ- ence between the means of the posttest scores of the groups. The result of the one-way ANCOVA is given in Table 3. As shown in Table 3, the analysis of the posttest score data indicates significant overall intervention effects, controlling the pretest [F(1, 36) = 35.946, Partial η = .500, p < .01]. Regarding the posttest scores, the students in the experimental group bene- fitted significantly more than those in the control group (Mean difference = 1.031, p < .01). From the results of the pair-wise test, it can be stated that the CSCM strategy was more effective than the traditional teaching methods in terms of improving conceptual learning. In this study, the effect sizes (partial eta sequared) were calculated to be .500. It can be stated that the CSCM strategy had a high effect on the conceptual learning according to Cohen (1988). These outcomes corroborate the results of Anderson-Inman & Zeitz (1993), Anderson-Inman et al., (1998), Simone et al., (2001), Chang et al., (2002), Stoyanova & Kommers (2002), Brown (2003), Baki & Mandacı-Şahin (2004), Kwon & Cifuentes (2009) and Huang et al., (2012). It could be asserted that researcher teacher factor has also affected this process along with CSCM, because, teacher sel- dom invited students to present their work to other students and never discussed or allowed students to share unsuccessful at- tempts. In the contrast, researcher encouraged students to solve problems in any way they desired and to discuss with the whole class their methods as well as their unsuccessful attempts. He also encouraged solution of problems in alternative ways. Clearly, teacher and researcher’s students were offered prob- ability theory of different natures. The nature of probability theory made available to learn in teacher’s classes was charac- terized by a domain that deals with final results only, where ways employed to reach these results are not important, and problems are solved by simply following rules developed by experts. In contrast, by participating in the researcher’s classes, students were exposed to a different nature of probability the- ory. The nature of probability theory made available to learn in researcher classes was characterized by a domain that deals Table 2. Pretest and posttest scores of the groups. Pre-test Post-test Estimated post-test* Group n M SD M SD M* SE Experimental 20 1.57 .66 3.12 .73 3.092.120 Control 19 1.47 .59 2.02 .63 2.060.123 Table 3. Results of the covariance analysis on post-test scores of the groups. Measure (Post-test) F df p Partial η2Direction Overall 35.946 1-36 .000 .500 (Bonferroni) Mean Difference (I-J) Experimental (I) versus Control (J) 1.031 .000 I > J with final results as well as with ways of reaching these results; a domain in which examining mistakes is important and con- structive and could help in achieving correct solutions and un- derstanding. In parallel with this, Boaler (1997), Even and Kvatinskt (2010) and Gürbüz, Birgin and Çatlioğlu (2012) also focused on the fact that teachers and different teaching ap- proaches adopted by teachers had a significant influence on students’ learning. The researcher referred to the role of prob- ability theory on mathematics and in other domain. Also, he put emphasis on probability theory depending on predictor’s know- ledge. But, teacher didn’t mention any of these cases. What the teacher did not address in class was basically not required ex- plicitly for the examinations and was not included in the text- books they used, which were closely connected to the examina- tions. Some related research on teacher anxiety (Black & Wil- lam, 1998; Ayres, Sawyer, & Dinham, 2004) also showed that central exams had an effect on learning environments and that these exams encouraged test-based teaching. It is thought that providing students’ pre-test and post-test answers will more clearly show the effect of this intervention. For this reason, explanations related to some questions in CLT made by some of the students of experimental group in the pre- and post-test were examined carefully. It was found that the students who had mistakes regarding question Q1 had different justifications for their wrong answers in pretest. For example, “Green because green is on the narrow side of dart”, “Red has the highest probability since it is on center”, “The probability of targeting on yellow and green col- ored sections is the lowest because they have smaller radii”. As stated by Kahneman (2003), Gürbüz (2007), Gürbüz, Çatlıoğlu, Birgin and Erdem (2010) and Gürbüz and Birgin (2012), these students gave their answers based on their visual intuitions rather than on their logical reasoning. Some of the students were found to give non-mathematical answers such as “It de- pends on the ability of the shooter” or “It depends on chance, so, no comment can be made”. Such approaches of students who gave wrong answers to question Q1 are in line with the student approaches in the studies of Jones, Langrall, Thornton and Mogill (1997), Gürbüz (2007, 2010), Gürbüz et al., (2010), Erdem (2011) and Gürbüz and Birgin (2012). In posttest, when comparing to pretest, the students had more true justifications regarding question Q1. For example, “The area of red section is 9π, of the green section π(52 − 42) = 9π and yellow section π(42 – 32) = 7π. So the probability of hitting yellow section is the low- est because P(R) = 9/25; P(Y) = 7/25 and P(G) = 9/25”, “You need to find the area each section covers. π(32) = 9π Red area; π(52 – 42) = 9π Green area and π(42 – 32) = 7π Yellow area”. It was observed that, in Q2, students’ knowledge related to mutually exclusive and not-mutually exclusive events were not sufficient in pretest and thus they gave wrong or incomplete answers for different reasons. For example, responses such as “The probability of getting blue is 10/30 while getting rectan- gle is 2/30”, “The probability of getting blue and rectangle is the same because there is blue color, too, in rectangular shapes” The probability of getting blue and rectangle is 2/10” were given by the students. On the other hand in posttest, it was found out that students grasped the difference between discrete and indiscrete events. However, it cannot be said that all stu- dents understood that there was an intersection set in indiscrete events. For example, “P(AUB) = P(A) + P(B) – P(A∩B), the probability of getting blue is 10/30, the probability of getting rectangle is 6/30 and the probability of getting both blue and Copyright © 2012 SciRes. 1236 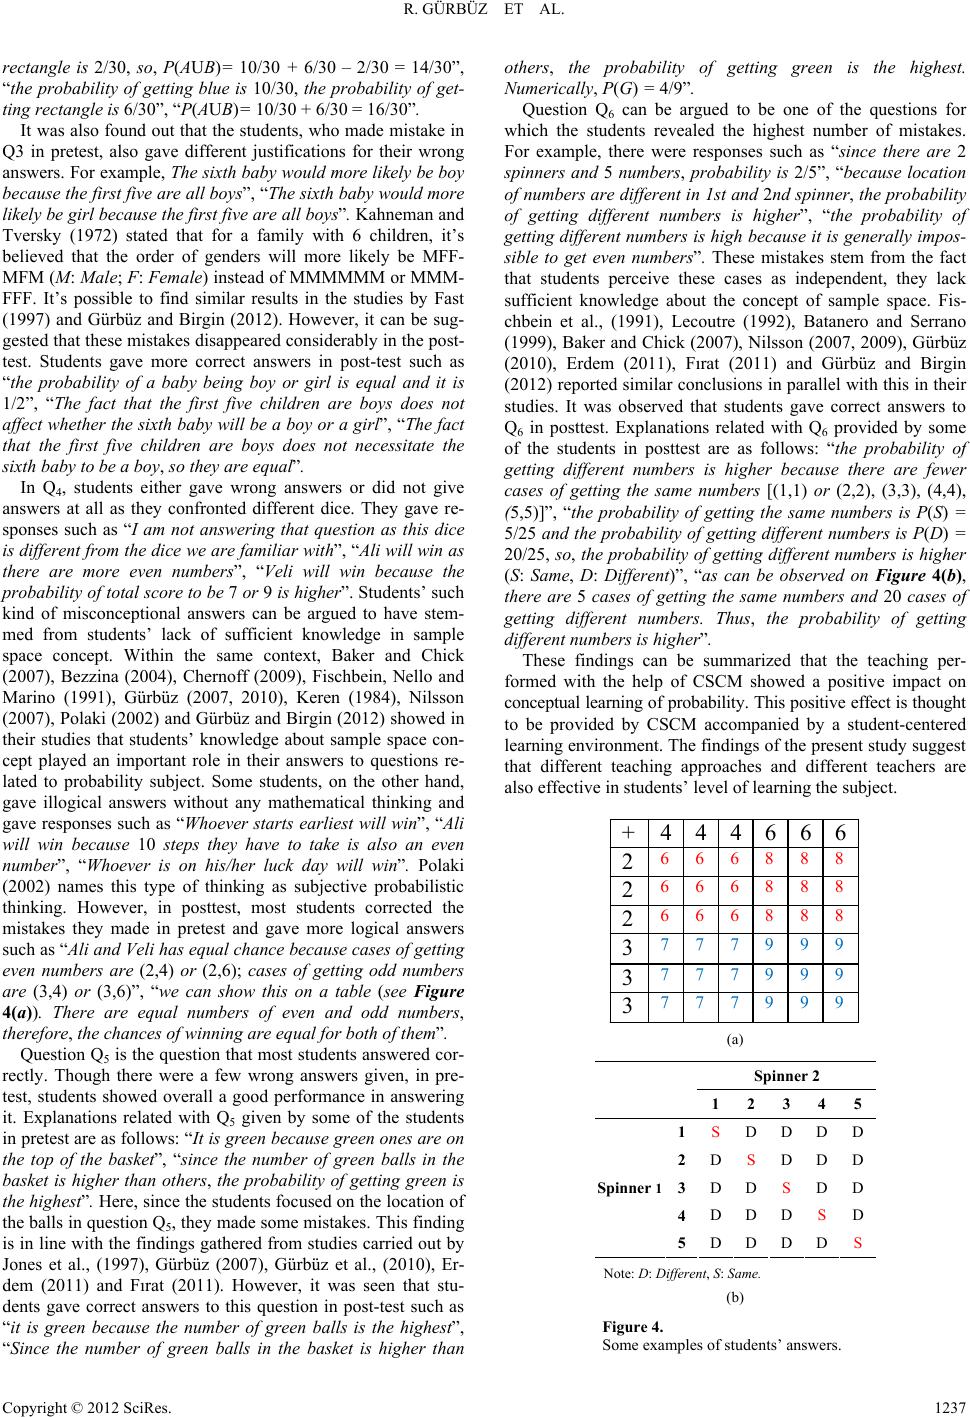 R. GÜRBÜZ ET AL. rectangle is 2/30, so, P(AUB)= 10/30 + 6/30 – 2/30 = 14/30”, “the probability of getting blue is 10/30, the probability of get- ting rectangle is 6/30”, “P(AUB)= 10/30 + 6/30 = 16/30”. It was also found out that the students, who made mistake in Q3 in pretest, also gave different justifications for their wrong answers. For example, The sixth baby would more likely be boy because the first five are all boys”, “The sixth baby would more likely be girl because the first five are all boys”. Kahneman and Tversky (1972) stated that for a family with 6 children, it’s believed that the order of genders will more likely be MFF- MFM (M: Male; F: Female) instead of MMMMMM or MMM- FFF. It’s possible to find similar results in the studies by Fast (1997) and Gürbüz and Birgin (2012). However, it can be sug- gested that these mistakes disappeared considerably in the post- test. Students gave more correct answers in post-test such as “the probability of a baby being boy or girl is equal and it is 1/2”, “The fact that the first five children are boys does not affect whether the sixth baby will be a boy or a girl”, “The fact that the first five children are boys does not necessitate the sixth baby to be a boy, so they are equal”. In Q4, students either gave wrong answers or did not give answers at all as they confronted different dice. They gave re- sponses such as “I am not answering that question as this dice is different from the dice we are familiar with”, “Ali will win as there are more even numbers”, “Veli will win because the probability of total score to be 7 or 9 is higher”. Students’ such kind of misconceptional answers can be argued to have stem- med from students’ lack of sufficient knowledge in sample space concept. Within the same context, Baker and Chick (2007), Bezzina (2004), Chernoff (2009), Fischbein, Nello and Marino (1991), Gürbüz (2007, 2010), Keren (1984), Nilsson (2007), Polaki (2002) and Gürbüz and Birgin (2012) showed in their studies that students’ knowledge about sample space con- cept played an important role in their answers to questions re- lated to probability subject. Some students, on the other hand, gave illogical answers without any mathematical thinking and gave responses such as “Whoever starts earliest will win”, “Ali will win because 10 steps they have to take is also an even number”, “Whoever is on his/her luck day will win”. Polaki (2002) names this type of thinking as subjective probabilistic thinking. However, in posttest, most students corrected the mistakes they made in pretest and gave more logical answers such as “Ali and Veli has equal chance because cases of getting even numbers are (2,4) or (2,6); cases of getting odd numbers are (3,4) or (3,6)”, “we can show this on a table (see Figure 4(a)). There are equal numbers of even and odd numbers, therefore, the chances of winning are equal for both of them”. Question Q5 is the question that most students answered cor- rectly. Though there were a few wrong answers given, in pre- test, students showed overall a good performance in answering it. Explanations related with Q5 given by some of the students in pretest are as follows: “It is green because green ones are on the top of the basket”, “since the number of green balls in the basket is higher than others, the probability of getting green is the highest”. Here, since the students focused on the location of the balls in question Q5, they made some mistakes. This finding is in line with the findings gathered from studies carried out by Jones et al., (1997), Gürbüz (2007), Gürbüz et al., (2010), Er- dem (2011) and Fırat (2011). However, it was seen that stu- dents gave correct answers to this question in post-test such as “it is green because the number of green balls is the highest”, “Since the number of green balls in the basket is higher than others, the probability of getting green is the highest. Numerically, P(G) = 4/9”. Question Q6 can be argued to be one of the questions for which the students revealed the highest number of mistakes. For example, there were responses such as “since there are 2 spinners and 5 numbers, probability is 2/5”, “because location of numbers are different in 1st and 2nd spinner, the probability of getting different numbers is higher”, “the probability of getting different numbers is high because it is generally impos- sible to get even numbers”. These mistakes stem from the fact that students perceive these cases as independent, they lack sufficient knowledge about the concept of sample space. Fis- chbein et al., (1991), Lecoutre (1992), Batanero and Serrano (1999), Baker and Chick (2007), Nilsson (2007, 2009), Gürbüz (2010), Erdem (2011), Fırat (2011) and Gürbüz and Birgin (2012) reported similar conclusions in parallel with this in their studies. It was observed that students gave correct answers to Q6 in posttest. Explanations related with Q6 provided by some of the students in posttest are as follows: “the probability of getting different numbers is higher because there are fewer cases of getting the same numbers [(1,1) or (2,2), (3,3), (4,4), (5,5)]”, “the probability of getting the same numbers is P(S) = 5/25 and the probability of getting different numbers is P(D) = 20/25, so, the probability of getting different numbers is higher (S: Same, D: Different)”, “as can be observed on Figure 4(b), there are 5 cases of getting the same numbers and 20 cases of getting different numbers. Thus, the probability of getting different numbers is higher”. These findings can be summarized that the teaching per- formed with the help of CSCM showed a positive impact on conceptual learning of probability. This positive effect is thought to be provided by CSCM accompanied by a student-centered learning environment. The findings of the present study suggest that different teaching approaches and different teachers are also effective in students’ level of learning the subject. +4 44 6 6 6 2 6 6 6 8 8 8 2 6 6 6 8 8 8 2 6 6 6 8 8 8 3 7 7 7 9 9 9 3 7 7 7 9 9 9 3 7 7 7 9 9 9 (a) Spinner 2 12 3 4 5 1SD D D D 2DS D D D 3DD S D D 4DD D S D Spinner 1 5D D D D S Note: D: Different, S: Same. (b) Figure 4. Some examples of students’ answers. Copyright © 2012 SciRes. 1237  R. GÜRBÜZ ET AL. General Discussion, Conclusion and Proposals In this research, we determined the effect of teaching mathe- matics performed with the help of CSCM on 7th graders’ con- ceptual learning of probability. From the findings, it may be suggested that the posttest scores of both groups show a sig- nificant increase when compared to the pretest results. Thus, both instructional methods can be argued to improve the stu- dents. Yet, when the improvements in the groups are compared it can be said that the intervention in the experimental group was more effective in terms of conceptual learning. When monitoring the students in the experimental group, it was ob- served that they enjoyed the process, were interactive, and had the opportunity to construct knowledge visually. These effects of CSCM on learning corresponded with the results of a great deal of studies (Anderson-Inman & Zeitz, 1993; Anderson- Inman et al., 1998; Simone et al., 2001; Chang et al., 2002; Stoyanova & Kommers, 2002; Brown, 2003; Baki & Mandaci- Şahin, 2004; Kwon & Cifuentes, 2009; Huang et al., 2012). Contributions of groups’ members to each other indicated that one of the other factors ensuring this process to be effective is cooperative learning strategy, because almost all positive effects of cooperative learning were effectively used during this process. During the instructions, it was seen that especially students whose learning motivations were low benefitted more from the process, through their partners. This result was in ac- cordance with previous studies (Stoyanova & Kommers, 2002; Brown, 2003; Kwon & Cifuentes, 2009) that discussed the positive effects of working with the CSCM in cooperative groups. Moreover, feedbacks given in the system depending on students’ answers enhanced the effectiveness of CSCM. In their study, Chang et al. (2001) referred to similar effect of feed- backs in CSCM environment. Furthermore, it could be claimed the fact that different teachers conducted the instructions in each group was also ef- fective in groups’ different level of learning probability subject. That teachers decided on which approach to employ during the process and that they used it effectively influenced students’ learning. Effective guidance by teacher (researcher) in experi- mental group, opportunities to talk and correct feedback given by researcher as much as possible, having students use CSCM effectively in cooperative groups and using dice, spinners and darts made the process effective. That the researcher followed the process in order to teach effectively could be explained by his/her professional competence. From this point of view, it can be stated that educatories’ professional competence is one of the other important factors affecting this process. In this sense, many previous academic studies (Shulman, 1986, 1987; Ball, 1988, 1990; Hill, Rowan, & Ball, 2005; Davis & Simmt, 2006; Tchoshanov, 2011) highlighted the importance of this compe- tence in order for performing effective instructions. Regarding suggestions for further research, it is advisable to look into what should be done for the students’ adaptation to work in CSCM. The effect of the CSCM on determining and remedying misconceptions should be investigated. These types of CSCM can be used as assessment tools besides teaching materials. By observing probability teaching process of differ- ent teachers (both through video-camera and participative ob- servation), approaches employed by them and their effects on learning could be compared. REFERENCES Anderson-Inman, L., & Zeitz, L. (1993). Computer-based concept mapping: Active studying for active learners. Computing Teacher, 21, 6-11. Anderson-Inman, L., & Horney, M. (1996). Computer-based concept mapping: Enhancing literacy with tools for visual thinking. Journal of Adolescent and Adult Literacy, 40, 302-306. Anderson-Inman, L., Ditson, L. A., & Ditson, M. T. (1998). Computer- based concept mapping: Promoting meaningful learning in science for students with disabilities. Information Technology and Disabi- lities, 5, 1-13. Anderson-Inman, L., & Ditson, L. (1999). Computer-based concept map- ping: A tool for negotiating meaning. Learning and Leading with Technology, 26, 6-13. Ayres, P., Sawyer. W., & Dinham, S. (2004). Effective teaching in the context of a grade 12 high-stakes external examination in new south wales, Australia. British Educational Research Journal, 30, 141-165. doi:10.1080/01411920310001630008 Baker, M., & Chick, H. L. (2007). Making the most of chance. Aus- tralian Primary Mathematics Classroom, 12, 8-13. Baki, A., & Mandaci-Şahin, S. (2004). Assessment of preservice tea- chers’ mathematical learning through computer aided concept map- ping method. TOJET, 3, 91-104. Ball, D. L. (1988). Knowledge and reasoning in mathematical peda- gogy: Examining what prospective teachers bring to teacher edu- cation. Unpublished Ph.D. Thesis, East Lansing, MI: Michigan State University. Ball, D. L. (1990). The mathematical understandings that prospective teachers bring to teacher education. Elementary School Journal, 90, 449-466. doi:10.1086/461626 Batanero, C., & Serrano, L. (1999). The meaning of randomness for secondary school students. Journal for Research in Mathematics Education, 30, 558-567. doi:10.2307/749774 Bezzina, F. (2004). Pupils’ understanding of probabilistic & statistics (14-15+) difficulties and insights for instruction. Journal of Maltese Education Research, 2, 53-67. Black, P., & Wiliam, D. (1998). Assessment and classroom learning. Assessment in Education, 5, 7-74. doi:10.1080/0969595980050102 Boaler, J. (1997). Experiencing school mathematics: Teaching styles, sex and setting. Buckingham: Open University Press. Brown, D. S. (2003). High school biology: A group approach to con- cept mapping. The American Biology Teacher, 65, 192-197. Chang, K. E., Sung, Y. T., & Chen, S. F. (2001). Learning through computer-based concept mapping with scaffolding aid. Journal of Computer Assisted Learning, 17, 21-33. Chang, K. E., Sung, Y. T., & Chen, I. D. (2002). The effect of concept mapping to enhance text comprehension and summarization. The Journal of Experiment Education, 71, 5-23. doi:10.1080/00220970209602054 Chernoff, E. J. (2009). Sample space partitions: An investigative lens. Journal of Mathematical Behavior, 28, 19-29. doi:10.1016/j.jmathb.2009.03.002 Chiu, C. H., & Hsiao, H. F. (2010). Group differences in computer supported collaborative learning: Evidence from patterns of Taiwanese students’ online communication. Computers & Education, 54, 427- 435. doi:10.1016/j.compedu.2009.08.026 Cohen, J. (1988). Statistical power analysis for the behavioral sciences. Hillsdale, NJ: Erlbaum. Davis, B., & Simmt, E. (2006). Mathematics-for-teaching: An ongoing investigation of the mathematics that teachers (need to) know. Edu- cational Studies in Mathematics, 61, 293-319. doi:10.1007/s10649-006-2372-4 Erdem, E. (2011). An investigation of the seventh grade students’ mathematical and probabilistic reasoning skills. Unpublished M.A. Thesis, Adıyaman: Adıyaman University. Even, R., & Kvatinsky, T. (2010). What mathematics do teachers with contrasting teaching approaches address in probability lessons? Edu- cational Studies in Mathematics, 74, 207-222. doi:10.1007/s10649-010-9234-9 Fast, G. (1997). Using analogies to overcome student teachers’ pro- bability misconceptions. Journal of Mathematical Behavior, 16, 325- 344. doi:10.1016/S0732-3123(97)90011-0 Fırat, S. (2011). The effect of mathematics teaching performed through Copyright © 2012 SciRes. 1238  R. GÜRBÜZ ET AL. Copyright © 2012 SciRes. 1239 educational computer games on conceptual learning. Unpublished M.A. Thesis, Adıyaman: Adıyaman University. Fischbein, E., Nello, M. S., & Marino, M. S. (1991). Factors affecting probabilistic judgements in children and adolescents. Educational Studies in Mathematics, 22, 523-549. doi:10.1007/BF00312714 Gürbüz, R. (2006a). Concept maps for the teaching of probability. 100th Year University Education Faculty Journal-Online, 3, 133- 151. Gürbüz, R. (2006b). Development of practice sheets for probability concept. Cukurova University Education Faculty Journal, 31, 111- 123. Gürbüz, R. (2007). The effects of computer aided instruction on stu- dents’ conceptual development: A case of probability subject. Eu- rasion Journal of Educational Research, 28, 75-87. Gürbüz, R. (2010). The effect of activity based instruction on con- ceptual development of seventh grade students in probability. In- ternational Journal of Mathematical Education in Science and Te- chnology, 41, 743-767. doi:10.1080/00207391003675158 Gürbüz, R., Çatlıoğlu, H., Birgin, O., & Erdem, E. (2010). An inves- tigation of fifth grade students’ conceptual development of proba- bility concepts based on activity based instruction: A quasi-expe- rimental study. Educational Sciences: Theory & Practice, 10, 1053- 1068. Gürbüz, R., & Birgin, O. (2012). The effect of computer-assisted tea- ching on remedying misconceptions: The case of the subject “prob- ability”. Computers & Education, 58, 931-941. doi:10.1016/j.compedu.2011.11.005 Gürbüz, R., Birgin, O., & Çatlıoğlu, H. (2012). Comparing the prob- ability-related misconceptions of pupils at different education levels. Croatian Journal of Education, 14, 307-357 Heinze-Fry, J. A., & Novak, J. D. (1990). Concept mapping brings long- term movement towards meaningful learning. Science Education, 74, 461-472. doi:10.1002/sce.3730740406 Hill, H. C., Rowan, B., & Ball, D. L. (2005). Effects of teachers’ math- ematical knowledge for teaching on student achievement. American Educational Research Journal, 42, 371-406. doi:10.3102/00028312042002371 Huang, H. S., Chiou, C. C., Chiang, H. K., Lai, S. H., Huang, C. Y., & Chou, Y. Y. (2012). Effects of multidimensional concept maps on fourth graders’ learning in web-based computer course. Computers & Education, 58, 863-873. doi:10.1016/j.compedu.2011.10.016 Johnson, D. W., & Johnson, R. T. (1989). Cooperation and competition (2nd ed.). Edina, MI: Interaction. Jonassen, D. H. (1996). Computer in the classroom: Mindtools for critical thinking. Eaglewoods, NJ: Merill/Prentice Hall. Jones, G. A., Langrall, C. W., Thornton, C. A., & Mogill, T. A. (1997). A framework for assessing and nurturing young children’s thinking in probability. Educational Studies in Mathematics, 32, 101-125. Kahneman, D., & Tversky, A. (1972). Subjective probability: A judg- ment of representativeness. Cognitive Psychology, 3, 430-454. doi:10.1016/0010-0285(72)90016-3 Kahneman, D. (2003). A perspective on judgment and choice: Mapping bounded rationality. American Psychologist, 58, 697-720. doi:10.1037/0003-066X.58.9.697 Keren, G. (1984). On the importance of identifying the correct “pro- blem space”. Cognition, 16, 121-128. doi:10.1016/0010-0277(84)90002-7 Kwon, S. Y., & Cifuentes, L. (2009). The comparative effect of in- dividually-constructed vs. collaboratively-constructed computer-based concept maps. Computers & Education, 52, 365-375. doi:10.1016/j.compedu.2008.09.012 Lecoutre, M. P. (1992). Cognitive models and problem spaces in “purely random” situations. Educational Studies in Mathematics, 23, 557-568. doi:10.1007/BF00540060 Ledesma, E. F. R. (2010). Using an interactive computer system to support the task of building the notions of ratio and proportion. Creative Education, 1, 115-120. doi:10.4236/ce.2010.12017 Matin, M. A. (2012). Interactive computer-centered instructions for science and engineering education. Creative Education, 3, 375-379. doi:10.4236/ce.2012.33059 Nilsson, P. (2007). Different ways in which students handle chance encounters in the explorative setting of a dice game. Educational Studies in Mathematics, 66, 293-315. doi:10.1007/s10649-006-9062-0 Nilsson. P. (2009). Conceptual variation and coordination in probability reasoning. Journal of Mathematical Behavior, 28, 247-261. doi:10.1016/j.jmathb.2009.10.003 Novak, J. D., & Gowin, B. (1984). Learning how to learn. New York: Cambridge University Press. doi:10.1017/CBO9781139173469 Novak, J. D., & Cañas, A. J. (2006). The origins of the concept mapping tool and the continuing evolution of the tool. Information Visualisation Journal, 5, 175-184. doi:10.1057/palgrave.ivs.9500126 Polaki, M. V. (2002). Using instruction to identify key features of basotho elementary students’ growth in probabilistic thinking. Ma- thematical Thinking and Learning, 4, 285-313. doi:10.1207/S15327833MTL0404_01 Pratt, D. (2000). Making sense of the total of two dice. Journal for Research in Mathematics Education, 31, 602-625. doi:10.2307/749889 Rautama, E. (2000). Extending the delivery of concept maps. AAPS project, ITiCSE. The 5th Annual Conference on Innovation and Technolology in Computer Science Education. Royer, R., & Royer, J. (2004). Comparing hand drawn and computer generated concept mapping. Journal of Computers in Mathematics and Science Teaching, 23, 67-81. Shulman, L. S. (1986). Those who understand: Knowledge growth in teaching. Educational Researcher, 15, 4-14. Shulman, L. S. (1987). Knowledge and teaching: Foundation of the new reform. Harvard Educational Review, 57, 1-22. Simone, C. D., Schmid, R. F., & McEwen, L. A. (2001). Supporting the learning process with collaborative concept mapping using com- puter-based communication tools and process. Educational Research and Evaluation, 7, 263-283 doi:10.1076/edre.7.2.263.3870 Slavin, R. E. (1987). Cooperative learning and cooperative school. Edu- cational Leadership, 45, 7-13. Slavin, R. (1996). Research on cooperative learning and achievement: What we know, what we need to know. Contemporary Educational Psychology, 21, 43-69. doi:10.1006/ceps.1996.0004 Stoyanova, N., & Kommers, P. (2002). Concept mapping as a medium of shared cognition in computer-supported collaborative problem solving. Journal of Interactive Learning Research, 13, 111-133. Sturm, J. M., & Rankin-Erickson, J. L. (2002). Effects of hand-drawn and computer-generated concept mapping on the expository writing of middle students with learning disabilities. Learning Disabilities Research & Practice, 17, 124-139. doi:10.1111/1540-5826.00039 Tchoshanov, M. A. (2011). Relationship between teacher knowledge of concepts and connections, teaching practice, and student achieve- ment in middle grades mathematics. Educational Studies in Math- ematics, 76, 141-164. doi:10.1007/s10649-010-9269-y Tsai, C. C., Lin, S. S. J., & Yuan, S. M. (2001). Students’ use of web- based concept map testing and strategies for learning. Journal of Computer Assisted Learning, 17, 72-84. doi:10.1111/j.1365-2729.2001.00160.x Willerman, M., & Harg, R. A. (1991). The concept map as an advance organizer. Journal of Research in Science Teaching, 28, 705-711. Yavuz, A. (2005). Effectiveness of conceptual change instruction ac- companied with demonstrations and computer assisted concept mapping on students’ understanding of matter concepts. Ph.D. The- sis, Ankara: Middle East Technical University. doi:10.1002/tea.3660280807 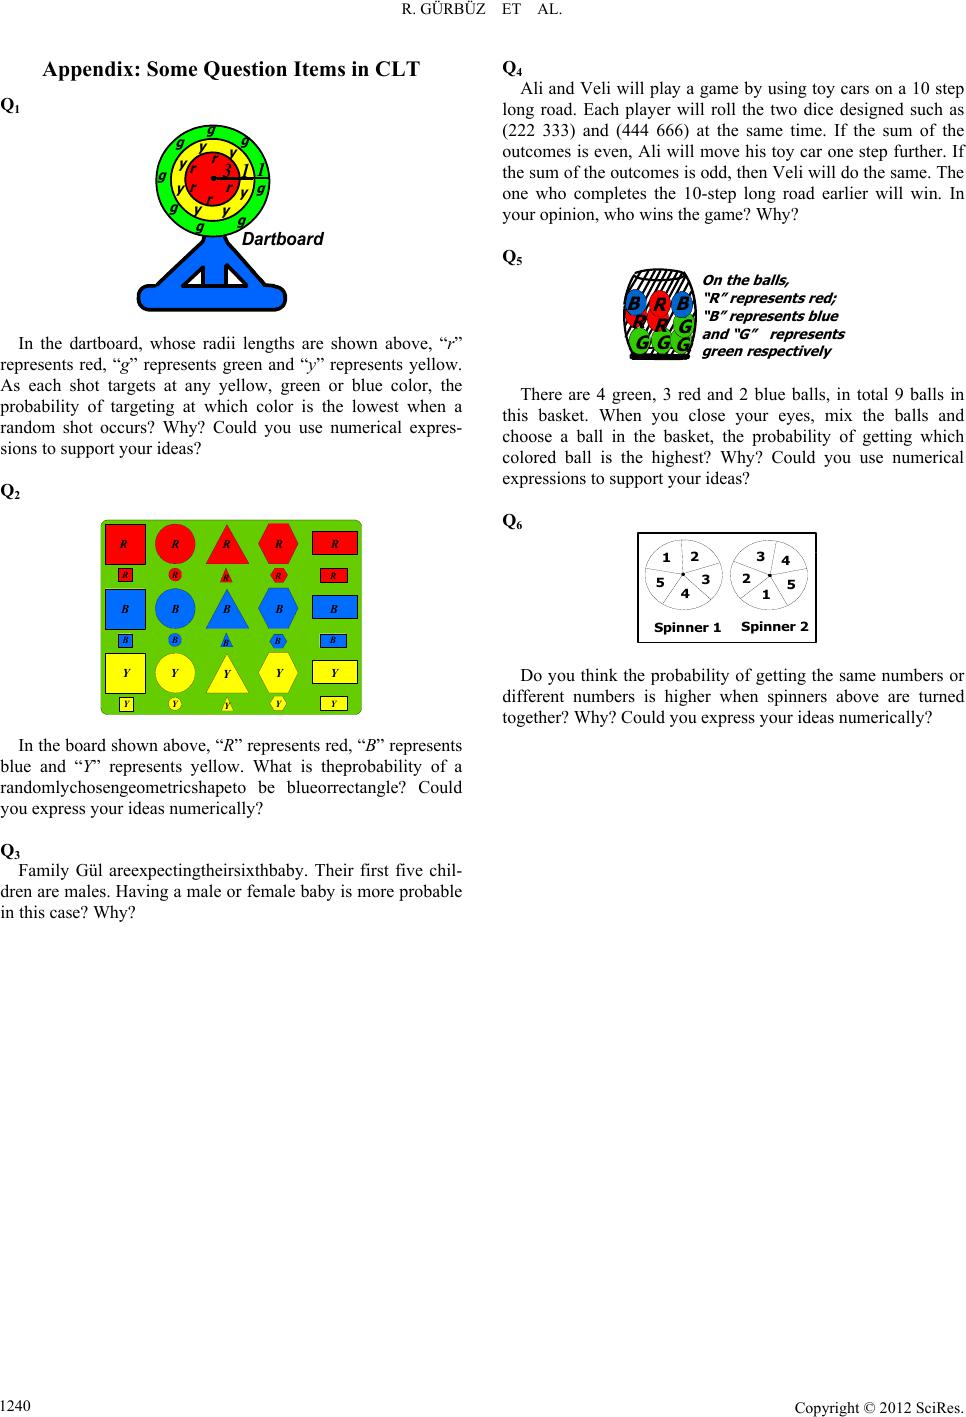 R. GÜRBÜZ ET AL. Appendix: Some Question Items in CLT Q1 Dartboard 1 gg r rr g g gg g g r r 13 yy y y y y y In the dartboard, whose radii lengths are shown above, “r” represents red, “g” represents green and “y” represents yellow. As each shot targets at any yellow, green or blue color, the probability of targeting at which color is the lowest when a random shot occurs? Why? Could you use numerical expres- sions to support your ideas? Q2 RRRRR BBBBB RRRR BB BBB YY YYY YYYYY R In the board shown above, “R” represents red, “B” represents blue and “Y” represents yellow. What is theprobability of a randomlychosengeometricshapeto be blueorrectangle? Could you express your ideas numerically? Q3 Family Gül areexpectingtheirsixthbaby. Their first five chil- dren are males. Having a male or female baby is more probable in this case? Why? Q4 Ali and Veli will play a game by using toy cars on a 10 step long road. Each player will roll the two dice designed such as (222 333) and (444 666) at the same time. If the sum of the outcomes is even, Ali will move his toy car one step further. If the sum of the outcomes is odd, then Veli will do the same. The one who completes the 10-step long road earlier will win. In your opinion, who wins the game? Why? Q5 On the balls, “R” r epres ents re d “B” repr esents bl u and “G” re pr esents reen res ectivel There are 4 green, 3 red and 2 blue balls, in total 9 balls in this basket. When you close your eyes, mix the balls and choose a ball in the basket, the probability of getting which colored ball is the highest? Why? Could you use numerical expressions to support your ideas? Q6 12 3 4 5 Spinner 1Spinner 2 4 1 2 3 5 Do you think the probability of getting the same numbers or different numbers is higher when spinners above are turned together? Why? Could you express your ideas numerically? Copyright © 2012 SciRes. 1240
|