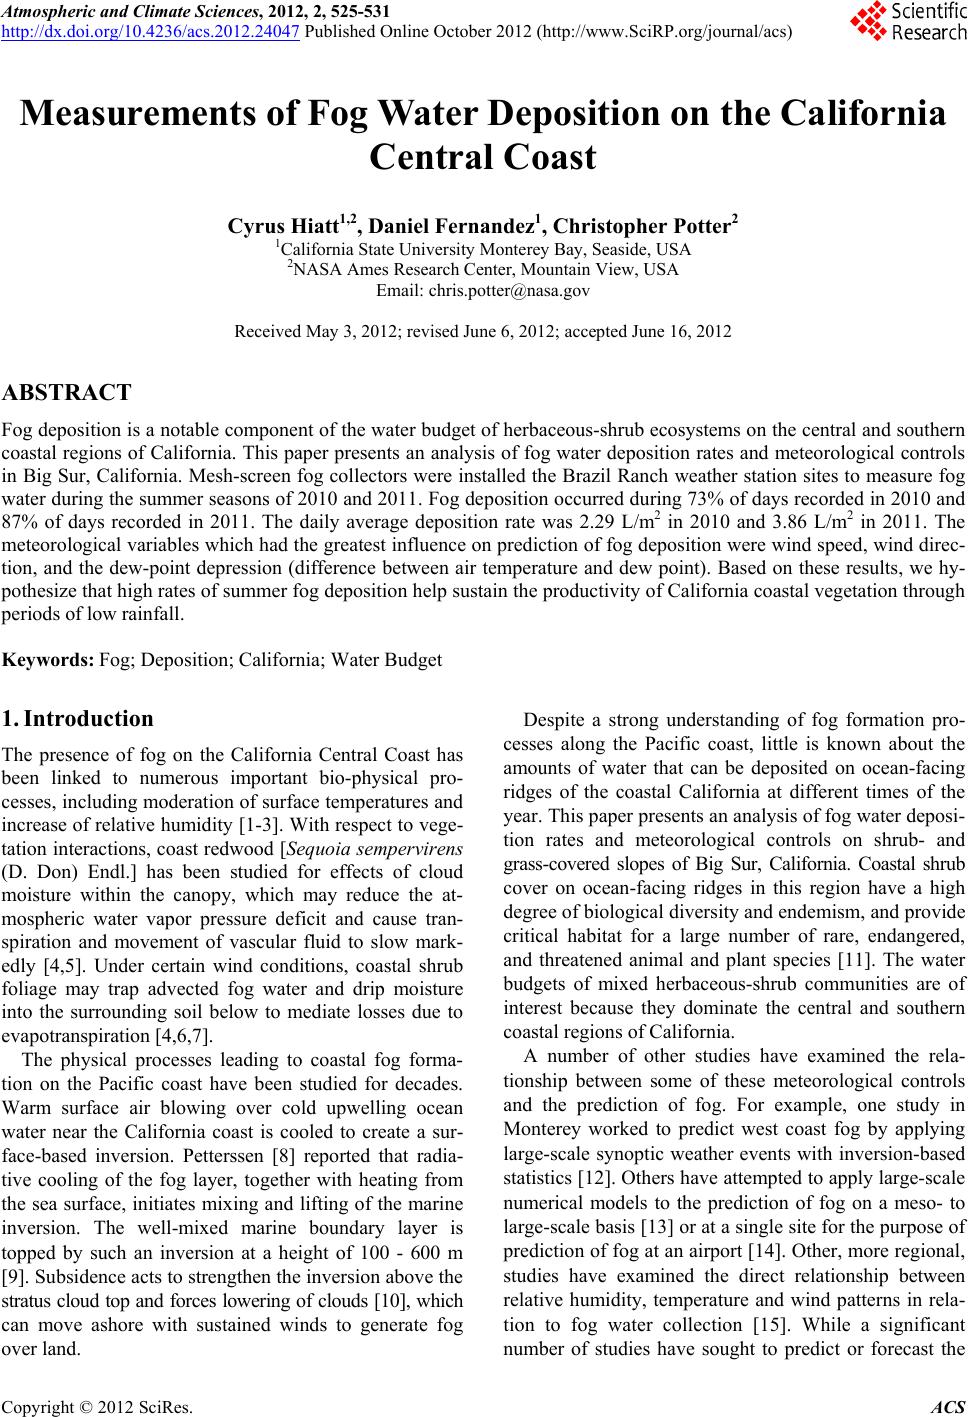
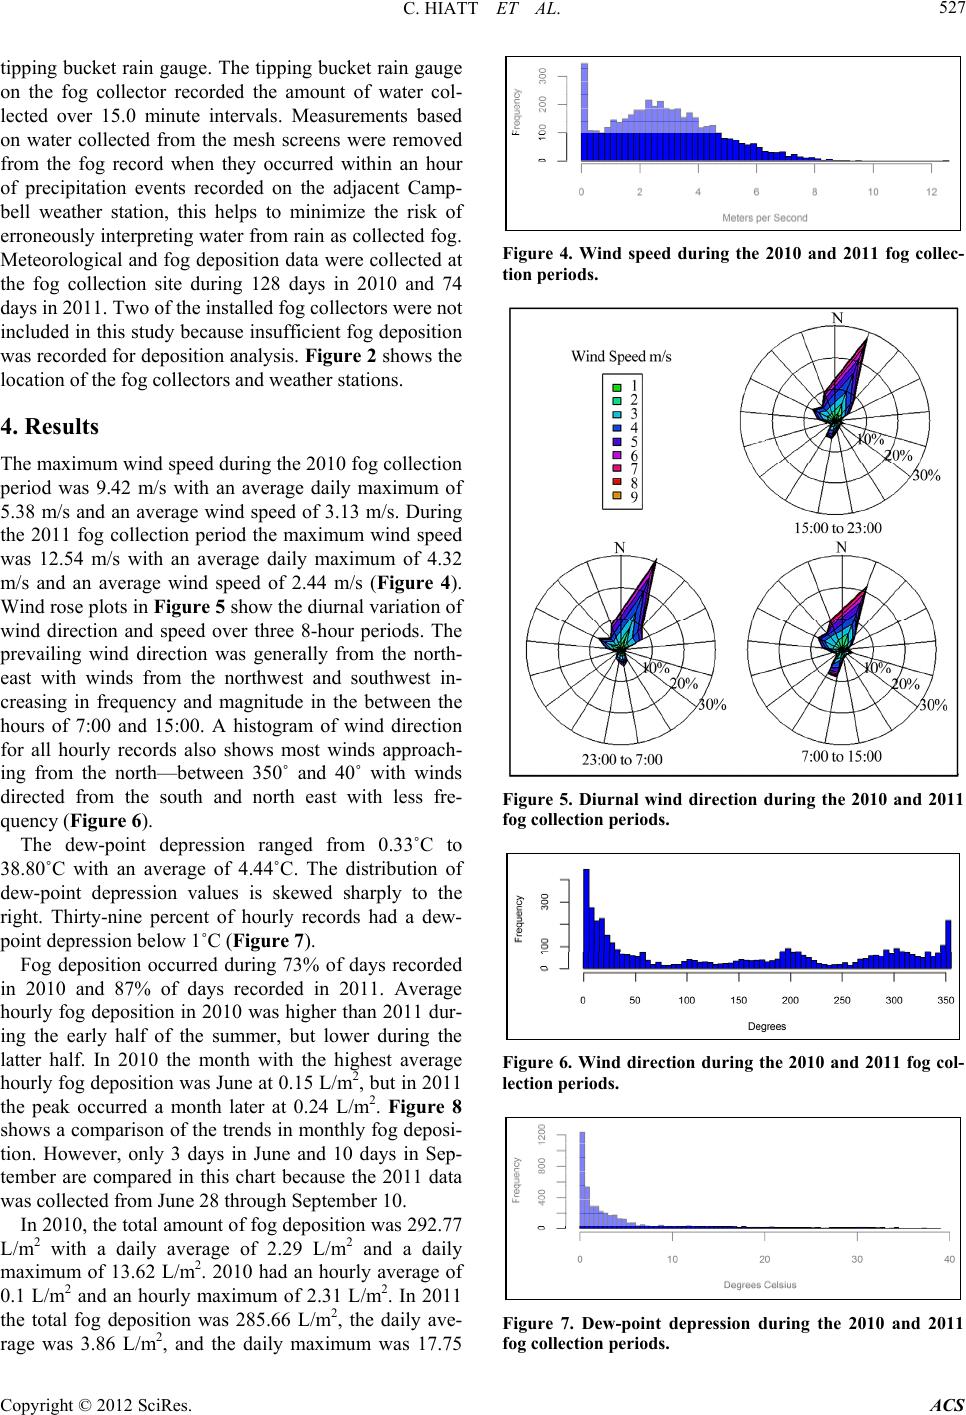
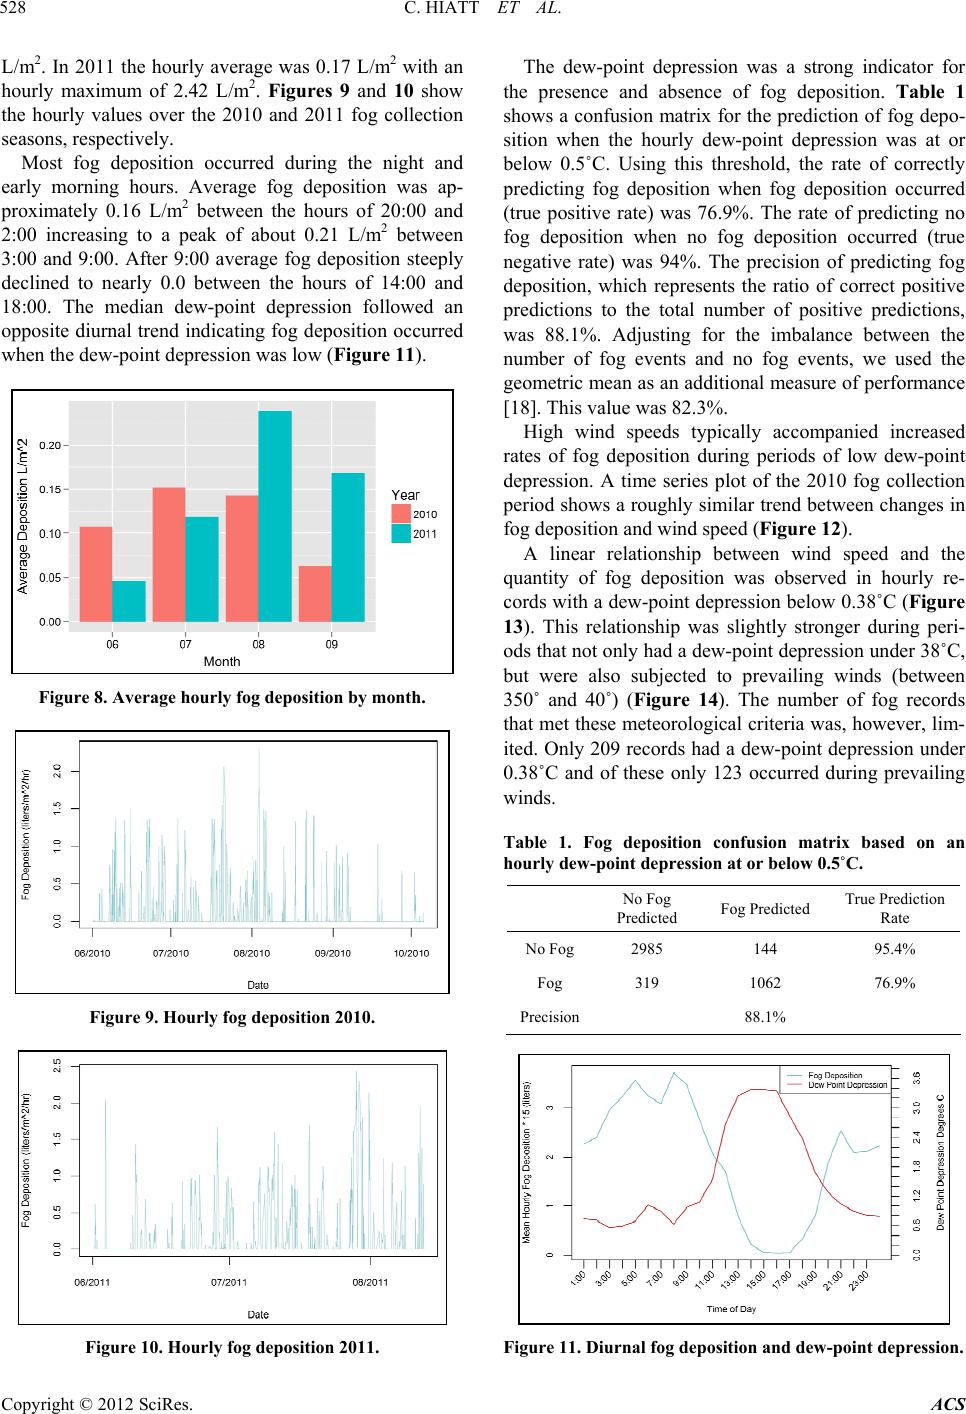
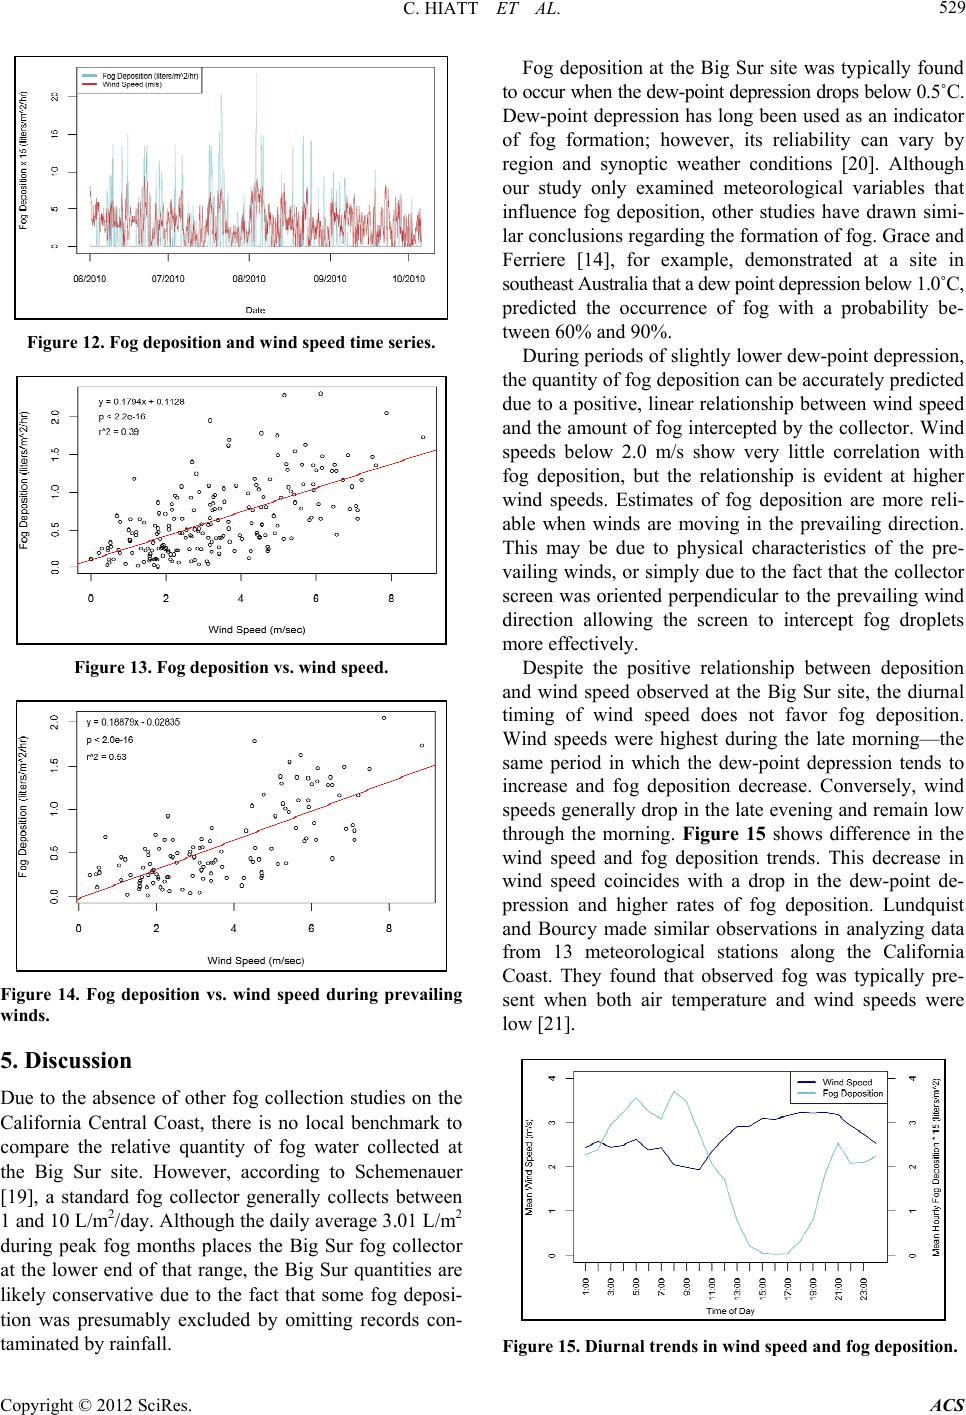
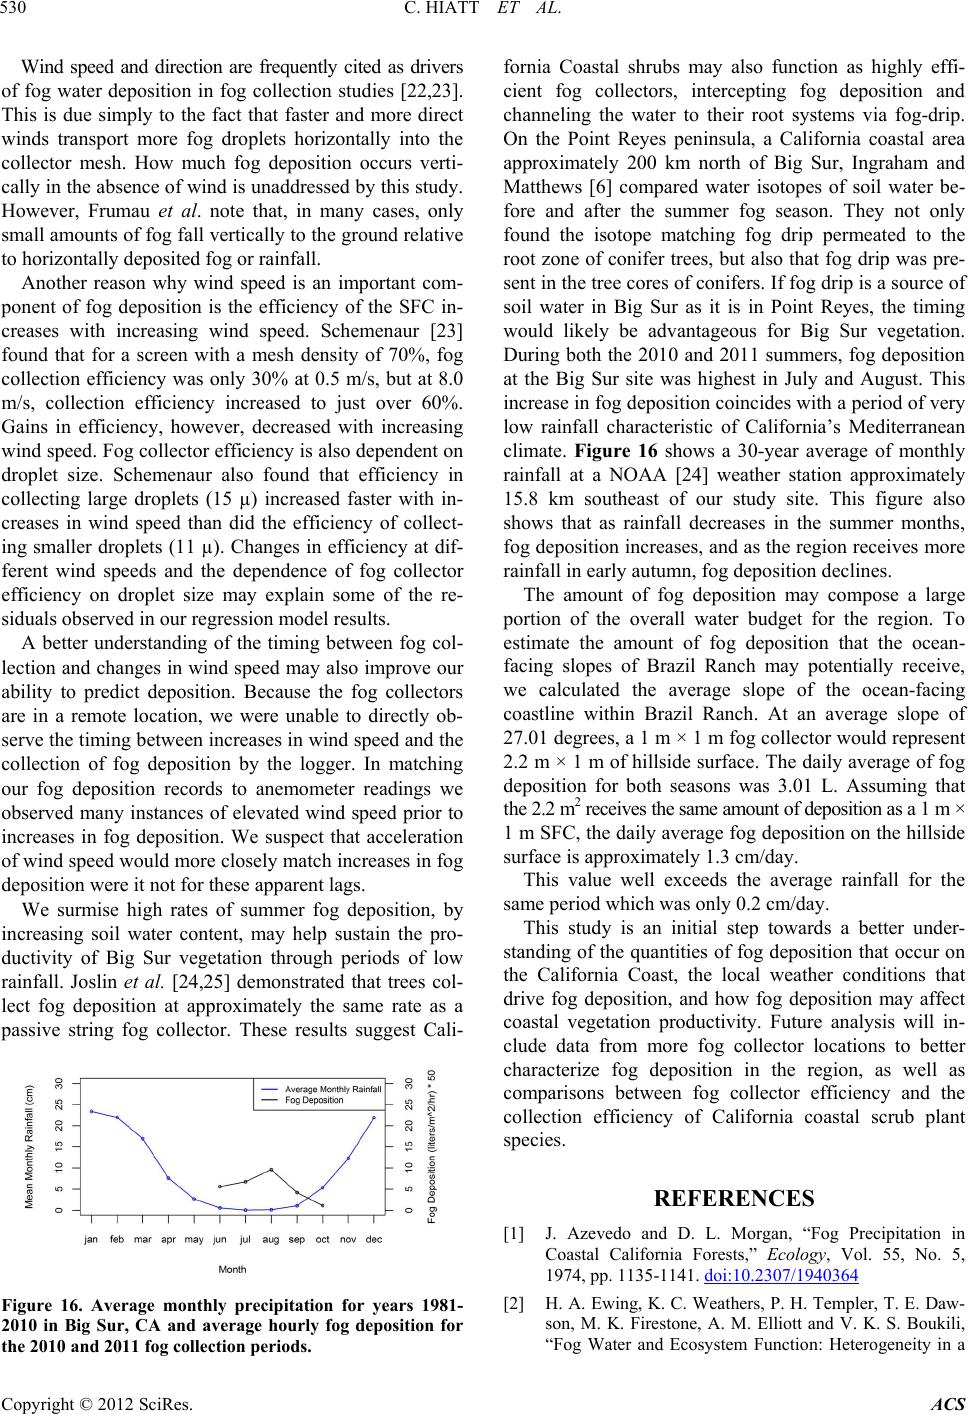
Atmospheric and Climate Sciences, 2012, 2, 525-531
http://dx.doi.org/10.4236/acs.2012.24047 Published Online October 2012 (http://www.SciRP.org/journal/acs)
Measurements of Fog Water Deposition on the California
Central Coast
Cyrus Hiatt1,2, Daniel Fernandez1, Christopher Potter2
1California State University Monterey Bay, Seaside, USA
2NASA Ames Research Center, Mountain View, USA
Email: chris.potter@nasa.gov
Received May 3, 2012; revised June 6, 2012; accepted June 16, 2012
ABSTRACT
Fog deposition is a notable component of the water budget of herbaceous-shrub ecosystems on the central and southern
coastal regions of California. This paper presents an analysis of fog water deposition rates and meteorological controls
in Big Sur, California. Mesh-screen fog collectors were installed the Brazil Ranch weather station sites to measure fog
water during the summer seasons of 2010 and 2011. Fog deposition occurred during 73% of days recorded in 2010 and
87% of days recorded in 2011. The daily average deposition rate was 2.29 L/m2 in 2010 and 3.86 L/m2 in 2011. The
meteorological variables which had the greatest influence on prediction of fog deposition were wind speed, wind direc-
tion, and the dew-point depression (difference between air temperature and dew point). Based on these results, we hy-
pothesize that high rates of summer fog deposition help sustain the productivity of California coastal vegetation through
periods of low rainfall.
Keywords: Fog; Deposition; California; Water Budget
1. Introduction
The presence of fog on the California Central Coast has
been linked to numerous important bio-physical pro-
cesses, including moderation of surface temperatures and
increase of relative humidity [1-3]. With respect to vege-
tation interactions, coast redwood [Sequoia sempervirens
(D. Don) Endl.] has been studied for effects of cloud
moisture within the canopy, which may reduce the at-
mospheric water vapor pressure deficit and cause tran-
spiration and movement of vascular fluid to slow mark-
edly [4,5]. Under certain wind conditions, coastal shrub
foliage may trap advected fog water and drip moisture
into the surrounding soil below to mediate losses due to
evapotranspiration [4,6,7].
The physical processes leading to coastal fog forma-
tion on the Pacific coast have been studied for decades.
Warm surface air blowing over cold upwelling ocean
water near the California coast is cooled to create a sur-
face-based inversion. Petterssen [8] reported that radia-
tive cooling of the fog layer, together with heating from
the sea surface, initiates mixing and lifting of the marine
inversion. The well-mixed marine boundary layer is
topped by such an inversion at a height of 100 - 600 m
[9]. Subsidence acts to strengthen the inversion above the
stratus cloud top and forces lowering of clouds [10], which
can move ashore with sustained winds to generate fog
over land.
Despite a strong understanding of fog formation pro-
cesses along the Pacific coast, little is known about the
amounts of water that can be deposited on ocean-facing
ridges of the coastal California at different times of the
year. This paper presents an analysis of fog water deposi-
tion rates and meteorological controls on shrub- and
grass-covered slopes of Big Sur, California. Coastal shrub
cover on ocean-facing ridges in this region have a high
degree of biological diversity and endemism, and provide
critical habitat for a large number of rare, endangered,
and threatened animal and plant species [11]. The water
budgets of mixed herbaceous-shrub communities are of
interest because they dominate the central and southern
coastal regions of California.
A number of other studies have examined the rela-
tionship between some of these meteorological controls
and the prediction of fog. For example, one study in
Monterey worked to predict west coast fog by applying
large-scale synoptic weather events with inversion-based
statistics [12]. Others have attempted to apply large-scale
numerical models to the prediction of fog on a meso- to
large-scale basis [13] or at a single site for the purpose of
prediction of fog at an airport [14]. Other, more regional,
studies have examined the direct relationship between
relative humidity, temperature and wind patterns in rela-
tion to fog water collection [15]. While a significant
number of studies have sought to predict or forecast the
C
opyright © 2012 SciRes. ACS
C. HIATT ET AL.
526
occurence of fog based on apriori conditions, relatively
few have examined the relationships between fog and
existing meteorological conditions with the intention to
determine valid proxies for fog deposition water to the
land surface. The objective of this study was to under-
stand and quantify the meteorological controls, namely
temperature, dew point, wind speed, direction, and rela-
tive humidity, on fog water deposition rates for the
coastal grassland and shrublands of central California
using measurements collected over two field seasons.
2. Study Site
The primary research site is located at the Brazil Ranch
(center coordinates: latitude 36.35˚N, longitude 121.88˚
W) near Big Sur, California (Figure 1). The Brazil
Ranch is named after Tony and Margaret Brazil and the
pioneer family that worked to establish the land as a farm,
ranch, as well as a dairy operation in the early 20th cen-
tury. Today, the property serves as a primary research
site for the US Forest Service to monitor and manage
vegetation, wildlife, water quality, and sensitive coastal
habitats.
Drier, southeast-facing slopes share a relatively equal
distribution of coyote bush (Baccharis pilularis) and
California coffeeberry (Rhamnus californica) along with
some California sagebrush (Artemisia californica) [16].
The coastal scrub community is usually a successional
plant community that, in the absence of fire, gradually
moves into herbaceous cover where the soil depth transi-
tions from the shallowest to intermediate depth. The
herbaceous plant community includes California annual
grassland series and California oatgrass series. Coastal
sage scrub and chaparral are known as secondary pioneer
plant in California grasslands, which invade grassland
and increase in the absence of fire or grazing. We noted a
propagation of the introduced Cape ivy (Delairea odo-
rata) during our field work. Cape ivy, a vine native to
South Africa, has become a significant threat to coastal scrub.
3. Data and Methods
Two Campbell weather stations, each equipped with a
Figure 1. Study site.
CR800 data logger, a 03001 R.M. Young Wind Sentry
Set, and an HMP45C Temperature and Relative Humi-
dity Probe were installed at the Brazil Ranch in 2007
(Figure 2). The on-going hourly meteorological data
collection included air temperature, humidity, wind
speed and direction, solar irradiance, and precipitation
(as rainfall).
Mesh-screen fog collectors were installed at the Brazil
Ranch weather station sites in June 2010 (Figure 2). The
fog collector design (also called a Standard Fog Collector,
or SFC) is a polypropylene mesh (triangular weave of
flat fiber, 1 mm wide and 0.1 mm thick) fastened to a
metal 1 × 1 meter vertical frame [17] (Figure 3). A metal
trough directly under the frame collected water that
dripped from the mesh and funneled the water flow to a
Figure 2. Fog collector locations.
Figure 3. Standard fog collector.
Copyright © 2012 SciRes. ACS
C. HIATT ET AL. 527
tipping bucket rain gauge. The tipping bucket rain gauge
on the fog collector recorded the amount of water col-
lected over 15.0 minute intervals. Measurements based
on water collected from the mesh screens were removed
from the fog record when they occurred within an hour
of precipitation events recorded on the adjacent Camp-
bell weather station, this helps to minimize the risk of
erroneously interpreting water from rain as collected fog.
Meteorological and fog deposition data were collected at
the fog collection site during 128 days in 2010 and 74
days in 2011. Two of the installed fog collectors were not
included in this study because insufficient fog deposition
was recorded for deposition analysis. Figure 2 shows the
location of the fog collectors and weather stations.
4. Results
The maximum wind speed during the 2010 fog collection
period was 9.42 m/s with an average daily maximum of
5.38 m/s and an average wind speed of 3.13 m/s. During
the 2011 fog collection period the maximum wind speed
was 12.54 m/s with an average daily maximum of 4.32
m/s and an average wind speed of 2.44 m/s (Figure 4).
Wind rose plots in Figure 5 show the diurnal variation of
wind direction and speed over three 8-hour periods. The
prevailing wind direction was generally from the north-
east with winds from the northwest and southwest in-
creasing in frequency and magnitude in the between the
hours of 7:00 and 15:00. A histogram of wind direction
for all hourly records also shows most winds approach-
ing from the north—between 350˚ and 40˚ with winds
directed from the south and north east with less fre-
quency (Figure 6).
The dew-point depression ranged from 0.33˚C to
38.80˚C with an average of 4.44˚C. The distribution of
dew-point depression values is skewed sharply to the
right. Thirty-nine percent of hourly records had a dew-
point depression below 1˚C (Figure 7).
Fog deposition occurred during 73% of days recorded
in 2010 and 87% of days recorded in 2011. Average
hourly fog deposition in 2010 was higher than 2011 dur-
ing the early half of the summer, but lower during the
latter half. In 2010 the month with the highest average
hourly fog deposition was June at 0.15 L/m2, but in 2011
the peak occurred a month later at 0.24 L/m2. Figure 8
shows a comparison of the trends in monthly fog deposi-
tion. However, only 3 days in June and 10 days in Sep-
tember are compared in this chart because the 2011 data
was collected from June 28 through September 10.
In 2010, the total amount of fog deposition was 292.77
L/m2 with a daily average of 2.29 L/m2 and a daily
maximum of 13.62 L/m2. 2010 had an hourly average of
0.1 L/m2 and an hourly maximum of 2.31 L/m2. In 2011
the total fog deposition was 285.66 L/m2, the daily ave-
rage was 3.86 L/m2, and the daily maximum was 17.75
Figure 4. Wind speed during the 2010 and 2011 fog collec-
tion periods.
Figure 5. Diurnal wind direction during the 2010 and 2011
fog collection periods.
Figure 6. Wind direction during the 2010 and 2011 fog col-
lection periods.
Figure 7. Dew-point depression during the 2010 and 2011
fog collection periods.
Copyright © 2012 SciRes. ACS
C. HIATT ET AL.
528
L/m2. In 2011 the hourly average was 0.17 L/m2 with an
hourly maximum of 2.42 L/m2. Figures 9 and 10 show
the hourly values over the 2010 and 2011 fog collection
seasons, respectively.
Most fog deposition occurred during the night and
early morning hours. Average fog deposition was ap-
proximately 0.16 L/m2 between the hours of 20:00 and
2:00 increasing to a peak of about 0.21 L/m2 between
3:00 and 9:00. After 9:00 average fog deposition steeply
declined to nearly 0.0 between the hours of 14:00 and
18:00. The median dew-point depression followed an
opposite diurnal trend indicating fog deposition occurred
when the dew-point depression was low (Figure 11).
Figure 8. Average hourly fog deposition by month.
Figure 9. Hourly fog deposition 2010.
Figure 10. Hourly fog deposition 2011.
The dew-point depression was a strong indicator for
the presence and absence of fog deposition. Table 1
shows a confusion matrix for the prediction of fog depo-
sition when the hourly dew-point depression was at or
below 0.5˚C. Using this threshold, the rate of correctly
predicting fog deposition when fog deposition occurred
(true positive rate) was 76.9%. The rate of predicting no
fog deposition when no fog deposition occurred (true
negative rate) was 94%. The precision of predicting fog
deposition, which represents the ratio of correct positive
predictions to the total number of positive predictions,
was 88.1%. Adjusting for the imbalance between the
number of fog events and no fog events, we used the
geometric mean as an additional measure of performance
[18]. This value was 82.3%.
High wind speeds typically accompanied increased
rates of fog deposition during periods of low dew-point
depression. A time series plot of the 2010 fog collection
period shows a roughly similar trend between changes in
fog deposition and wind speed (Figure 12).
A linear relationship between wind speed and the
quantity of fog deposition was observed in hourly re-
cords with a dew-point depression below 0.38˚C (Figure
13). This relationship was slightly stronger during peri-
ods that not only had a dew-point depression under 38˚C,
but were also subjected to prevailing winds (between
350˚ and 40˚) (Figure 14). The number of fog records
that met these meteorological criteria was, however, lim-
ited. Only 209 records had a dew-point depression under
0.38˚C and of these only 123 occurred during prevailing
winds.
Table 1. Fog deposition confusion matrix based on an
hourly dew-point depr e ssion at or below 0.5˚C.
No Fog
Predicted Fog Predicted True Prediction
Rate
No Fog 2985 144 95.4%
Fog 319 1062 76.9%
Precision 88.1%
Figure 11. Diurnal fog deposition and dew - point de pression.
Copyright © 2012 SciRes. ACS
C. HIATT ET AL. 529
Figure 12. Fog deposition and wind speed time series.
Figure 13. Fog deposition vs. wind speed.
Figure 14. Fog deposition vs. wind speed during prevailing
winds.
5. Discussion
Due to the absence of other fog collection studies on the
California Central Coast, there is no local benchmark to
compare the relative quantity of fog water collected at
the Big Sur site. However, according to Schemenauer
[19], a standard fog collector generally collects between
1 and 10 L/m2/day. Although the daily average 3.01 L/m2
during peak fog months places the Big Sur fog collector
at the lower end of that range, the Big Sur quantities are
likely conservative due to the fact that some fog deposi-
tion was presumably excluded by omitting records con-
taminated by rainfall.
Fog deposition at the Big Sur site was typically found
to occur when the dew-point depression drops below 0.5˚C.
Dew-point depression has long been used as an indicator
of fog formation; however, its reliability can vary by
region and synoptic weather conditions [20]. Although
our study only examined meteorological variables that
influence fog deposition, other studies have drawn simi-
lar conclusions regarding the formation of fog. Grace and
Ferriere [14], for example, demonstrated at a site in
southeast Australia that a dew point depression below 1.0˚C,
predicted the occurrence of fog with a probability be-
tween 60% and 90%.
During periods of slightly lower dew-point depression,
the quantity of fog deposition can be accurately predicted
due to a positive, linear relationship between wind speed
and the amount of fog intercepted by the collector. Wind
speeds below 2.0 m/s show very little correlation with
fog deposition, but the relationship is evident at higher
wind speeds. Estimates of fog deposition are more reli-
able when winds are moving in the prevailing direction.
This may be due to physical characteristics of the pre-
vailing winds, or simply due to the fact that the collector
screen was oriented perpendicular to the prevailing wind
direction allowing the screen to intercept fog droplets
more effectively.
Despite the positive relationship between deposition
and wind speed observed at the Big Sur site, the diurnal
timing of wind speed does not favor fog deposition.
Wind speeds were highest during the late morning—the
same period in which the dew-point depression tends to
increase and fog deposition decrease. Conversely, wind
speeds generally drop in the late evening and remain low
through the morning. Figure 15 shows difference in the
wind speed and fog deposition trends. This decrease in
wind speed coincides with a drop in the dew-point de-
pression and higher rates of fog deposition. Lundquist
and Bourcy made similar observations in analyzing data
from 13 meteorological stations along the California
Coast. They found that observed fog was typically pre-
sent when both air temperature and wind speeds were
low [21].
Figure 15. Diurnal trends in wind speed and fog deposition.
Copyright © 2012 SciRes. ACS
C. HIATT ET AL.
530
Wind speed and direction are frequently cited as drivers
of fog water deposition in fog collection studies [22,23].
This is due simply to the fact that faster and more direct
winds transport more fog droplets horizontally into the
collector mesh. How much fog deposition occurs verti-
cally in the absence of wind is unaddressed by this study.
However, Frumau et al. note that, in many cases, only
small amounts of fog fall vertically to the ground relative
to horizontally deposited fog or rainfall.
Another reason why wind speed is an important com-
ponent of fog deposition is the efficiency of the SFC in-
creases with increasing wind speed. Schemenaur [23]
found that for a screen with a mesh density of 70%, fog
collection efficiency was only 30% at 0.5 m/s, but at 8.0
m/s, collection efficiency increased to just over 60%.
Gains in efficiency, however, decreased with increasing
wind speed. Fog collector efficiency is also dependent on
droplet size. Schemenaur also found that efficiency in
collecting large droplets (15 µ) increased faster with in-
creases in wind speed than did the efficiency of collect-
ing smaller droplets (11 µ). Changes in efficiency at dif-
ferent wind speeds and the dependence of fog collector
efficiency on droplet size may explain some of the re-
siduals observed in our regression model results.
A better understanding of the timing between fog col-
lection and changes in wind speed may also improve our
ability to predict deposition. Because the fog collectors
are in a remote location, we were unable to directly ob-
serve the timing between increases in wind speed and the
collection of fog deposition by the logger. In matching
our fog deposition records to anemometer readings we
observed many instances of elevated wind speed prior to
increases in fog deposition. We suspect that acceleration
of wind speed would more closely match increases in fog
deposition were it not for these apparent lags.
We surmise high rates of summer fog deposition, by
increasing soil water content, may help sustain the pro-
ductivity of Big Sur vegetation through periods of low
rainfall. Joslin et al. [24,25] demonstrated that trees col-
lect fog deposition at approximately the same rate as a
passive string fog collector. These results suggest Cali-
Figure 16. Average monthly precipitation for years 1981-
2010 in Big Sur, CA and average hourly fog deposition for
the 2010 and 2011 fog collection periods.
fornia Coastal shrubs may also function as highly effi-
cient fog collectors, intercepting fog deposition and
channeling the water to their root systems via fog-drip.
On the Point Reyes peninsula, a California coastal area
approximately 200 km north of Big Sur, Ingraham and
Matthews [6] compared water isotopes of soil water be-
fore and after the summer fog season. They not only
found the isotope matching fog drip permeated to the
root zone of conifer trees, but also that fog drip was pre-
sent in the tree cores of conifers. If fog drip is a source of
soil water in Big Sur as it is in Point Reyes, the timing
would likely be advantageous for Big Sur vegetation.
During both the 2010 and 2011 summers, fog deposition
at the Big Sur site was highest in July and August. This
increase in fog deposition coincides with a period of very
low rainfall characteristic of California’s Mediterranean
climate. Figure 16 shows a 30-year average of monthly
rainfall at a NOAA [24] weather station approximately
15.8 km southeast of our study site. This figure also
shows that as rainfall decreases in the summer months,
fog deposition increases, and as the region receives more
rainfall in early autumn, fog deposition declines.
The amount of fog deposition may compose a large
portion of the overall water budget for the region. To
estimate the amount of fog deposition that the ocean-
facing slopes of Brazil Ranch may potentially receive,
we calculated the average slope of the ocean-facing
coastline within Brazil Ranch. At an average slope of
27.01 degrees, a 1 m × 1 m fog collector would represent
2.2 m × 1 m of hillside surface. The daily average of fog
deposition for both seasons was 3.01 L. Assuming that
the 2.2 m2 receives the same amount of deposition as a 1 m ×
1 m SFC, the daily average fog deposition on the hillside
surface is approximately 1.3 cm/day.
This value well exceeds the average rainfall for the
same period which was only 0.2 cm/day.
This study is an initial step towards a better under-
standing of the quantities of fog deposition that occur on
the California Coast, the local weather conditions that
drive fog deposition, and how fog deposition may affect
coastal vegetation productivity. Future analysis will in-
clude data from more fog collector locations to better
characterize fog deposition in the region, as well as
comparisons between fog collector efficiency and the
collection efficiency of California coastal scrub plant
species.
REFERENCES
[1] J. Azevedo and D. L. Morgan, “Fog Precipitation in
Coastal California Forests,” Ecology, Vol. 55, No. 5,
1974, pp. 1135-1141. doi:10.2307/1940364
[2] H. A. Ewing, K. C. Weathers, P. H. Templer, T. E. Daw-
son, M. K. Firestone, A. M. Elliott and V. K. S. Boukili,
“Fog Water and Ecosystem Function: Heterogeneity in a
Copyright © 2012 SciRes. ACS
C. HIATT ET AL.
Copyright © 2012 SciRes. ACS
531
California Redwood Forest,” Ecosystems, Vol. 12, No. 3,
2009, pp. 417-433.
doi:10.1007/s10021-009-9232-x
[3] D. T. Fischer, C. J. Still and A. P. Williams, “Signifi-
cance of Summer Fog and Overcast for Drought Stress
and Ecological Functioning of Coastal California En-
demic Plant Species,” Journal of Biogeography, Vol. 36,
No. 4, 2009, pp. 783-799.
doi:10.1111/j.1365-2699.2008.02025.x
[4] T. E. Dawson, “Fog in the California Redwood Forest:
Ecosystem Inputs and Use by Plants,” Oecologia, Vol.
117, No. 4, 1998, pp. 476-485.
doi:10.1007/s004420050683
[5] S. S. O. Burgess and T. E. Dawson, “The Contribution of
Fog to the Water Relations of Sequoia Sempervirens (D.
Don): Foliar Uptake and Prevention of Dehydration,”
Plant Cell Environment, Vol. 27, No. 8, 2004, pp.
1023-1034. doi:10.1111/j.1365-3040.2004.01207.x
[6] N. L. Ingraham and R. A. Matthews, “The Importance of
Fog-Drip Water to Vegetation—Point Reyes Peninsula,
California,” Journal of Hydrology, Vol. 164, No. 1-4,
1995, pp. 269-285. doi:10.1016/0022-1694(94)02538-M
[7] J. D. Corbin, M. A. Thomsen, T. E. Dawson and C. M.
D’Antonio, “Summer Water Used by California Coastal
Prairie Grasses: Fog, Drought, and Community Composi-
tion,” Oecologia, Vol. 145, No. 4, 2005, pp. 511-521.
doi:10.1007/s00442-005-0152-y
[8] S. Petterssen, “On the Causes and the Forecasting of the
California Fog,” Journal of the Aeronautical Sciences,
Vol. 3, No. 9, 1936, pp. 305-309.
[9] R. J. Pilie´, E. J. Mack, C. W. Rogers, U. Katz and W. C.
Kocmond, “The Formation of Marine Fog and the De-
velopment of Fog Stratus Systems along the California
Coast,” Journal of Applied Meteorology, Vol. 18, No. 10,
1979, pp. 1275-1286.
doi:10.1175/1520-0450(1979)018<1275:TFOMFA>2.0.C
O;2
[10] D. Koračin, J. Lewis, W. T. Thompson, C. E. Dorman
and J. A. Businger, “Transition of Stratus into Fog along
the California Coast: Observations and Modeling,” Jour-
nal of Atmospheric Sciences, Vol. 58, No. 13, 2001, pp.
1714-1731.
doi:10.1175/1520-0469(2001)058<1714:TOSIFA>2.0.C
O;2
[11] D. Stow, Y. Hamada, L. Coulter and Z. Anguelova,
“Monitoring Shrubland Habitat Changes through Ob-
ject-Based Change Identification with Airborne Multi-
spectral Imagery,” Remote Sensing of Environment, Vol.
112, No. 3, 2008, pp. 1051-1061.
doi:10.1016/j.rse.2007.07.011
[12] D. F. Leipper, “Fog Forecasting Objectively in the Cali-
fornia Coastal Area Using LIBS,” Weather and Fore-
casting, Vol. 10, No. 4, 1995, pp. 741-762.
doi:10.1175/1520-0434(1995)010%3C0689:DCOSTS%3
E2.0.CO;2
[13] L. De La Fuente, Y. Delage, S. Desjardins, A. Macafee, G.
Pearson and H. Ritchie, “Can Sea Fog be Inferred from
Operational GEM Forecast Fields?” Earth and Environ-
mental Science, Vol. 164, 2007, pp. 1303-1325.
doi:10.1007/s00024-007-0220-9
[14] W. Grace and P. Ferriere, “Statistical-Empirical Fore-
casting Guidance for the Occurrence of Fog at Mount
Gambier Airport,” Australian Meteorological Magazine,
Vol. 50, 2001, pp. 15-27.
http://www.bom.gov.au/amm/docs/2001/grace.pdf
[15] L. Caceres, B. Gomez-Silva, X. Garro, V. Rodrıguez, V.
Monardes and C. P. McKay, “Relative Humidity Patterns
and Fog Water Precipitation in the Atacama Desert and
Biological Implications,” Journal of Geophysical Re-
search, Vol. 112, No. G4, 2007, 11 pp.
doi:10.1029/2006JG000344
[16] P. Henson and D. J. Usner, “The Natural History of Big
Sur,” University of California Press, Berkeley and Los
Angeles, 1993.
[17] R. S. Schemenauer and P. Cereceda, “A Proposed Stan-
dard Fog Collector for Use in High-elevation Regions,”
Journal of Applied Meteorology, Vol. 33, No. 11, 1994,
pp. 1313-1322.
doi:10.1175/1520-0450(1994)033%3C1313:APSFCF%3
E2.0.CO;2
[18] M. Kubat, R. Holte and S. Matwin, “Machine Learning
for the Detection of Oil Spills in Satellite Radar Images,”
Machine Learning, Vol. 30, No. 2-3, 1998, pp. 195-215.
doi:10.1023/A:1007452223027
[19] R. S. Schemenauer and P. Cereceda, “Fog-Water Collec-
tion in Arid Coastal Locations,” Ambio, Vol. 20, No. 7,
1991, pp. 303-308.
[20] R. E. Newell, “Comments on ‘The Forecasting of Winter
Fog: A Geographical Approach’,” Journal of Applied
Meteorology, Vol. 3, No. 3, 1964, pp. 342-343.
doi:10.1175/1520-0450(1964)003%3C0342:COFOWF%
3E2.0.CO;2
[21] J. D. Lundquist and T. B. Bourcy, “California and Oregon
humidity and coastal fog,” 14th Conference on Boundary
Layers and Turbulence, Colorado, 2000.
[22] J. Oliver, “Fog Water Harvesting along the West Coast of
South Africa: A Feasibility Study,” Water SA, Vol. 28,
No. 34, 2002, pp. 349-360.
[23] R. S. Schemenaur and P. I. Joe, “The Collection Effi-
ciency of a Massive Fog Collector,” Atmospheric Re-
search, Vol. 24, No. 1-4, 1989, pp. 53-69.
doi:10.1016/0169-8095(89)90036-7
[24] NOAA, “1981-2010 Climate Normals, Big Sur Station,”
http://gis.ncdc.noaa.gov/map/cdo/
[25] J. D. Joslin, S. F. Mueller and M. H. Wolfe, “Tests of
Models of Cloudwater Deposition to Forest Canopies
Using Artificial and Living Collectors,” Atmospheric En-
vironment, Vol. 24A, No. 12, 1990, pp. 3007-3019.
http://www.sciencedirect.com/science/article/pii/0960168
69090480B