 Atmospheric and Climate Sciences, 2012, 2, 381-400 http://dx.doi.org/10.4236/acs.2012.24034 Published Online October 2012 (http://www.SciRP.org/journal/acs) Climate Projections and Uncertainties over South America from MRI/JMA Global Model Experiments Josefina Blázquez1,2,3, Mario Nestor Nuñez1,2,3, Shoji Kusunoki4 1Research Centre for Sea and Atmosphere (CIMA-CONICET/FCEN-UBA), Buenos Aires, Argentina 2Department of Atmospheric and Oceanic Sciences (FCEN-UBA), Buenos Aires, Argentina 3Franco-Argentine Institute for Climate Studies and Its Impacts (UMI IFAECI/CNRS), Buenos Aires, Argentina 4Meteorological Research Institute, Tsukuba, Japan Email: blazquez@cima.fcen.uba.ar Received March 15, 2012; revised April 20, 2012; accepted April 30, 2012 ABSTRACT This paper analyses the climate change projected for the near and distant future in South America using MRI/JMA (Japanese Meteorological Agency) global model simulations with resolutions of 20 and 60 km. Changes in mean cli- mate, as well as in the annual cycles and interannual variability of temperature and precipitation are discussed. An analysis is also made of the uncertainties of the 60 km resolution model experiments. For the near and distant future, both, the 20 km and 60 km resolution MRI/JMA models project that temperature changes will be positive in all seasons. The greatest values of change are over the Andes and over tropical and subtropical latitudes of the study region. In all the subregions analysed, the 20 km model projects greater changes in the annual cycle of mean temperature than the 60 km model. Changes in summer precipitation are positive over most of the continent, except for southern Chile. Autumn precipitation is projected to increase over northern Argentina and north-western South America and to decrease over central Chile in winter, which might be due to the southward shift of the Pacific storm-track. The most significant posi- tive change in Southeastern South America (SESA) is projected to occur in spring precipitation. In general, projected changes in the annual cycle are greater in the rainy seasons of each subregion. No significant changes are expected in the interannual variability of temperature and precipitation. La Plata basin is projected to experience increased runoff, which would indicate that the projected rise in precipitation would have stronger effect than projected warming. The analysis of climate projection uncertainties revealed that temperature projections are more reliable than precipitation projections; and that uncertainty in near future simulations is greater than in simulations of the end of the century. Keywords: Climate Projections; High Resolution Global Model; South America; Uncertainties 1. Introduction This study presents climate change projections over South America from MRI/JMA experiments. Recently, [1] assessed present climate MRI/JMA simulations and concluded that despite some deficiencies, the MRI/JMA model represents the present-day climate of South Amer- ica fairly well. This is why the present study analyses future climate projections from the mentioned model. Numerous studies were published on climate change over South America, either using regional [2-9] or global model simulations [10-14]. Out of the mentioned authors, only [8] and [9] provide climate change projections for the beginning and middle of the century, the rest study the impact of increased greenhouse gas concentrations in the atmosphere on the climate of the end of the 21st cen- tury. Furthermore, in recent years, most papers have analysed climate change projections from regional mod- els, as regional models allow improving the spatial reso- lution of the simulations. However, limited area models require not only initial but also boundary conditions wh- ich are obtained from global models. This implies that the accuracy of regional model simulations is limited by the accuracy of global models. Recently, several world Centres have joined efforts to improve the resolution of their global models. For instance, the Meteorological Research Institute (MRI) and the Japan Meteorological Agency (JMA) have significantly improved the spatial resolution of their global model and achieved a resoluti- on comparable to that of regional models (20 km and 60 km). The current computational cost of high resolution global model simulations is high (need of using superco- mputers), but hopefully in the next few years smaller ce- ntres will also able to run high resolution global models. This paper analyses climate change projections for the near and distant future using MRI/JMA global model experiments under a given emission scenario. In particu- C opyright © 2012 SciRes. ACS 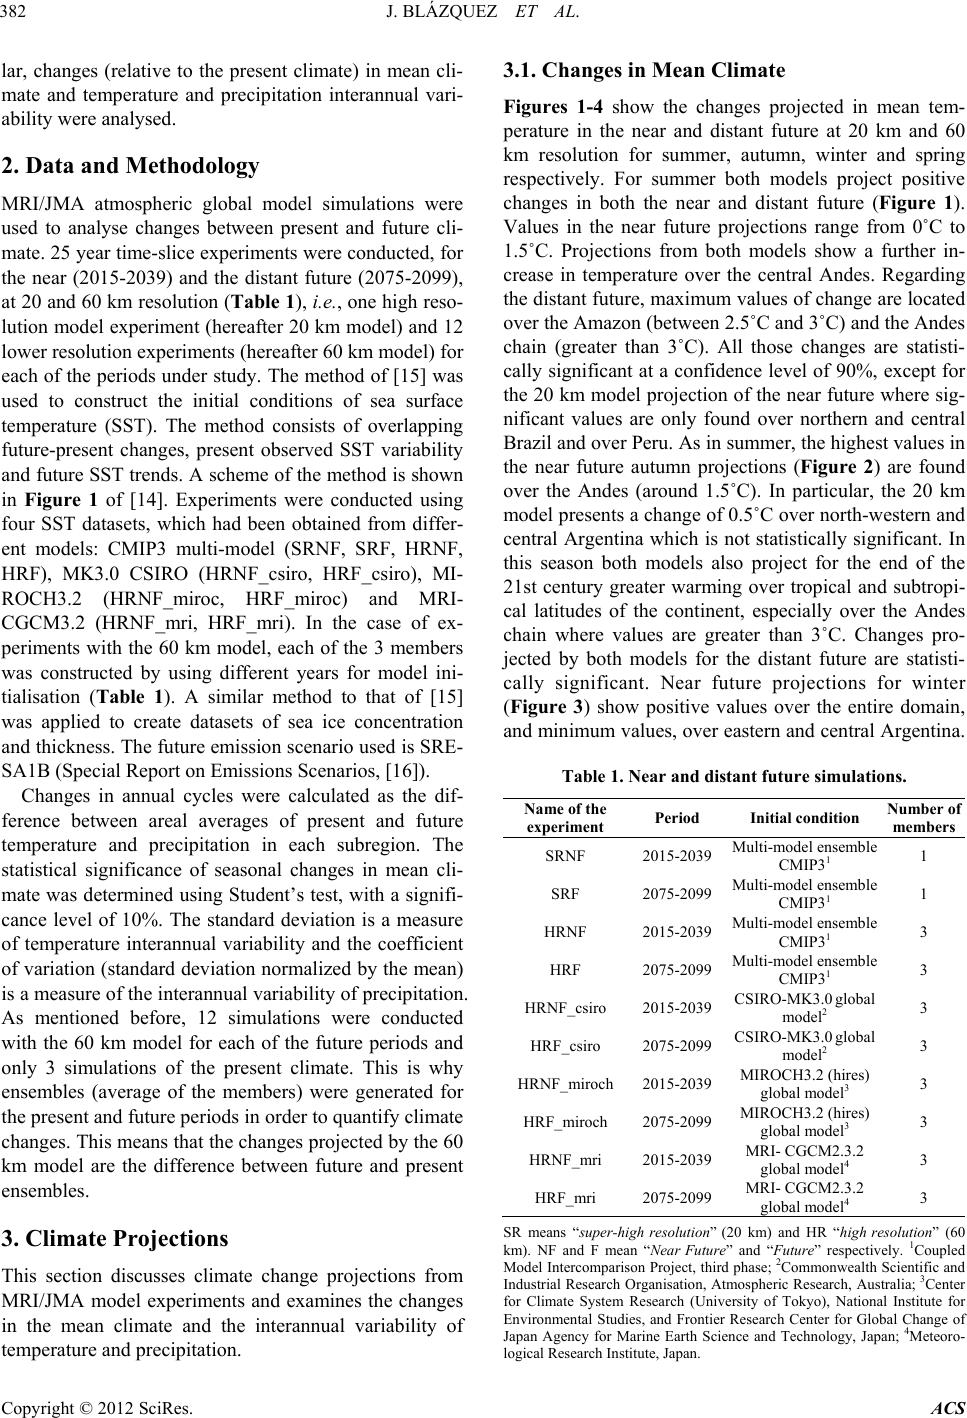 J. BLÁZQUEZ ET AL. 382 lar, changes (relative to the present climate) in mean cli- mate and temperature and precipitation interannual vari- ability were analysed. 2. Data and Methodology MRI/JMA atmospheric global model simulations were used to analyse changes between present and future cli- mate. 25 year time-slice experiments were conducted, for the near (2015-2039) and the distant future (2075-2099), at 20 and 60 km resolution (Table 1), i.e., one high reso- lution model experiment (hereafter 20 km model) and 12 lower resolution experiments (hereafter 60 km model) for each of the periods under study. The method of [15] was used to construct the initial conditions of sea surface temperature (SST). The method consists of overlapping future-present changes, present observed SST variability and future SST trends. A scheme of the method is shown in Figure 1 of [14]. Experiments were conducted using four SST datasets, which had been obtained from differ- ent models: CMIP3 multi-model (SRNF, SRF, HRNF, HRF), MK3.0 CSIRO (HRNF_csiro, HRF_csiro), MI- ROCH3.2 (HRNF_miroc, HRF_miroc) and MRI- CGCM3.2 (HRNF_mri, HRF_mri). In the case of ex- periments with the 60 km model, each of the 3 members was constructed by using different years for model ini- tialisation (Table 1). A similar method to that of [15] was applied to create datasets of sea ice concentration and thickness. The future emission scenario used is SRE- SA1B (Special Report on Emissions Scenarios, [16]). Changes in annual cycles were calculated as the dif- ference between areal averages of present and future temperature and precipitation in each subregion. The statistical significance of seasonal changes in mean cli- mate was determined using Student’s test, with a signifi- cance level of 10%. The standard deviation is a measure of temperature interannual variability and the coefficient of variation (standard deviation normalized by the mean) is a measure of the interannual variability of precipitation. As mentioned before, 12 simulations were conducted with the 60 km model for each of the future periods and only 3 simulations of the present climate. This is why ensembles (average of the members) were generated for the present and future periods in order to quantify climate changes. This means that the changes projected by the 60 km model are the difference between future and present ensembles. 3. Climate Projections This section discusses climate change projections from MRI/JMA model experiments and examines the changes in the mean climate and the interannual variability of temperature and precipitation. 3.1. Changes in Mean Climate Figures 1-4 show the changes projected in mean tem- perature in the near and distant future at 20 km and 60 km resolution for summer, autumn, winter and spring respectively. For summer both models project positive changes in both the near and distant future (Figure 1). Values in the near future projections range from 0˚C to 1.5˚C. Projections from both models show a further in- crease in temperature over the central Andes. Regarding the distant future, maximum values of change are located over the Amazon (between 2.5˚C and 3˚C) and the Andes chain (greater than 3˚C). All those changes are statisti- cally significant at a confidence level of 90%, except for the 20 km model projection of the near future where sig- nificant values are only found over northern and central Brazil and over Peru. As in summer, the highest values in the near future autumn projections (Figure 2) are found over the Andes (around 1.5˚C). In particular, the 20 km model presents a change of 0.5˚C over north-western and central Argentina which is not statistically significant. In this season both models also project for the end of the 21st century greater warming over tropical and subtropi- cal latitudes of the continent, especially over the Andes chain where values are greater than 3˚C. Changes pro- jected by both models for the distant future are statisti- cally significant. Near future projections for winter (Figure 3) show positive values over the entire domain, and minimum values, over eastern and central Argentina. Table 1. Near and distant future simulations. Name of the experiment Period Initial condition Number of membe r s SRNF 2015-2039Multi-model ensemble CMIP31 1 SRF 2075-2099Multi-model ensemble CMIP31 1 HRNF 2015-2039Multi-model ensemble CMIP31 3 HRF 2075-2099Multi-model ensemble CMIP31 3 HRNF_csiro 2015-2039CSIRO-MK3.0 global model2 3 HRF_csiro 2075-2099CSIRO-MK3.0 global model2 3 HRNF_miroch2015-2039 MIROCH3.2 (hires) global model3 3 HRF_miroch 2075-2099MIROCH3.2 (hires) global model3 3 HRNF_mri 2015-2039MRI- CGCM2.3.2 global model4 3 HRF_mri 2075-2099MRI- CGCM2.3.2 global model4 3 SR means “super-high resolution” (20 km) and HR “high resolution” (60 km). NF and F mean “Near Futur e” and “Future” respectively. 1Coupled Model Intercomparison Project, third phase; 2Commonwealth Scientific and Industrial Research Organisation, Atmospheric Research, Australia; 3Center for Climate System Research (University of Tokyo), National Institute for Environmental Studies, and Frontier Research Center for Global Change of Japan Agency for Marine Earth Science and Technology, Japan; 4Meteoro- logical Research Institute, Japan. Copyright © 2012 SciRes. ACS 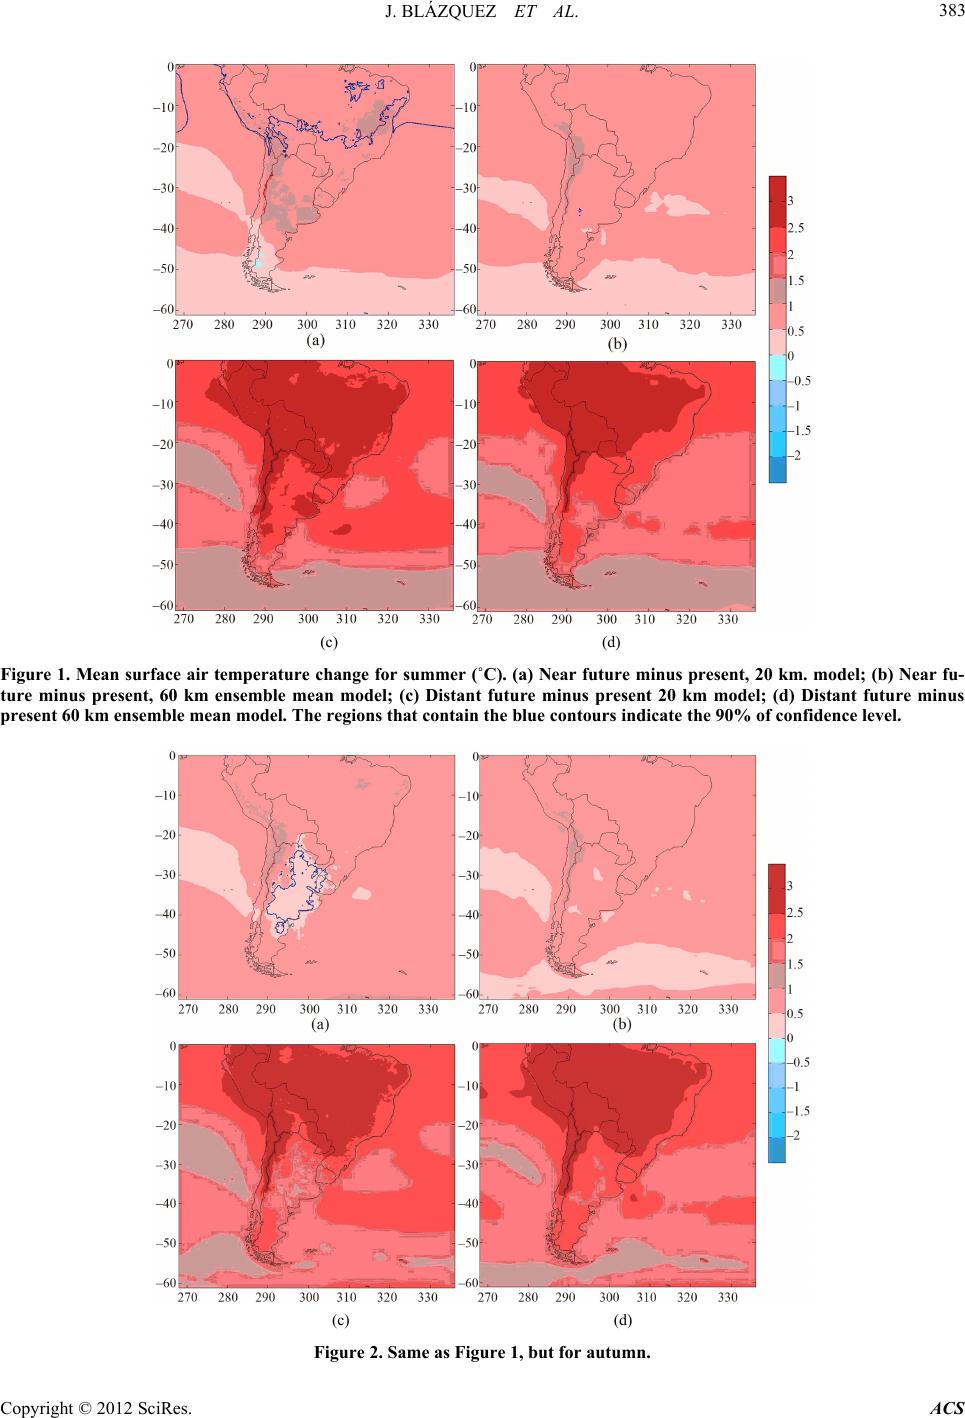 J. BLÁZQUEZ ET AL. Copyright © 2012 SciRes. ACS 383 (c) (d) Figure 1. Mean surface air temperature change for summer (˚C). (a) Near future minus present, 20 km. model; (b) Near fu- ture minus present, 60 km ensemble mean model; (c) Distant future minus present 20 km model; (d) Distant future minus present 60 km ensemble mean model. The regions that contain the blue contours indicate the 90% of confidence level. (c) (d) Figure 2. Same as Figure 1, but for autumn. 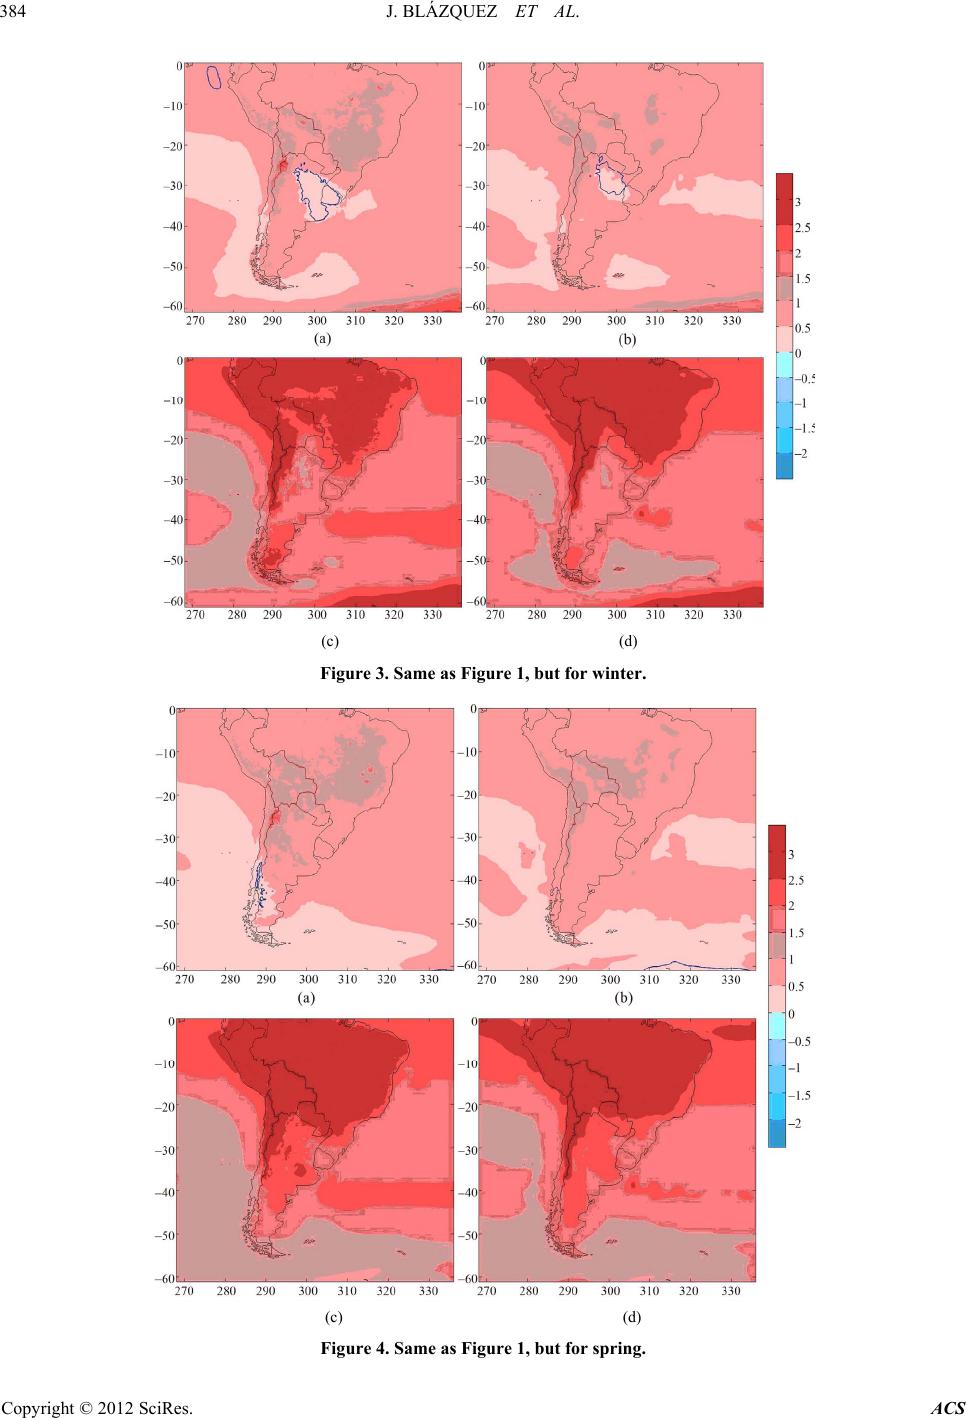 J. BLÁZQUEZ ET AL. 384 (c) (d) Figure 3. Same as Figure 1, but for winter. (c) (d) Figure 4. Same as Figure 1, but for spring. Copyright © 2012 SciRes. ACS 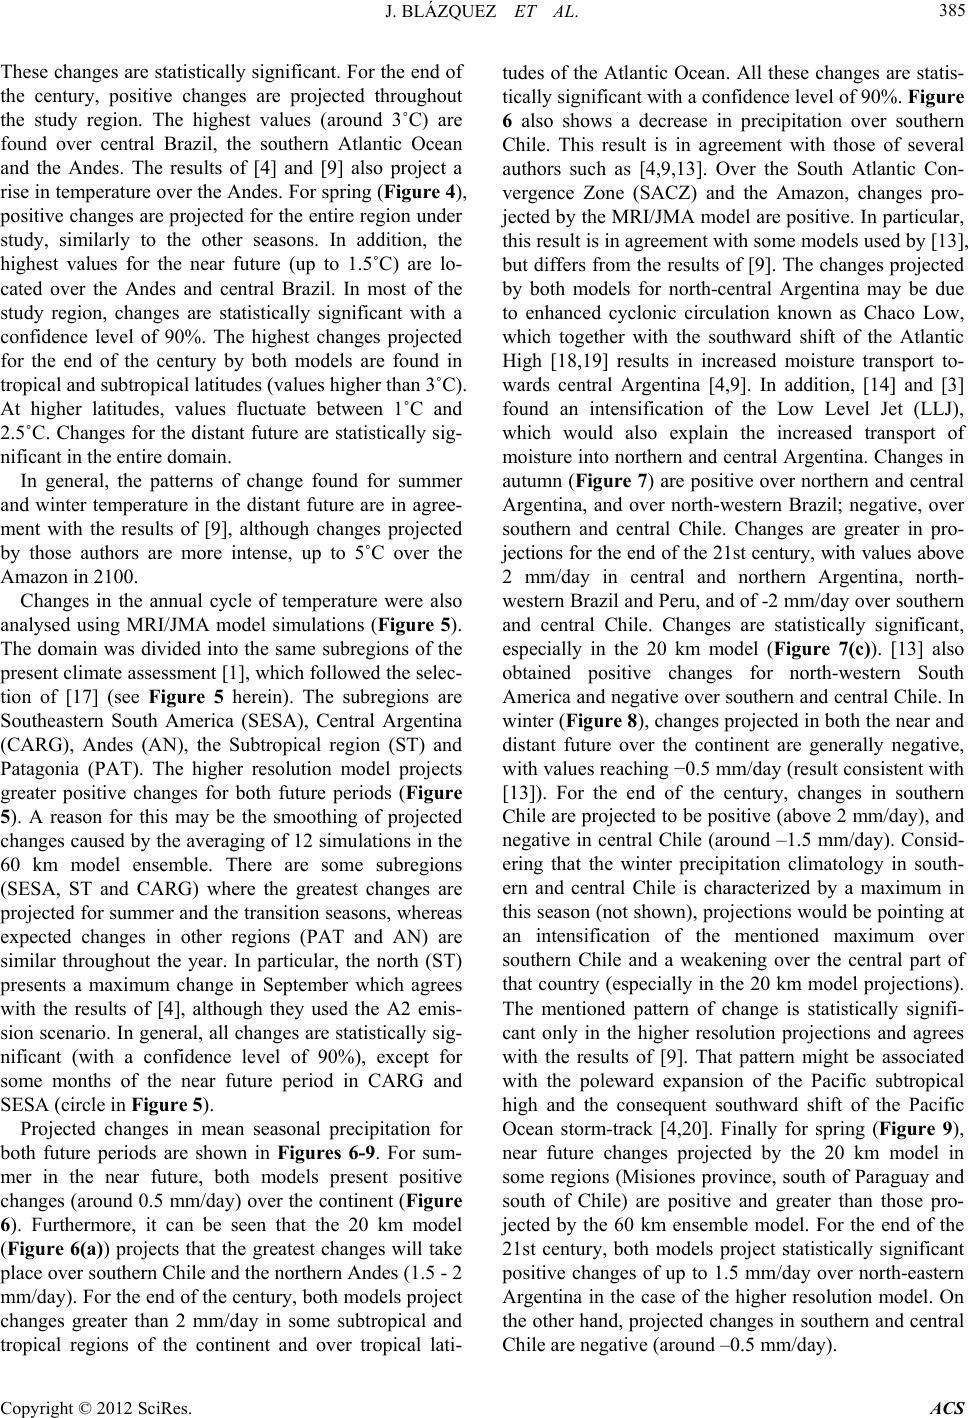 J. BLÁZQUEZ ET AL. Copyright © 2012 SciRes. ACS 385 These changes are statistically significant. For the end of the century, positive changes are projected throughout the study region. The highest values (around 3˚C) are found over central Brazil, the southern Atlantic Ocean and the Andes. The results of [4] and [9] also project a rise in temperature over the Andes. For spring (Figure 4), positive changes are projected for the entire region under study, similarly to the other seasons. In addition, the highest values for the near future (up to 1.5˚C) are lo- cated over the Andes and central Brazil. In most of the study region, changes are statistically significant with a confidence level of 90%. The highest changes projected for the end of the century by both models are found in tropical and subtropical latitudes (values higher than 3˚C). At higher latitudes, values fluctuate between 1˚C and 2.5˚C. Changes for the distant future are statistically sig- nificant in the entire domain. In general, the patterns of change found for summer and winter temperature in the distant future are in agree- ment with the results of [9], although changes projected by those authors are more intense, up to 5˚C over the Amazon in 2100. Changes in the annual cycle of temperature were also analysed using MRI/JMA model simulations (Figure 5). The domain was divided into the same subregions of the present climate assessment [1], which followed the selec- tion of [17] (see Figure 5 herein). The subregions are Southeastern South America (SESA), Central Argentina (CARG), Andes (AN), the Subtropical region (ST) and Patagonia (PAT). The higher resolution model projects greater positive changes for both future periods (Figure 5). A reason for this may be the smoothing of projected changes caused by the averaging of 12 simulations in the 60 km model ensemble. There are some subregions (SESA, ST and CARG) where the greatest changes are projected for summer and the transition seasons, whereas expected changes in other regions (PAT and AN) are similar throughout the year. In particular, the north (ST) presents a maximum change in September which agrees with the results of [4], although they used the A2 emis- sion scenario. In general, all changes are statistically sig- nificant (with a confidence level of 90%), except for some months of the near future period in CARG and SESA (circle in Figure 5). Projected changes in mean seasonal precipitation for both future periods are shown in Figures 6-9. For sum- mer in the near future, both models present positive changes (around 0.5 mm/day) over the continent (Figure 6). Furthermore, it can be seen that the 20 km model (Figure 6(a)) projects that the greatest changes will take place over southern Chile and the northern Andes (1.5 - 2 mm/day). For the end of the century, both models project changes greater than 2 mm/day in some subtropical and tropical regions of the continent and over tropical lati- tudes of the Atlantic Ocean. All these changes are statis- tically significant with a confidence level of 90%. Figure 6 also shows a decrease in precipitation over southern Chile. This result is in agreement with those of several authors such as [4,9,13]. Over the South Atlantic Con- vergence Zone (SACZ) and the Amazon, changes pro- jected by the MRI/JMA model are positive. In particular, this result is in agreement with some models used by [13], but differs from the results of [9]. The changes projected by both models for north-central Argentina may be due to enhanced cyclonic circulation known as Chaco Low, which together with the southward shift of the Atlantic High [18,19] results in increased moisture transport to- wards central Argentina [4,9]. In addition, [14] and [3] found an intensification of the Low Level Jet (LLJ), which would also explain the increased transport of moisture into northern and central Argentina. Changes in autumn (Figure 7) are positive over northern and central Argentina, and over north-western Brazil; negative, over southern and central Chile. Changes are greater in pro- jections for the end of the 21st century, with values above 2 mm/day in central and northern Argentina, north- western Brazil and Peru, and of -2 mm/day over southern and central Chile. Changes are statistically significant, especially in the 20 km model (Figure 7(c)). [13] also obtained positive changes for north-western South America and negative over southern and central Chile. In winter (Figure 8), changes projected in both the near and distant future over the continent are generally negative, with values reaching −0.5 mm/day (result consistent with [13]). For the end of the century, changes in southern Chile are projected to be positive (above 2 mm/day), and negative in central Chile (around –1.5 mm/day). Consid- ering that the winter precipitation climatology in south- ern and central Chile is characterized by a maximum in this season (not shown), projections would be pointing at an intensification of the mentioned maximum over southern Chile and a weakening over the central part of that country (especially in the 20 km model projections). The mentioned pattern of change is statistically signifi- cant only in the higher resolution projections and agrees with the results of [9]. That pattern might be associated with the poleward expansion of the Pacific subtropical high and the consequent southward shift of the Pacific Ocean storm-track [4,20]. Finally for spring (Figure 9), near future changes projected by the 20 km model in some regions (Misiones province, south of Paraguay and south of Chile) are positive and greater than those pro- jected by the 60 km ensemble model. For the end of the 21st century, both models project statistically significant positive changes of up to 1.5 mm/day over north-eastern Argentina in the case of the higher resolution model. On the other hand, projected changes in southern and central Chile are negative (around –0.5 mm/day). 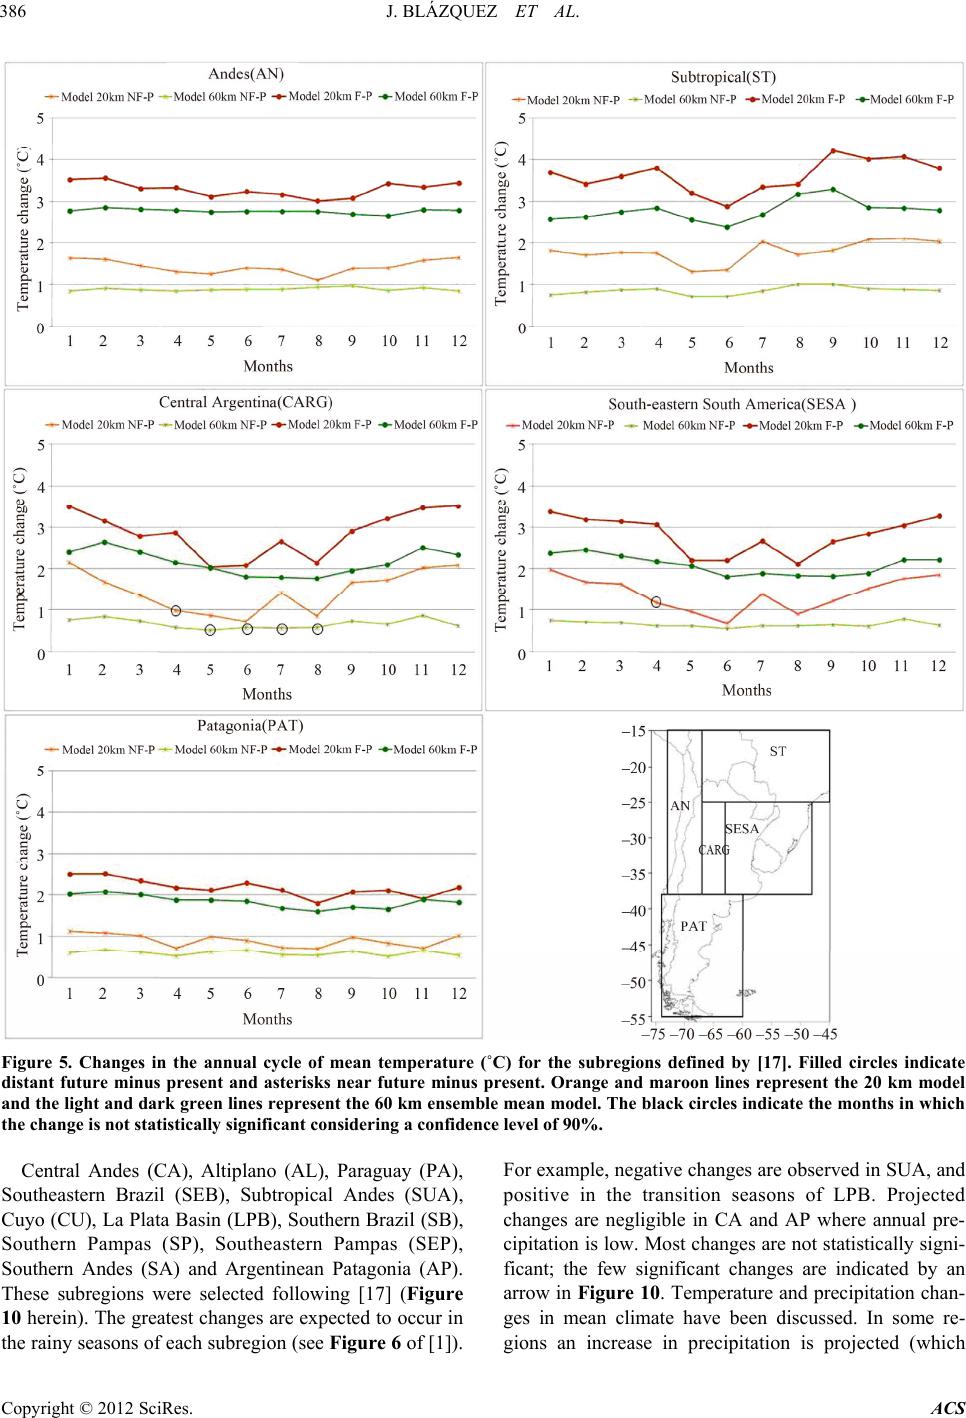 J. BLÁZQUEZ ET AL. 386 Figure 5. Changes in the annual cycle of mean temperature (˚C) for the subregions defined by [17]. Filled circles indicate distant future minus present and asterisks near future minus present. Orange and maroon lines represent the 20 km model and the light and dark green lines represent the 60 km ensemble mean model. The black circles indicate the months in which the chang e is not stati st ically sig nificant considering a confidence level of 90%. Central Andes (CA), Altiplano (AL), Paraguay (PA), Southeastern Brazil (SEB), Subtropical Andes (SUA), Cuyo (CU), La Plata Basin (LPB), Southern Brazil (SB), Southern Pampas (SP), Southeastern Pampas (SEP), Southern Andes (SA) and Argentinean Patagonia (AP). These subregions were selected following [17] (Figure 10 herein). The greatest changes are expected to occur in the rainy seasons of each subregion (see Figure 6 of [1]). For example, negative changes are observed in SUA, and positive in the transition seasons of LPB. Projected changes are negligible in CA and AP where annual pre- cipitation is low. Most changes are not statistically signi- ficant; the few significant changes are indicated by an arrow in Figure 10. Temperature and precipitation chan- ges in mean climate have been discussed. In some re- gions an increase in precipitation is projected (which Copyright © 2012 SciRes. ACS 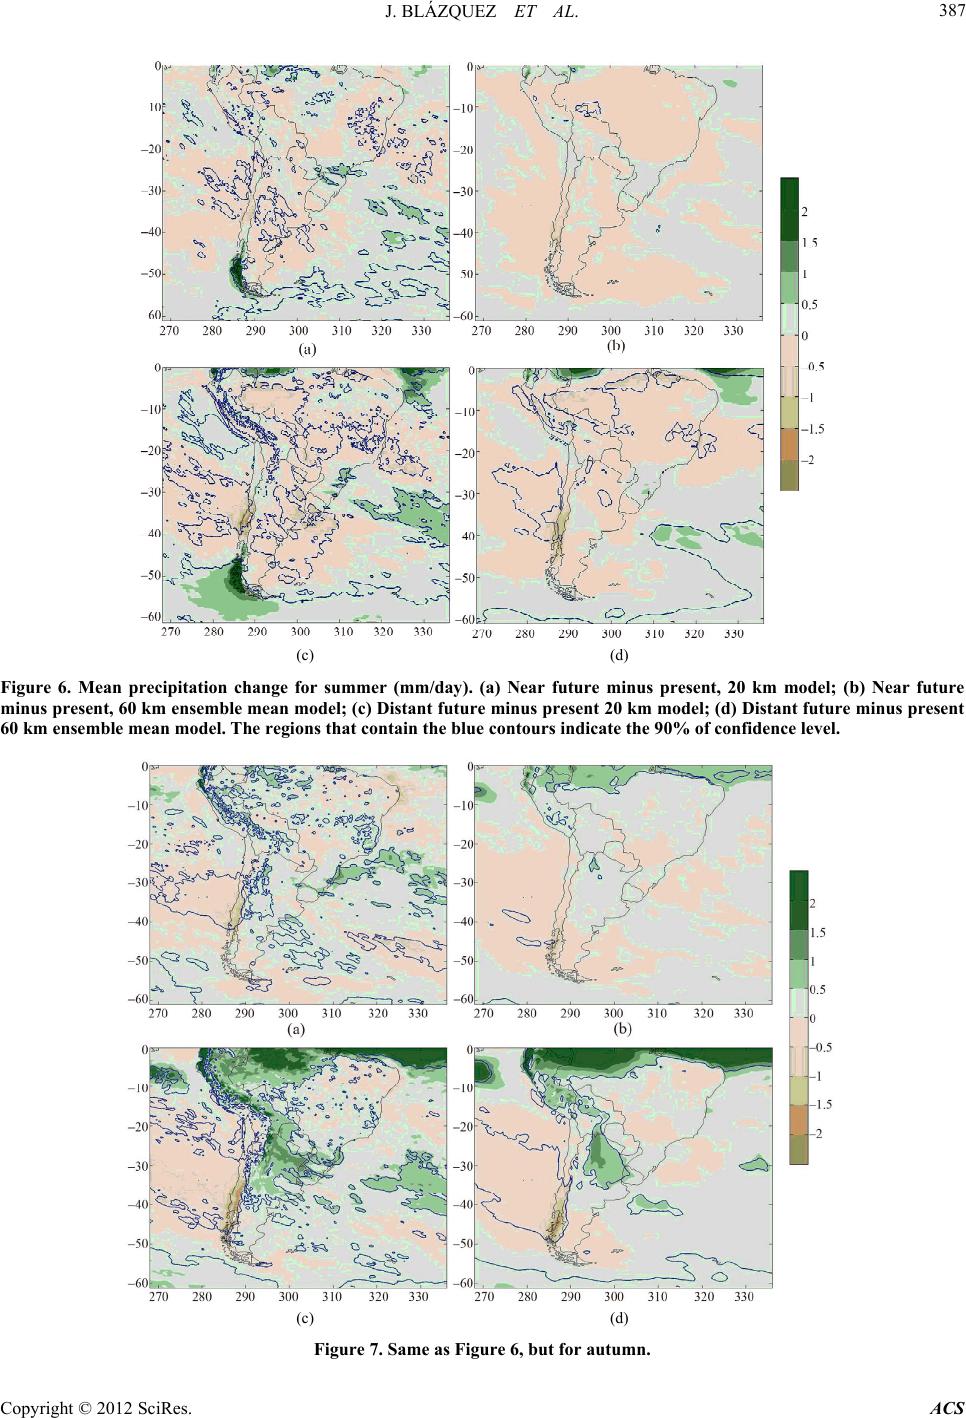 J. BLÁZQUEZ ET AL. 387 (c) (d) Figure 6. Mean precipitation change for summer (mm/day). (a) Near future minus present, 20 km model; (b) Near future minus present, 60 km ensemble mean model; (c) Distant future minus present 20 km model; (d) Distant future minus present 60 km ensemble mean model. The regions that contain the blue contours indicate the 90% of confidence level. (c) (d) Figure 7. Same as Figure 6, but for autumn. Copyright © 2012 SciRes. ACS 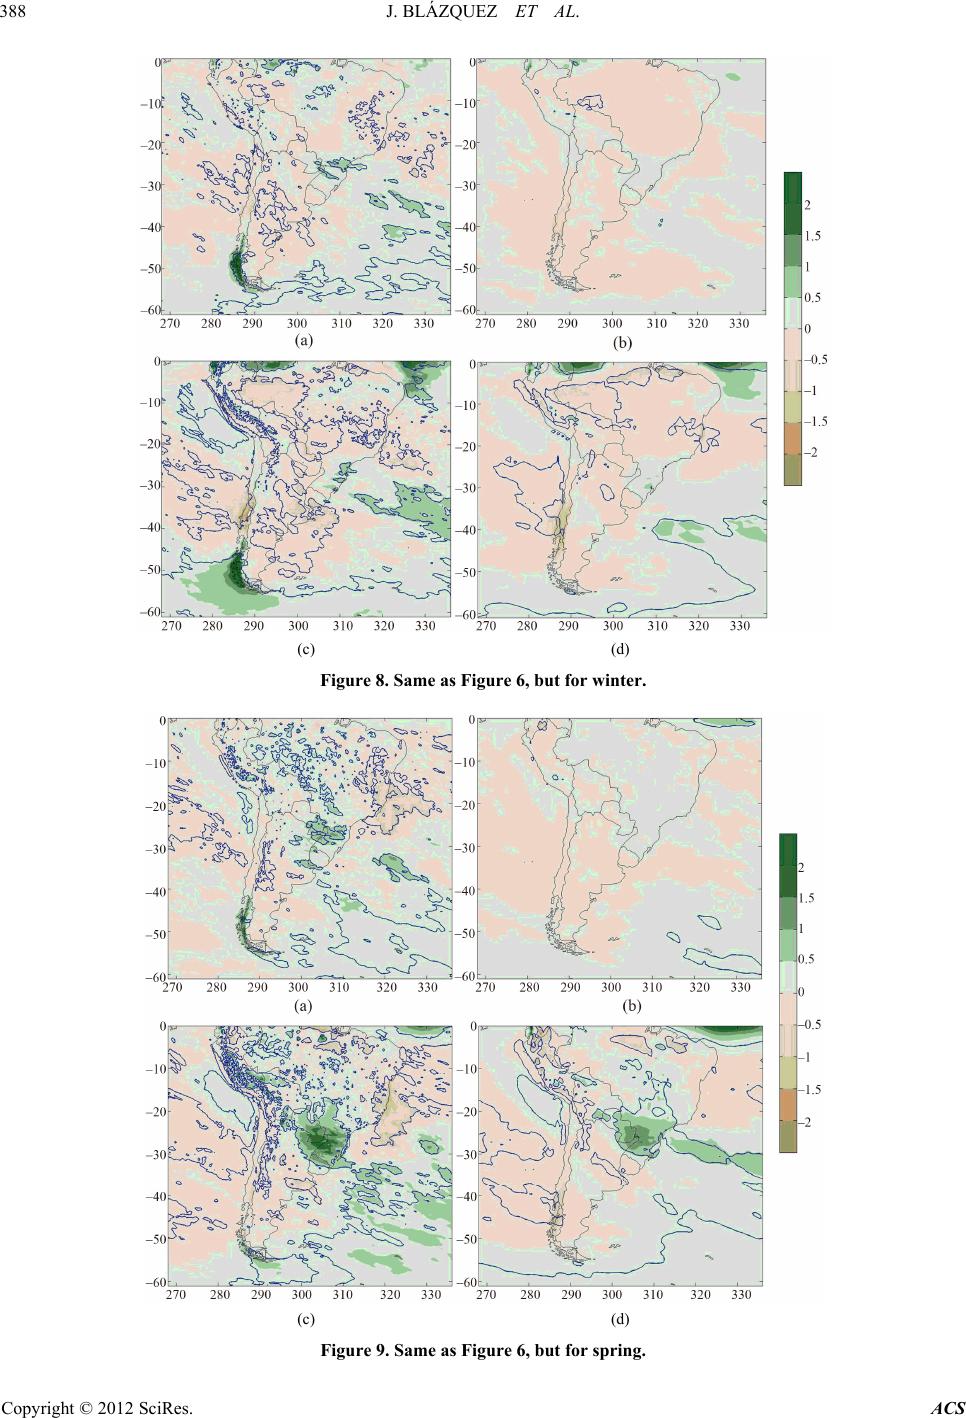 J. BLÁZQUEZ ET AL. 388 (c) (d) Figure 8. Same as Figure 6, but for winter. (c) (d) Figure 9. Same as Figure 6, but for spring. Copyright © 2012 SciRes. ACS 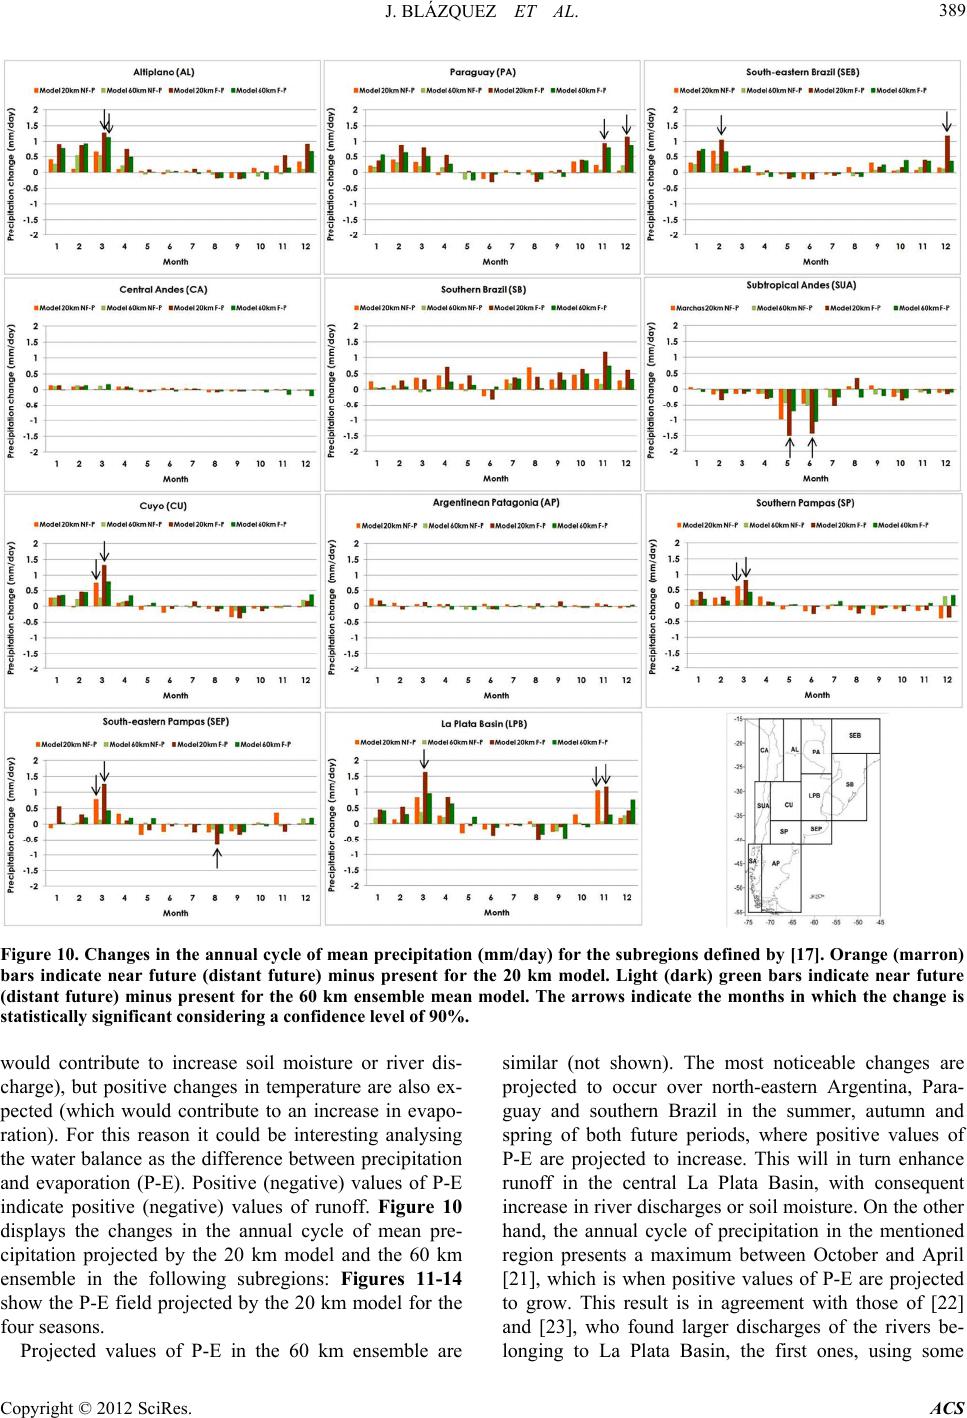 J. BLÁZQUEZ ET AL. Copyright © 2012 SciRes. ACS 389 Figure 10. Changes in the annual cycle of mean precipitation (mm/day) for the subregions defined by [17]. Orange (marron) bars indicate near future (distant future) minus present for the 20 km model. Light (dark) green bars indicate near future (distant future) minus present for the 60 km ensemble mean model. The arrows indicate the months in which the change is statistically significant considering a confidence level of 90%. would contribute to increase soil moisture or river dis- charge), but positive changes in temperature are also ex- pected (which would contribute to an increase in evapo- ration). For this reason it could be interesting analysing the water balance as the difference between precipitation and evaporation (P-E). Positive (negative) values of P-E indicate positive (negative) values of runoff. Figure 10 displays the changes in the annual cycle of mean pre- cipitation projected by the 20 km model and the 60 km ensemble in the following subregions: Figures 11-14 show the P-E field projected by the 20 km model for the four seasons. Projected values of P-E in the 60 km ensemble are similar (not shown). The most noticeable changes are projected to occur over north-eastern Argentina, Para- guay and southern Brazil in the summer, autumn and spring of both future periods, where positive values of P-E are projected to increase. This will in turn enhance runoff in the central La Plata Basin, with consequent increase in river discharges or soil moisture. On the other hand, the annual cycle of precipitation in the mentioned region presents a maximum between October and April [21], which is when positive values of P-E are projected to grow. This result is in agreement with those of [22] and [23], who found larger discharges of the rivers be- longing to La Plata Basin, the first ones, using some 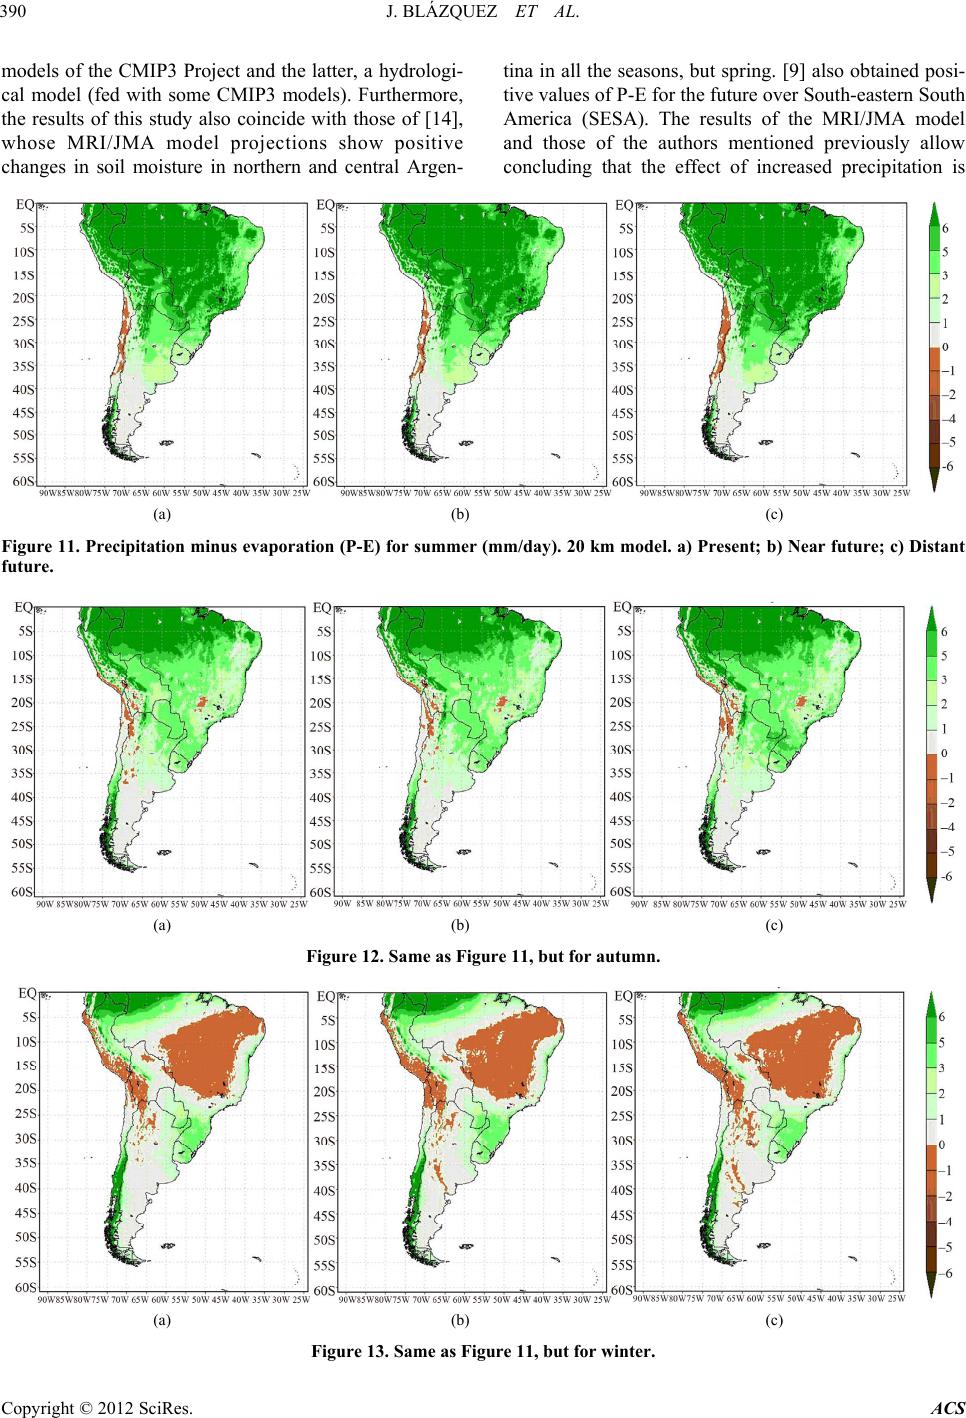 J. BLÁZQUEZ ET AL. 390 models of the CMIP3 Project and the latter, a hydrologi- cal model (fed with some CMIP3 models). Furthermore, the results of this study also coincide with those of [14], whose MRI/JMA model projections show positive changes in soil moisture in northern and central Argen- tina in all the seasons, but spring. [9] also obtained posi- tive values of P-E for the future over South-eastern South America (SESA). The results of the MRI/JMA model and those of the authors mentioned previously allow concluding that the effect of increased precipitation is (a) (b) (c) Figure 11. Precipitation minus evaporation (P-E) for summer (mm/day). 20 km model. a) Present; b) Near future; c) Distant future. (a) (b) (c) Figure 12. Same as Figure 11, but for autumn. (a) (b) (c) Figure 13. Same as Figure 11, but for winter. Copyright © 2012 SciRes. ACS 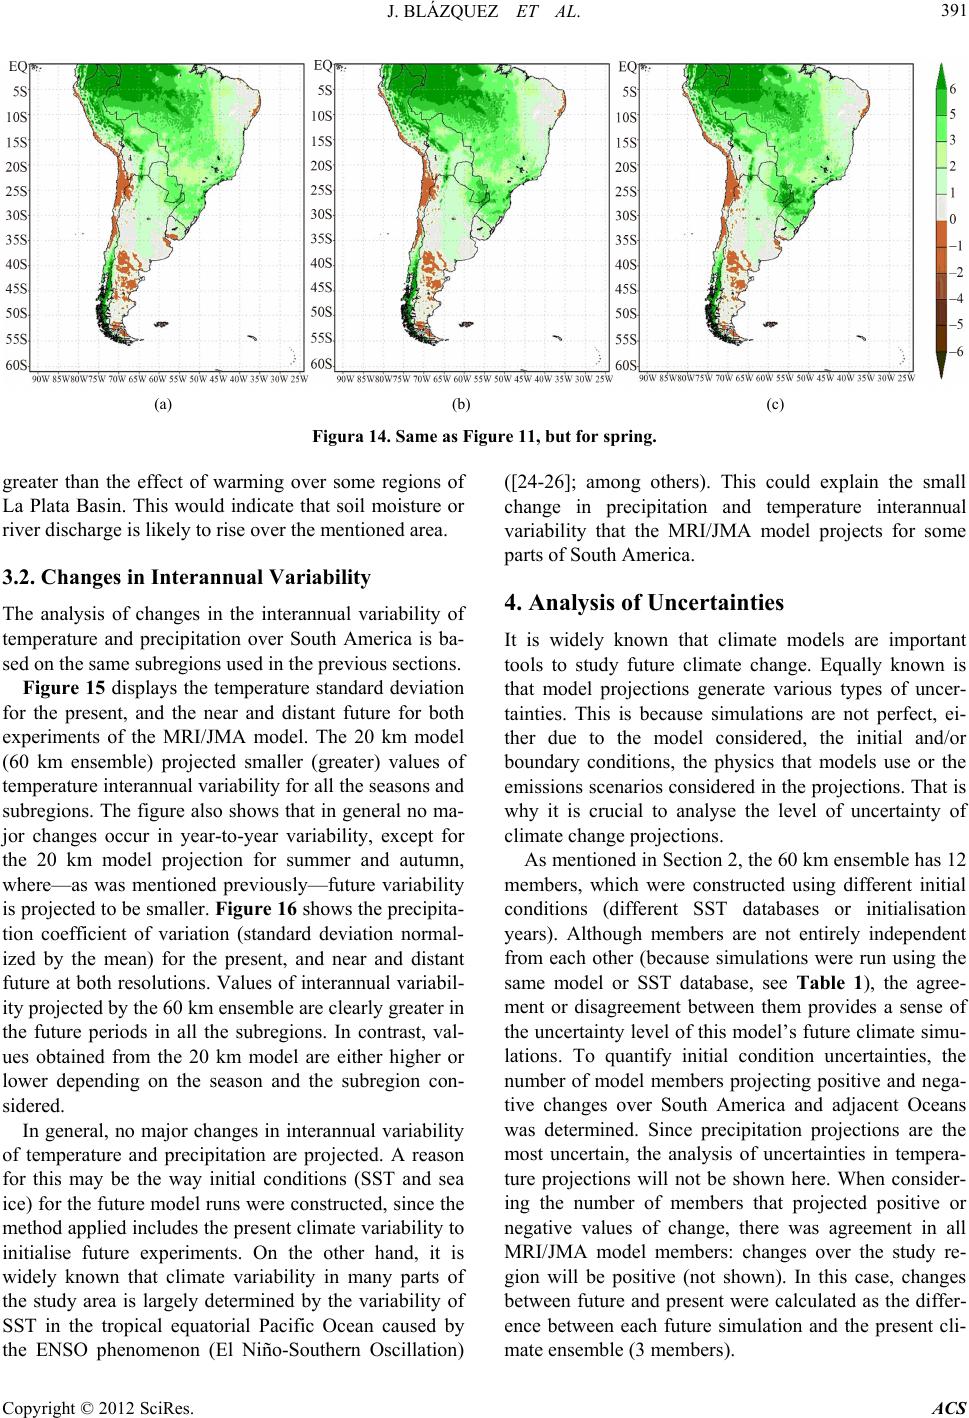 J. BLÁZQUEZ ET AL. 391 (a) (b) (c) Figura 14. Same as Figure 11, but for spring. greater than the effect of warming over some regions of La Plata Basin. This would indicate that soil moisture or river discharge is likely to rise over the mentioned area. 3.2. Changes in Interannual Variability The analysis of changes in the interannual variability of temperature and precipitation over South America is ba- sed on the same subregions used in the previous sections. Figure 15 displays the temperature standard deviation for the present, and the near and distant future for both experiments of the MRI/JMA model. The 20 km model (60 km ensemble) projected smaller (greater) values of temperature interannual variability for all the seasons and subregions. The figure also shows that in general no ma- jor changes occur in year-to-year variability, except for the 20 km model projection for summer and autumn, where—as was mentioned previously—future variability is projected to be smaller. Figure 16 shows the precipita- tion coefficient of variation (standard deviation normal- ized by the mean) for the present, and near and distant future at both resolutions. Values of interannual variabil- ity projected by the 60 km ensemble are clearly greater in the future periods in all the subregions. In contrast, val- ues obtained from the 20 km model are either higher or lower depending on the season and the subregion con- sidered. In general, no major changes in interannual variability of temperature and precipitation are projected. A reason for this may be the way initial conditions (SST and sea ice) for the future model runs were constructed, since the method applied includes the present climate variability to initialise future experiments. On the other hand, it is widely known that climate variability in many parts of the study area is largely determined by the variability of SST in the tropical equatorial Pacific Ocean caused by the ENSO phenomenon (El Niño-Southern Oscillation) ([24-26]; among others). This could explain the small change in precipitation and temperature interannual variability that the MRI/JMA model projects for some parts of South America. 4. Analysis of Uncertainties It is widely known that climate models are important tools to study future climate change. Equally known is that model projections generate various types of uncer- tainties. This is because simulations are not perfect, ei- ther due to the model considered, the initial and/or boundary conditions, the physics that models use or the emissions scenarios considered in the projections. That is why it is crucial to analyse the level of uncertainty of climate change projections. As mentioned in Section 2, the 60 km ensemble has 12 members, which were constructed using different initial conditions (different SST databases or initialisation years). Although members are not entirely independent from each other (because simulations were run using the same model or SST database, see Table 1), the agree- ment or disagreement between them provides a sense of the uncertainty level of this model’s future climate simu- lations. To quantify initial condition uncertainties, the number of model members projecting positive and nega- tive changes over South America and adjacent Oceans was determined. Since precipitation projections are the most uncertain, the analysis of uncertainties in tempera- ture projections will not be shown here. When consider- ing the number of members that projected positive or negative values of change, there was agreement in all MRI/JMA model members: changes over the study re- gion will be positive (not shown). In this case, changes between future and present were calculated as the differ- ence between each future simulation and the present cli- mate ensemble (3 members). Copyright © 2012 SciRes. ACS 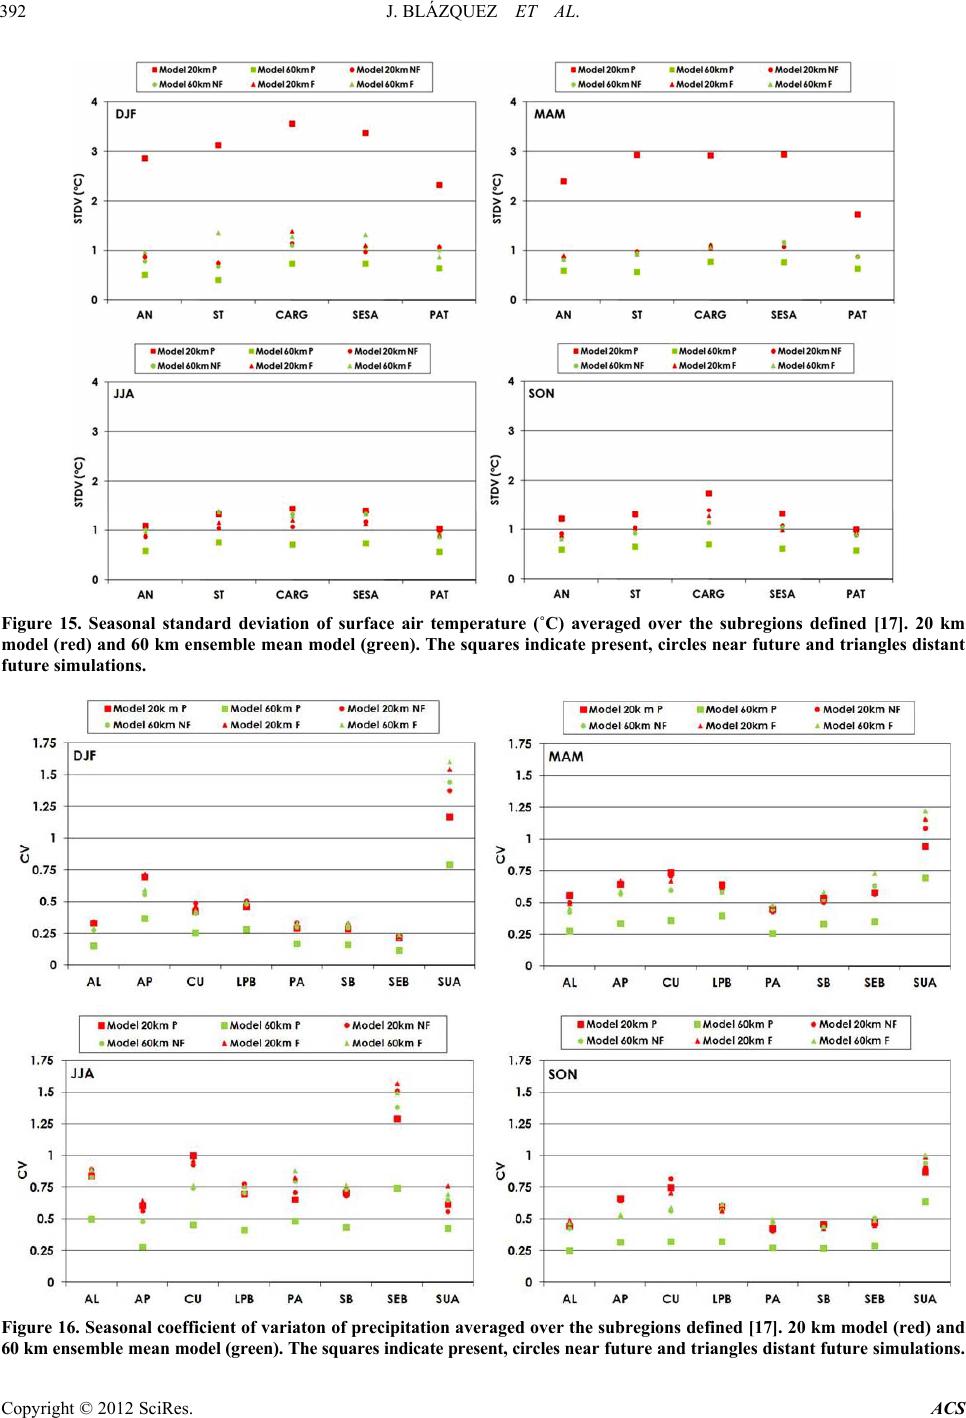 J. BLÁZQUEZ ET AL. 392 Figure 15. Seasonal standard deviation of surface air temperature (˚C) averaged over the subregions defined [17]. 20 km model (red) and 60 km ensemble mean model (green). The squares indicate present, circles near future and triangles distant future simulations. Figure 16. Seasonal coefficient of variaton of precipitation averaged over the subregions defined [17]. 20 km model (red) and 60 km ensem b le m e an model (green). The squares indicate present, circles near fu t ur e a nd t ri an g le s di st a nt fut u re s im u la t ion s. Copyright © 2012 SciRes. ACS 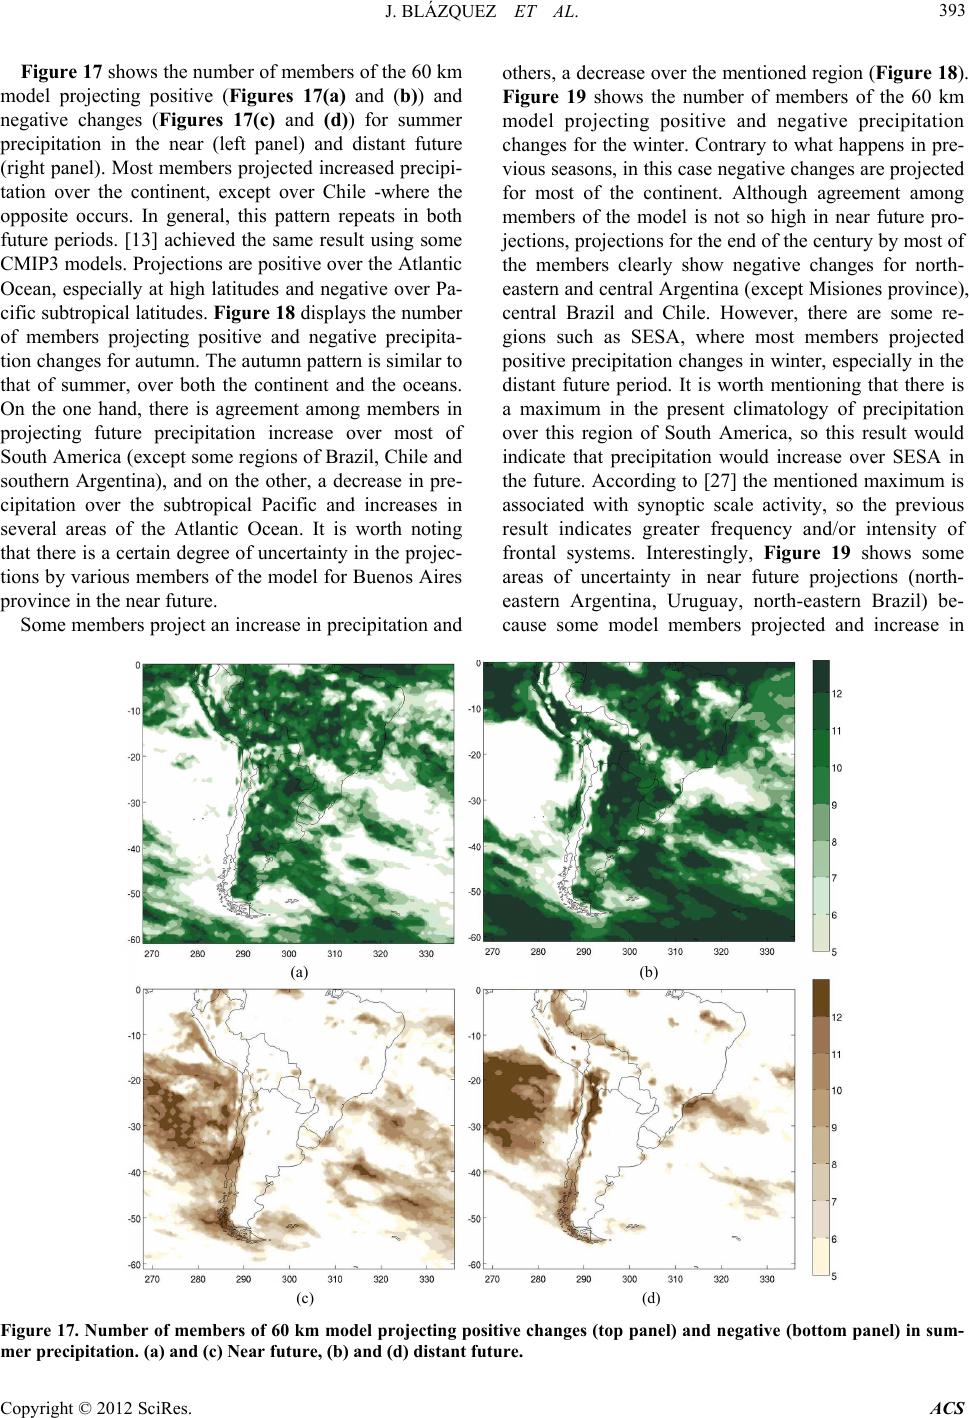 J. BLÁZQUEZ ET AL. 393 Figure 17 shows the number of members of the 60 km model projecting positive (Figures 17(a) and (b)) and negative changes (Figures 17(c) and (d)) for summer precipitation in the near (left panel) and distant future (right panel). Most members projected increased precipi- tation over the continent, except over Chile -where the opposite occurs. In general, this pattern repeats in both future periods. [13] achieved the same result using some CMIP3 models. Projections are positive over the Atlantic Ocean, especially at high latitudes and negative over Pa- cific subtropical latitudes. Figure 18 displays the number of members projecting positive and negative precipita- tion changes for autumn. The autumn pattern is similar to that of summer, over both the continent and the oceans. On the one hand, there is agreement among members in projecting future precipitation increase over most of South America (except some regions of Brazil, Chile and southern Argentina), and on the other, a decrease in pre- cipitation over the subtropical Pacific and increases in several areas of the Atlantic Ocean. It is worth noting that there is a certain degree of uncertainty in the projec- tions by various members of the model for Buenos Aires province in the near future. Some members project an increase in precipitation and others, a decrease over the mentioned region (Figure 18). Figure 19 shows the number of members of the 60 km model projecting positive and negative precipitation changes for the winter. Contrary to what happens in pre- vious seasons, in this case negative changes are projected for most of the continent. Although agreement among members of the model is not so high in near future pro- jections, projections for the end of the century by most of the members clearly show negative changes for north- eastern and central Argentina (except Misiones province), central Brazil and Chile. However, there are some re- gions such as SESA, where most members projected positive precipitation changes in winter, especially in the distant future period. It is worth mentioning that there is a maximum in the present climatology of precipitation over this region of South America, so this result would indicate that precipitation would increase over SESA in the future. According to [27] the mentioned maximum is associated with synoptic scale activity, so the previous result indicates greater frequency and/or intensity of frontal systems. Interestingly, Figure 19 shows some areas of uncertainty in near future projections (north- eastern Argentina, Uruguay, north-eastern Brazil) be- cause some model members projected and increase in (a) (b) (c) (d) Figure 17. Number of members of 60 km model projecting positive changes (top panel) and negative (bottom pane l) in sum- mer precipitation. (a) and (c) Near future, (b) and (d) distant future. Copyright © 2012 SciRes. ACS 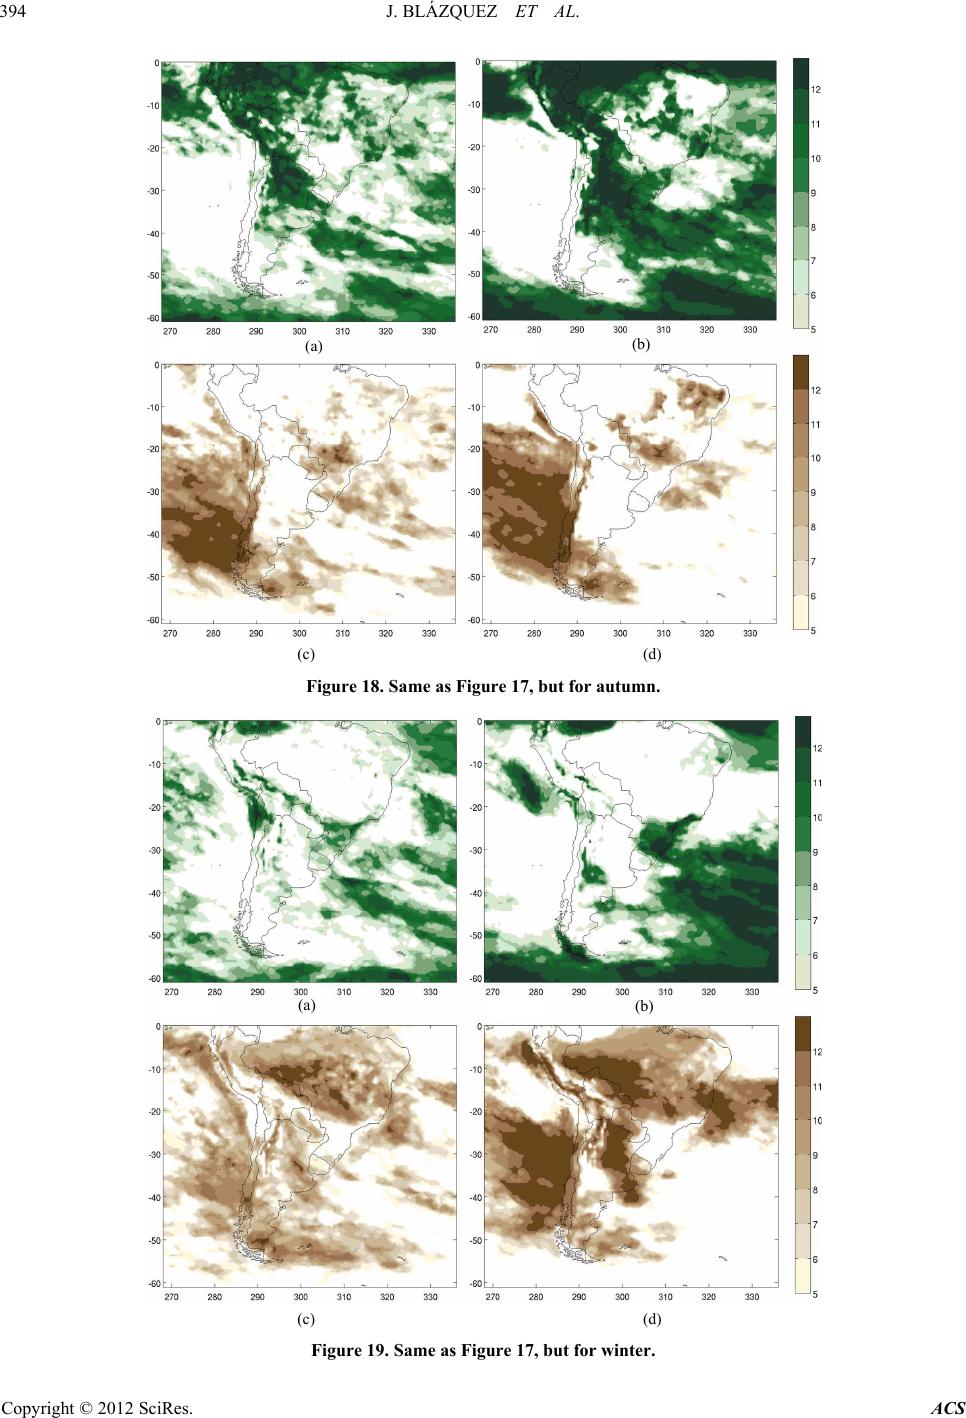 J. BLÁZQUEZ ET AL. 394 (a) (b) (c) (d) Figure 18. Same as Figure 17, but for autumn. (a) (b) (c) (d) Figure 19. Same as Figure 17, but for winter. Copyright © 2012 SciRes. ACS 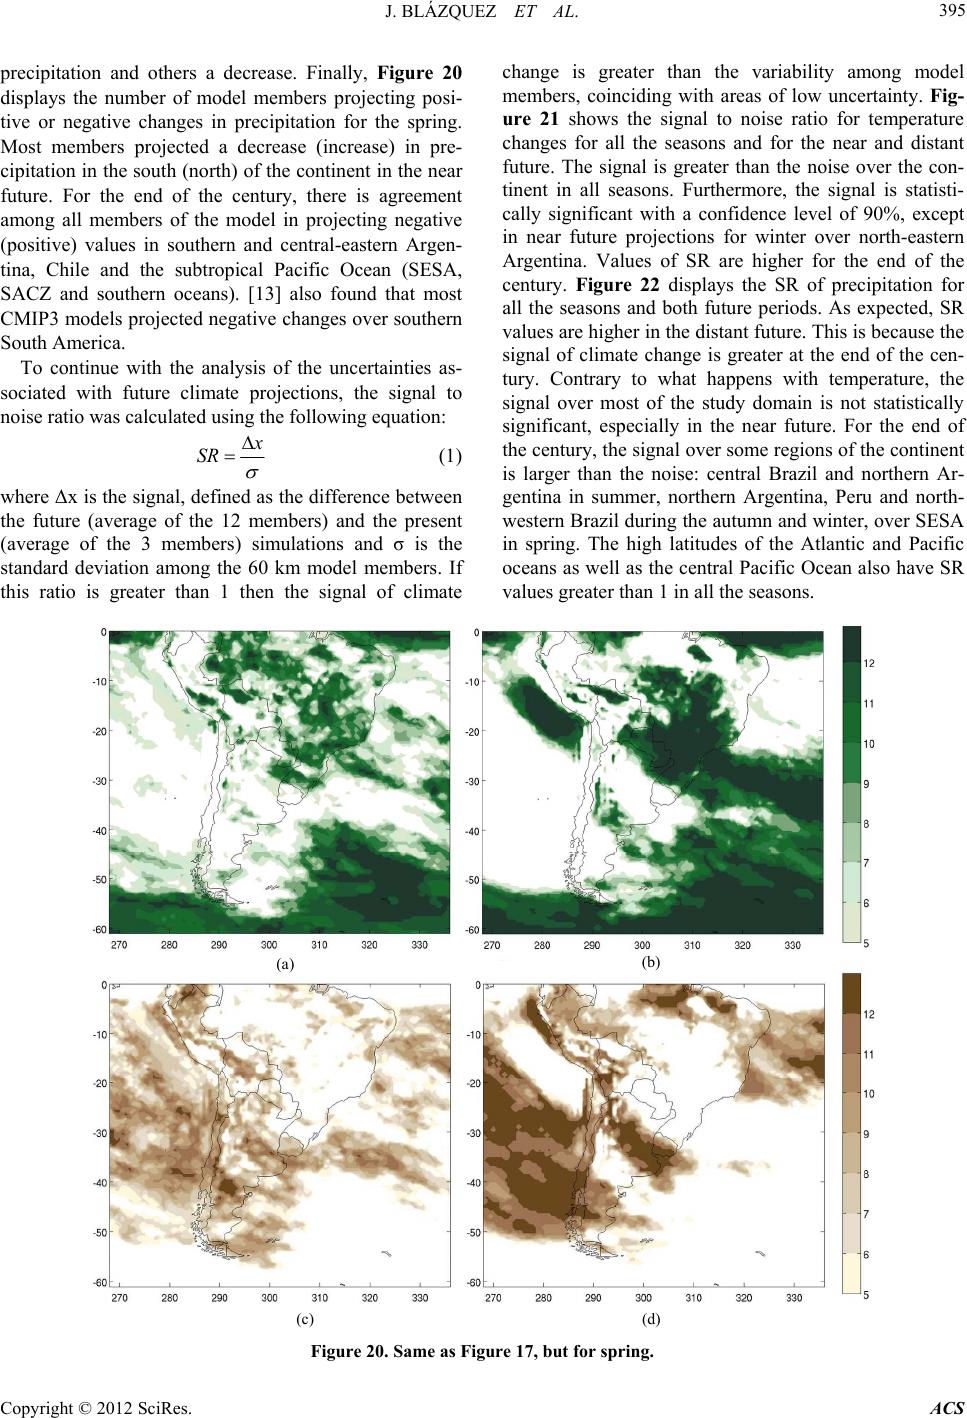 J. BLÁZQUEZ ET AL. ACS 395 precipitation and others a decrease. Finally, Figure 20 displays the number of model members projecting posi- tive or negative changes in precipitation for the spring. Most members projected a decrease (increase) in pre- cipitation in the south (north) of the continent in the near future. For the end of the century, there is agreement among all members of the model in projecting negative (positive) values in southern and central-eastern Argen- tina, Chile and the subtropical Pacific Ocean (SESA, SACZ and southern oceans). [13] also found that most CMIP3 models projected negative changes over southern South America. To continue with the analysis of the uncertainties as- sociated with future climate projections, the signal to noise ratio was calculated using the following equation: Copyright © 2012 SciRes. SR (1) where Δx is the signal, defined as the difference between the future (average of the 12 members) and the present (average of the 3 members) simulations and σ is the standard deviation among the 60 km model members. If this ratio is greater than 1 then the signal of climate change is greater than the variability among model members, coinciding with areas of low uncertainty. Fig- ure 21 shows the signal to noise ratio for temperature changes for all the seasons and for the near and distant future. The signal is greater than the noise over the con- tinent in all seasons. Furthermore, the signal is statisti- cally significant with a confidence level of 90%, except in near future projections for winter over north-eastern Argentina. Values of SR are higher for the end of the century. Figure 22 displays the SR of precipitation for all the seasons and both future periods. As expected, SR values are higher in the distant future. This is because the signal of climate change is greater at the end of the cen- tury. Contrary to what happens with temperature, the signal over most of the study domain is not statistically significant, especially in the near future. For the end of the century, the signal over some regions of the continent is larger than the noise: central Brazil and northern Ar- gentina in summer, northern Argentina, Peru and north- western Brazil during the autumn and winter, over SESA in spring. The high latitudes of the Atlantic and Pacific oceans as well as the central Pacific Ocean also have SR values greater than 1 in all the seasons. (b) (a) (c) (d) Figure 20. Same as Figure 17, but for spring. 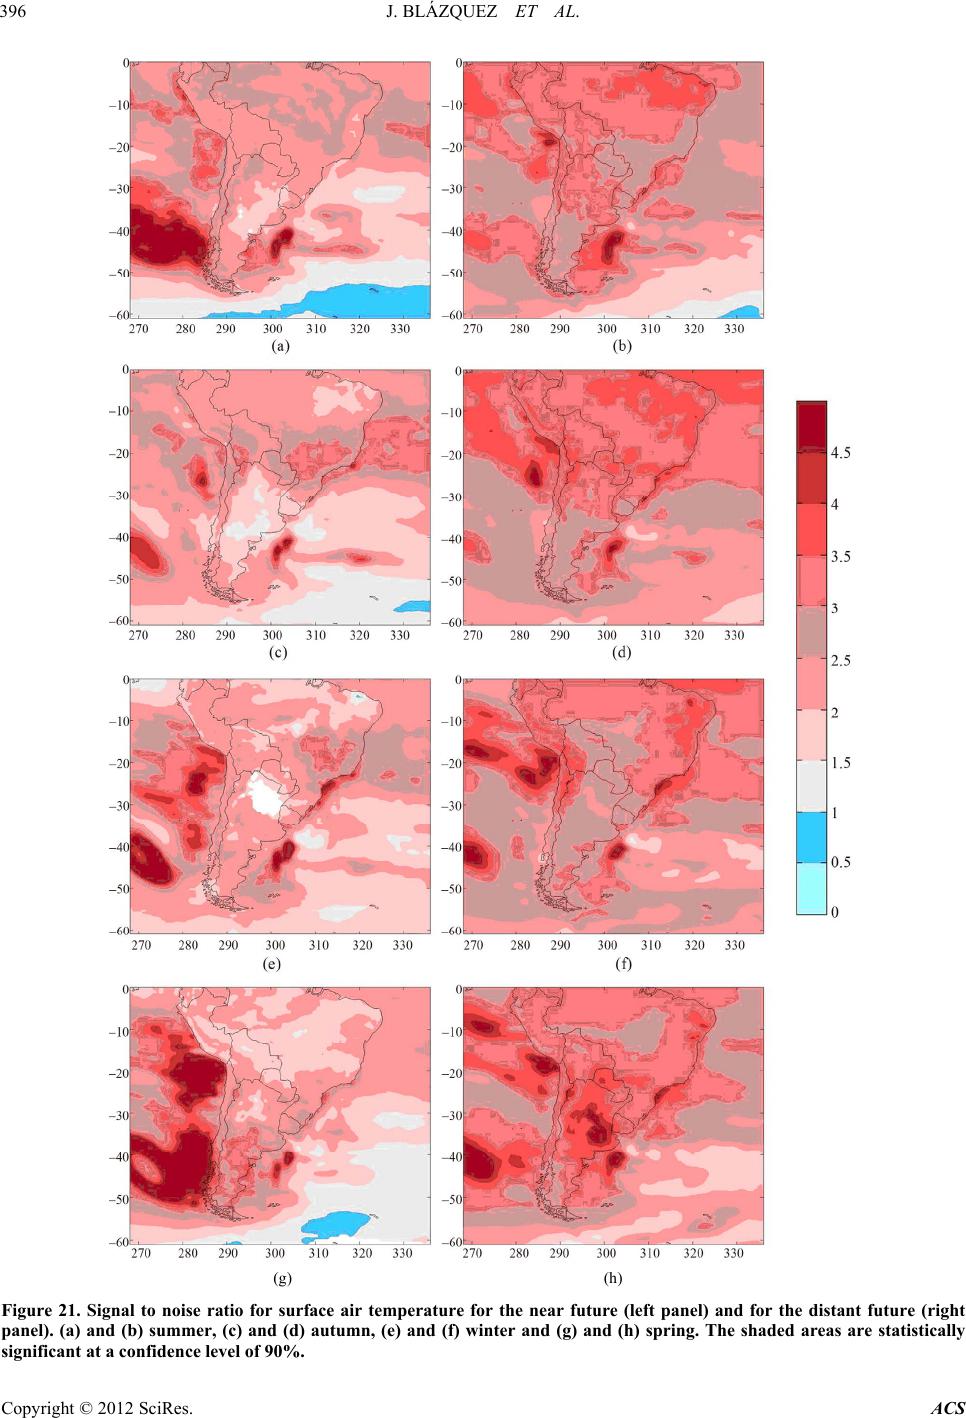 J. BLÁZQUEZ ET AL. 396 (g) (h) Figure 21. Signal to noise ratio for surface air temperature for the near future (left panel) and for the distant future (right panel). (a) and (b) summer, (c) and (d) autumn, (e) and (f) winter and (g) and (h) spring. The shaded areas are statistically significant at a confidence level of 90%. Copyright © 2012 SciRes. ACS 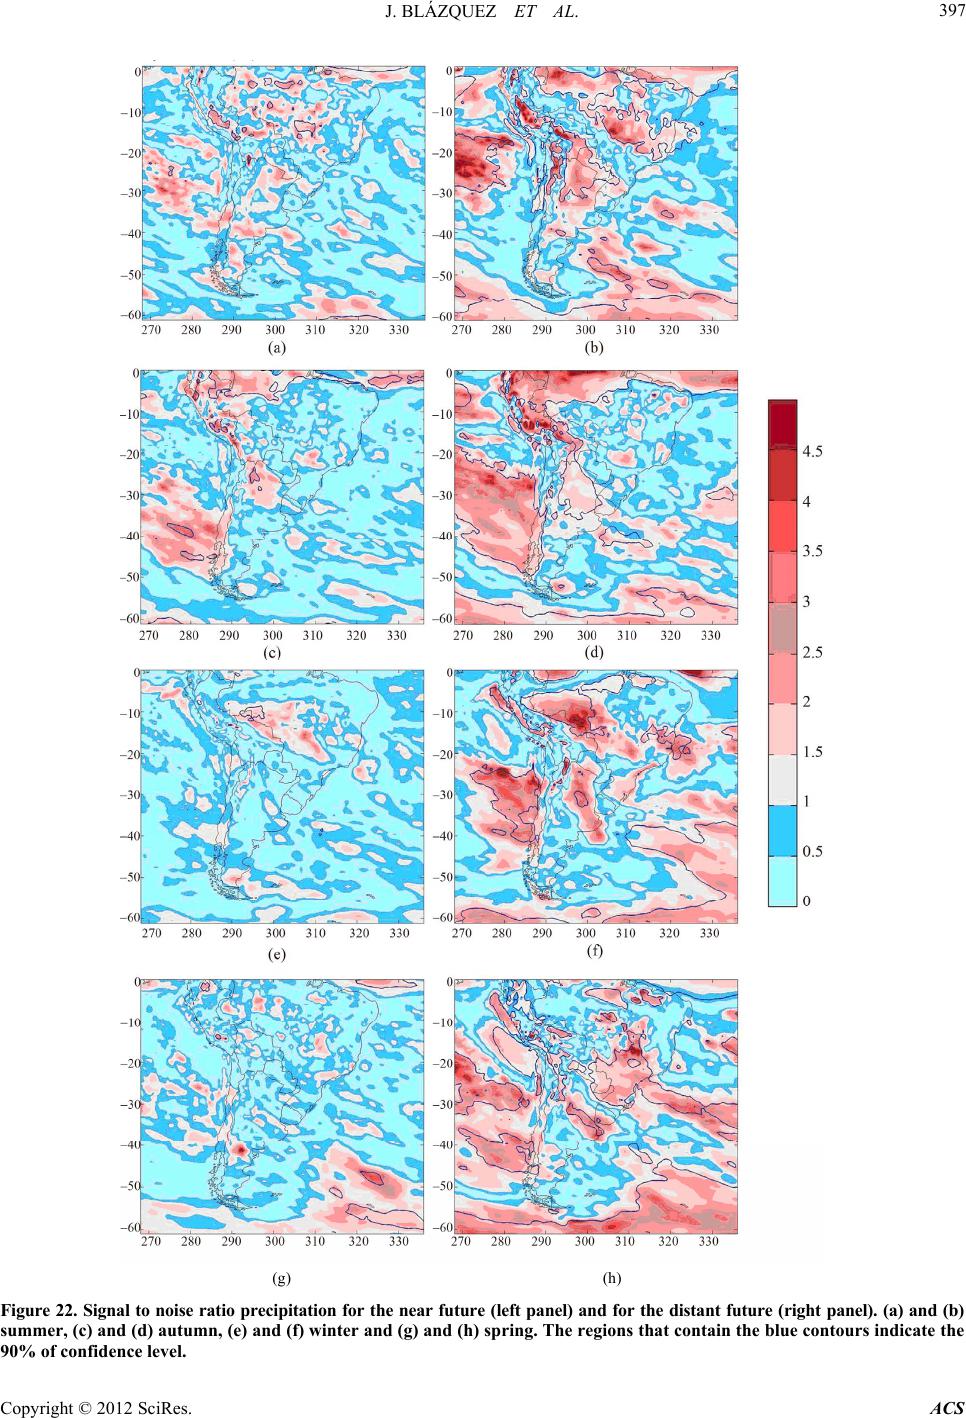 J. BLÁZQUEZ ET AL. 397 (g) (h) Figure 22. Signal to noise ratio precipitation for the near future (left panel) and for the distant future (right panel). (a) and (b) summer, (c) and (d) autumn, (e) and (f) winter and (g) and (h) spring. The regions that contain the blue contours indicate the 90% of confidence level. Copyright © 2012 SciRes. ACS  J. BLÁZQUEZ ET AL. Copyright © 2012 SciRes. ACS 398 The above allows concluding that uncertainty in pro- jected temperature changes is less than in precipitation change projections. Indeed, all members of the 60 km model agree in projecting temperature rise in the future in the entire domain under study. Furthermore, projec- tions of the near future have more uncertainty because the climate change signal is not as clear as it is in the end of the 21st century. 5. Conclusions This paper discusses future climate projections over South America. Changes were analysed in mean climate and in interannual variability of temperature and precipi- tation. Uncertainties in 60 km model projections were also analysed. Regarding temperature, positive changes were found (for both the near and distant future) for all the seasons in both models. The biggest changes were projected for tropical and subtropical latitudes. In all seasons, tem- perature is projected to rise up to 3˚C in the Andes, and between 2.5˚C and 3˚C in the Amazon in the end of the 21st century. The temperature rise for the winter over the Andes was also documented by [4] and [9]. Most pro- jected changes in mean seasonal temperature were statis- tically significant. The annual cycle of temperature re- flected the seasonal mean, with positive values of change in all the subregions analysed. In addition, the 20 km model presented higher values of change than the 60 km ensemble. A reason for this may be that the average of the members of the 60 km model ensemble tends to smooth the changes in the annual cycle. Projected precipitation changes are positive or nega- tive depending on the season and the region analysed. In summer, the changes projected by both models were positive in most of the continent, with the highest values (around 2 mm/day) projected over the Amazon, the northern Andes, the SACZ, Paraguay and northern Ar- gentina in the end of the century. Negative values were found over southern Chile. The positive change projected for northern Argentina may be associated with the southward shift of the Atlantic high and the associated intensification of the LLJ and the Chaco low. Changes in these circulation patterns lead to an increase in the mois- ture transport from the Amazon to northern Argentina [4,9,14], which would explain the increase in summer precipitation over that region. In autumn, southern and central Chile presented negative values (up to –2 mm/day) and the highest positive values were found in the end of the century over the northwest of the continent and northern Argentina (1 - 2 mm/day). Regarding changes in winter precipitation, the highest values were found in southern and central Chile. The higher resolution model projected positive changes in the south of Chile (above 2 mm/day) and negative in central Chile (up to –1.5 mm/day), while only the negative changes for central Chile were projected by the 60 km ensemble. This indicates a decrease in precipitation over the north of the area of the current climatological maxi- mum and an increase in the south. This result is in agreement with those of [4] and might be explained by the southward shift of the Pacific Ocean storm-track. The rest of the continent presents small negative values of change (–0.5 - –1 mm/day). For spring, models project significant positive changes over SESA in the distant future (greater than 1.5 mm/day in the 20 km model pro- jections). Major changes are expected in the annual cycle of precipitation in the rainy season of each subregion, with negative changes over SUA in winter and positive changes over LPB in transition seasons. In general changes in the annual cycle of precipitation were not statistically significant. In the La Plata Basin region, an increase in the values of P-E is projected for the warm season (which coincides with the rainy season of the re- gion). This increase in P-E will enhance runoff (river discharge and/or soil moisture), which may have effects on human activities given the relevance of this region in terms of economic and population development. Regarding interannual variability of temperature, the 20 km model (60 km ensemble) projected a decrease (increase) in variability in all the seasons and subregions. However, for precipitation, the 60 km ensemble pro- jected an increase in year-to-year variability in all the subregions considered and the 20 km model projected higher or lower values depending on the season and the subregion analysed. It should be noted that in general not great changes in values of interannual variability of both variables were observed in the MRI/JMA model projec- tions. This behaviour could be attributed to the method used to obtain SST datasets, which takes into account the present climate variability to initialise future simulations. The uncertainties associated to the initial conditions of the 60 km model were also assessed in this study. For summer, most members projected an increase in precipi- tation over the continent, except over Chile in the end of the century. For the South Atlantic Ocean most model members projected positive changes, while at subtropical latitudes of the Pacific Ocean projected changes were negative. In autumn, the areas with less uncertainty were found over most of South America (positive changes in precipitation across the continent except Chile, part of Brazil and southern Argentina); on the Pacific subtropi- cal (negative changes); south and north Atlantic (positive changes). In winter, most members of the ensemble pro- jected negative changes in precipitation for the end of the century, except for SESA, where most model simulations projected positive changes. In spring, regions with less uncertainty in near future projections were located over north-central and southern Argentina, Chile and mid-  J. BLÁZQUEZ ET AL. 399 latitude of the Pacific Ocean (negative values of change) and SESA, central Brazil and southern Atlantic and Pa- cific oceans (positive values of change). The analysis of the signal to noise ratio of mean tem- perature showed low uncertainty in the projections for both the near and distant future, since most of the SR values were greater than 1 and statistically significant. Precipitation showed the opposite behaviour. Few re- gions were identified where the signal was statistically significant and greater than the noise in the end of the century: central Brazil and northern Argentina in summer, northern Argentina, Peru and north-western Brazil in autumn and winter, over SESA in spring, the southern oceans and central Pacific Ocean in all seasons. These results support two claims. On one hand, projections of temperature changes presented less uncertainty than those of precipitation and on the other; the greatest un- certainty was found in the near future, where the signal of climate change was not as obvious as at the end of the century. This result indicates that the internal variability of the atmosphere is equally important as the climate change signal in the first decades of the 21st century and this leads to an increase in the uncertainty of projections. 6. Acknowledgements The authors thank the Meteorological Research Institute for providing the model data. This study was partially supported by UBACYT-1028, PIP CONICET 112- 200801-00195 and CLARIS-LPB (A Europe-South America Network for Climate Change Assessment and Impact Studies in La Plata Basin). REFERENCES [1] J. Blázquez and M. N. Nuñez, “Performance of a High Resolution Global Model over Southern South America,” International Journal of Cliamtology, Early View (Online Version of Record Published before Inclusion in an Issue), 2012. doi:10.1002/joc.3478 [2] R. Garreaud and M. Falvey, “The Coastal Winds off Western Subtropical South America in Future Climate Scenarios,” International Journal of Climatology, Vol. 29, No. 4, 2008, pp. 543-554. doi:10.1002/joc.1716 [3] W. Soares and J. Marengo, “Assessments of Moisture Fluxes East of the Andes in South America in a Global Warming Scenario,” International Journal of Climatol- ogy, Vol. 29, No 10, 2008, pp. 1395-1414. doi:10.1002/joc.1800 [4] M. N. Nuñez, S. A. Solman and M. F. Cabré, “Regional Climate Change Experiments over Southern South Amer- ica. II: Climate Change Scenarios in the Late Twenty- First Century,” Climate Dynamics, Vol. 32, No. 7-8, 2009, pp. 1081-1095. doi:10.1007/s00382-008-0449-8 [5] J. A. Marengo, T. Ambrizzi, R. P. Rocha, L. M. Alves, S. V. Cuadra, M. C. Valverde, S. E. T. Ferraz, R. R. Torres and D. C. Santos, “Future Change of Climate in South America in the Late XXI Century: Intercomparison of Scenarios from Three Regional Climate Models,” Climate Dynamics, Vol. 33, No. 6, 2009, pp. 1073-1097. doi:10.1007/s00382-009-0721-6 [6] J. A. Marengo, R. Jones, L. M. Alves and M.-C. Valverde, “Future Change of Temperature and Precipitation Ex- tremes in South America as Derived from the PRECIS Regional Climate Modeling System,” International Jour- nal of Climatology, Vol. 29, No. 15, 2009, pp. 2241-2255. doi:10.1002/joc.1863 [7] R. Urrutia and M. Vuille, “Climate Change Projections for the Tropical Andes Using a Regional Climate Model: Temperature and Precipitation Simulations for the End of the 21st Century,” Journal of Geophysical Research, Vol. 114, No. D02108, 2009, 15 pp. doi:10.1029/2008JD011021 [8] M. F. Cabré, S. Solman and M. N. Nuñez, “Creating Re- gional Climate Change Scenarios over Southern South America for the 2020’s and 2050’s Using the Pattern Scaling Technique: Validity and Limitations,” Climatic Change, Vol. 98, No. 3-4, 2010, pp. 449-469. doi:10.1007/s10584-009-9737-5 [9] J. A. Marengo, S. C. Chou, G. Kay, L. M. Alves, J. F. Pesquero, W. R. Soares, D. C. Santos, A. A. Lyra, G. Sueiro, R. Betts, D. J. Chagas, J. L. Gomes, J. F. Busta- mante and P. Tavares, “Development of Regional Future Climate Change Scenarios in South America Using the Eta CPTEC/HadCM3 Climate Change Projections: Cli- matology and Regional Analyses for the Amazon, São Francisco and the Paraná River Basins,” Climate Dynam- ics, Vol. 38, No. 9-10, 2011. doi:10.1007/s00382-011-1155-5 [10] L. C. Labraga and M. Lopez M, “A Comparison of the Climate Response to Increased Carbon Dioxide Simulated by General Circulation Models with Mixed-Layer and Dynamic Ocean Representations in the Region of South America,” International Journal of Climatology, Vol. 17, No. 15, 1997, pp. 1635-1650. doi:10.1002/(SICI)1097-0088(199712)17:15<1635::AID- JOC223>3.0.CO;2-G [11] A. F. Carril, C. G. Menéndez and M. N. Nuñez, “Climate Change Scenarios over the South American Region: An Intercomparison of Coupled General Atmosphere-Ocean Circulation Models,” International Journal of Climatol- ogy, Vol. 17, No. 15, 1997, pp. 1613-1633. doi:10.1002/(SICI)1097-0088(199712)17:15<1613::AID- JOC209>3.0.CO;2-8 [12] M. Bidegain and I. Camilloni, “Performance of GCMs and Climate Future Scenarios for Southeastern South America,” Proceedings 8th International Conference on Southern Hemisphere Meteorology and Oceanography, Foz do Iguaçu, 24-28 April 2006, pp. 223-226. [13] C. Vera, G. Silvestri, B. Liebmann and P. Gonzalez, “Climate Change Scenarios for Seasonal Precipitation in South America from IPCC-AR4 Models,” Geophysical Research Letters, Vol. 33, No. L13707, 2006, 4 pp. doi:10.1029/2006GL025759 [14] A. Kitoh, S. Kusunoki and T. Nakaegawa, “Climate Copyright © 2012 SciRes. ACS  J. BLÁZQUEZ ET AL. Copyright © 2012 SciRes. ACS 400 Change Projections over South America in the Late 21st Century with the 20 and 60 km Mesh Meteorological Re- search Institute Atmospheric General Circulation Model (MRI-AGCM),” Journal of Geophysical Research, Vol. 116, No. D06105, 2011, 21 pp. doi:10.1029/2010JD014920 [15] R. Mizuta, Y. Adachi, S. Yukimoto and S. Kusunoki S, “Estimation of the Future Distribution of Sea Surface Temperature and Sea Ice Using the CMIP3 Multi-Model Ensemble Mean,” Technical Reports, Meteorological Re- search Institute, Tsukuba, 2008. [16] N. Nakicenovic, J. Alcamo, G. Davis, B. de Vries, J. Fenhann, S. Gaffin, K. Gregory, A. Grübler, T. Y. Jung, T. Kram, E. Lebre La Rovere, L. Michaelis, S. Mori, T. Morita, W. Pepper, H. Pitcher, L. Price, K. Riahi, A. Roehrl, H. H. Rogner, A. Sankovski, M. Schlesinger, P. Shukla, S. Smith, R. Swart, S. van Rooijen, N. Victor and Z. Dadi, “Special Report on Emissions Scenarios,” Cam- bridge University Press, Cambridge, 2000. [17] S. A. Solman, M. N. Nuñez and M. F. Cabré, “Regional Climate Change Experiments over Southern South Amer- ica. I: Present Climate,” Climate Dynamics, Vol. 30, No. 5, 2008, pp. 533-552. doi:10.1007/s00382-007-0304-3 [18] I. Camilloni, “Climatic Trends,” In: V. Barros, A. Mené- ndez and G. Nagy, Eds., Climate Change in the La Plata River, Research Centre for Sea and Atmosphere (CIMA), Buenos Aires, 2005, 200 pp. [19] A. Di Luca, I. Camilloni and V. Barros, “Sea-level pres- sure patterns in South America and the adjacent oceans in the IPCC AR4 models,” Proceedings 8th International Conference on Southern Hemisphere Meteorology and Oceanography, Foz do Iguaçu, 24-28 April 2006, pp. 235-244. [20] R. W. Lee and K. I. Hodges, “A Comparison of Ex- tratropical Cyclones in CMIP5 Models,” Proceedings WCRP Open Science Conference, Denver, 24-28 October 2011. http://conference2011.wcrp-climate.org/abstracts/C34/Le e_C34_W212A.pdf [21] R. M. Caffera and E. H. Berbery, “La Plata Basin Clima- tology,” In: V. Barros, R. Clarke and P. S. Días, Eds., Climate Change in the la Plata Basin, Research Centre for Sea and Atmosphere (CIMA), Buenos Aires, 2006, 230 pp. [22] P. C. D. Milly, K. A. Dunne and A. V. Vecchia, “Global Pattern of Trends in Stream Discharge and Water Avail- ability in a Changing Climate,” Nature, Vol. 438, 2005, pp. 347-350. doi:10.1038/nature04312 [23] R. I. Saurral, “The Hydrologic Cycle of the La Plata Ba- sin in the WCRP-CMIP3 Multimodel Dataset,” Journal of Hydrometeorology, Vol. 11, No. 5, 2010, pp. 1083- 1102. doi:10.1175/2010JHM1178.1 [24] P. Aceituno, “On the Functioning of the Southern Oscil- lation in the South American Sector. Part I: Surface Cli- mate,” Monthly Weather Review, Vol. 116, No. 3, 1998, pp. 505-524. doi:10.1175/1520-0493(1988)116<0505:OTFOTS>2.0.C O;2 [25] A. M. Grimm, V. Barros and M. Doyle, “Climate Vari- ability in Southern South America Associated with El Niño and La Niña Events,” Journal of Climate, Vol. 13, No. 1, 2000, pp. 35-58. doi:10.1175/1520-0442(2000)013<0035:CVISSA>2.0.C O;2 [26] V. Barros and G. E. Silvestri, “The Relation between Sea Surface Temperature at the Subtropical South-Central Pa- cific and Precipitation in Southeastern South America,” Journal of Climate, Vol. 15, No. 3, 2002, pp. 251-267. doi:10.1175/1520-0442(2002)015<0251:TRBSST>2.0.C O;2 [27] C. Vera, P. K. Vigliarolo and E. H. Berbery, “Cold Sea- son Synoptic-Scale Waves over Subtropical South Amer- ica,” Monthly Weather Review, Vo. 130, No. 3, 2002, pp. 684-699. doi:10.1175/1520-0493(2002)130<0684:CSSSWO>2.0.C O;2.
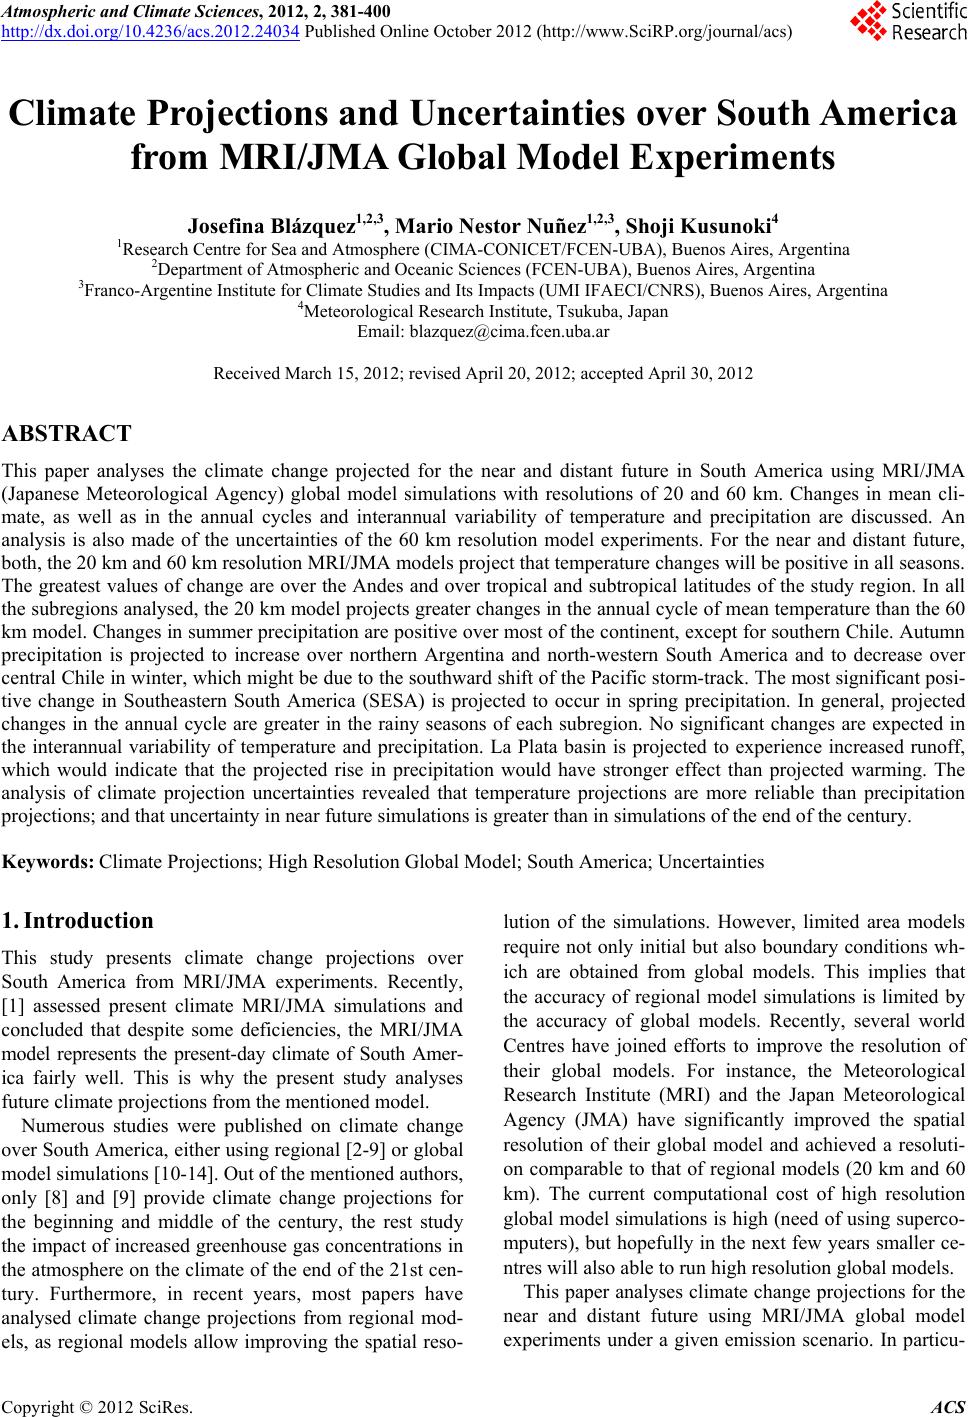
|