 Sociology Mind 2012. Vol.2, No.4, 373-381 Published Online October 2012 in SciRes (http://www.SciRP.org/journal/sm) http://dx.doi.org/10.4236/sm.2012.24049 Copyright © 2012 SciRes. 373 Income Inequality in Transitional Urban China: The Effect of Market versus State Qiong Wu, Barry Goetz, David Hartmann, Yuan-Kang Wang Department of Sociology, Western Michigan University, Kalamazoo, USA Email: qiong.wu@wmich.edu Received July 2nd, 2012; revised August 4th, 2012; accepted August 13th, 2012 The rise of inequality in China is one of the most serious social problems in the reform era in China. Pre- vious studies have debated the relative importance of human capital, political capital, and other factors in determining personal income. Using a new dataset from 2006 China General Social Survey (CGSS, 2006), the first author replicates earlier tests to measure whether the market or state has more impact on incomes as a way to the competing hypotheses related to human versus political capital. The results of the ordinary least squares regression analysis show no significance in party membership, state ownership, and work experience, while the first author does find high returns to education, which supports Nee’s market transi- tion theory. Moreover, the findings indicate that market sectors, including domestic private enterprises and foreign enterprises have remarkable advantages in earnings, and there is a great income gap between different regions, sectors, and within the sectors. To summarize, the market and state play a dual role in determining income in transitional urban China. Keywords: Income Inequality; Urban China; Market Effect; State Effect Introduction China’s Communist Revolution was founded upon the idea of equality of wealth. In pre-reform China, the society was relatively equal in income distribution and resource allocation. Since 1978, China has been carrying out a transformation from a socialist planned economy to market economy, along with a great social change from relative social egalitarianism to a new era of individualism and competition under the market mecha- nism. Sir Arthur Lewis said, “development must be inegalitarian because it does not start in every part of the economy at the same time” (Lewis, 1976: p. 26). In terms of China, the gov- ernment has started a policy to allow and encourage some peo- ple to get rich first and some regions to develop quickly, and coastal and urban areas obtained the priority to develop first and faster. As a result, the income gap between the rich and poor, between urban and rural areas, and between different regions has become larger. Compared to the pre-reform era, though inequalities have in- creased dramatically between workers and professionals, east- ern-coastal regions and western regions, “under a market sys- tem, everyone ostensibly has an opportunity to try for better jobs and income” (Tang & Parish, 2000: p. 51). Chinese soci- ety has become more diverse. Specialization helps build a more organic society, in which an individual’s needs are served by markets, rather than by the state. However, according to the survey results from the national China Household Income Project 2002, 81.5% of people think that the current situation on income distribution is not fair, and the 2006 China General Social Survey also indicated that over 50% of the respondents feel unfair about the income distribu- tion. People’s attitude towards the unfairness of income distri- bution, to some extent, reflects income inequality in China that ordinary people feel the widen gap between the rich and the poor, the urban-rural divide, between different social classes, and different regions. The income gap has become the most serious social problem in current China, far ahead of crime and corruption, which rank in second and third place based on a survey in 2004 (Xinhua, 2004). In studies of social change and problems in the societal transformation in the state socialism, there are three contradic- tory theories regarding social transformation in post-socialist societies: 1) continuing bureaucratic politics (power continuity; 2) market transformation (structural transformation); 3) the mix solution of technocratic continuity (Tang & Parish, 2000: p. 83). Nee’s market transition theory argues that “higher returns of education, which is among the best indicators of human pro- ductivity” (Nee, 1989: p. 666). The thesis of “power persis- tence” (Bian & Logan, 1996) contends that political power of party cadres can be transformed into economic advantages on the course of the transition to a market economy. The politi- cally-based privilege is still “deeply embedded in the economic situation” (p. 741). The argument of technocratic continuity suggests that the old technocratic managers with specialized skills would regain their advantages in the socialist economy and emerging as the new entrepreneurs in the market economy. The technocratic cadres “can maintain their positions through the acquired expertise” (Rona-Tas, 1994: p. 45). Based on the literature, the whole theoretical debate comes down to considering competing hypotheses whether human capital or political capital is more important in determining personal income in urban China. Human capital include educa- tion, work experience, skills, parental education, etc. Political capital refer to party membership, working in the state sector, government and other power agencies, parental party member- ship, social contact that can get access to political capital. My  Q. WU ET AL. research hypotheses are as follows: Hypothesis 1: Human capital is the best indicator of income China today. In other words, higher educational credentials and more work experience will lead to higher earnings. Hypothesis 2: Political capital (party membership) remains the best predictor of income in China today. “Communist Party membership continues to yield an income advantage to workers and workers whose jobs hold redistribu- tive power earn more” according to Bian and Logan’s (1996) analysis on survey conducted in Tianjin, China in 1988 and 1993. Bian, Shu, and Logan (2001) also found that during the post-1978 reform era, “party membership had a significant effect on mobility into elite positions of political and manage- rial authority, and college education increased party members’ chances of moving into positions of political authority but not into managerial positions within the state sector” (p. 832). Hypothesis 3: The role of work unit sector and state owner- ship remains significant in determining income. With an analysis of data survey collected in Shanghai, Xi’an and Wuhan in 1999, Xie and Wu (2008) indicates that “the danwei (work unit) continues to play a very important role in determining the economic well-being” (p. 13), and it still serves as “a major agent of social stratification in urban China” (p. 6). In this paper, the first author addresses the issue of the theo- retical debate in the literature on the research on social inequal- ity in China by using a newer and different national dataset from CGSS, 2006 as a way to the competing hypotheses related to human versus political capital. The fundamental questions in this study are focused on: 1) Do income returns more on politi- cal capital (party membership) or human capital (education and work experience)? 2) How do these changes related to trends in aggregate inequality? Data and Variables In this paper, the first author employs individual-level data from the urban samples of the 2006 China General Social Sur- vey (CGSS, 2006) under the joint sponsorship of Survey Re- search Center, Hong Kong University of Science and Technol- ogy, and Department of Sociology, Renmin University of China. The CGSS is an annual or biannual questionnaire survey of China’s urban and rural households. It aims to “monitor sys- tematically the changing relationship between social structure and quality of life in urban and rural China” (http://www.ust.hk/~websosc/survey/GSS_e.html). The survey program started from 2003, and the first dataset only covered the urban areas. In 2005, rural areas were added. The data of 2006 encompasses three sections: urban, rural and family ques- tionnaires. For this paper, the first author only used the urban data of 2006, for analysis. The surveys were conducted during September 2006 to Oc- tober 2006 with 1610 variables and 10,151 cases (6013 cases in urban areas). A multistage cluster sampling procedure selected 28 provinces and municipalities. The respondents are from the age of 18 to 69, in randomly selected 10,000 households in 28 provinces and cities nation-wide. The urban questionnaires contained personal general information, work experience, cur- rent work situation, family situation, and attitudes towards the society. In order to estimate the relationships between income distri- bution and several socio-demographic characteristics of indi- viduals, my analyses rely on OLS regression to predict total individual income in urban China. Table 1 lists all the variables used in the study. “Hukou” is a particular household registration system in China. Dating back about 2000 years ago, when Qin Dynasty united the whole China, and set up this household registration system to collect taxes according to the number of people. After the Communist Party established the People’s Republic of China, the Communist regime revived it in 1955 to keep poor rural farmers from flooding into the cities in case that the “ex- tensive rural-to-urban migration would undercut the attempt to develop an urban welfare state”. The “Hukou” registration sys- tem “classified each member of the population as having agri- cultural (rural) or nonagricultural (urban) status (Hukou), with a sharp differentiation of rights and privileges and extremely stringent conditions for converting from rural to urban status” (Wu & Treiman, 2004: p. 363). Due to the restriction of “Hukou”, those who move to large cities to work or study but do not have the local “Hukou” can- not enjoy all kinds of benefits as the citizens, and have to go back to their hometown to get a marriage license, apply for a passport or take the national university entrance exam. Rather, the “Hukou” system creates unfair advantages for those who live in large cities especially Beijing and Shanghai. Because in China, most highly regarded universities and hospitals locate in large cities, and those institutions provide more preferential policies to the local Hukou-holders. Moreover, most local en- terprises tend to favor in those who are local residents. Thus, those who have the urban “Hukou” of large cities tend to have advantages over those who are originally from smaller places. In pre-reform China, Chinese urban society was organized by each work unit dominated by the state. “In Chinese official statistics, the danwei1 or work unit is defined as an independent accounting unit with three characteristics: 1) administratively, it is an independent organization; 2) fiscally, it has an inde- pendent budget and produces its own accounting tables of earnings and deficits; 3) financially, it has independent ac- counts in banks and has legal rights to sign contracts with gov- ernment or business entities” (Bian, 1994: p. 23). The role of danwei or work unit was extremely significant that it defined one’s social, economic, and political life. Individuals depended on danwei for almost everything. Without a work unit, it was difficult to survive in a city because housing, food, and other social services were hardly available through the market. After the reform, with the emerging of private sector include- ing private enterprises, foreign companies, joint-ventures, and the self-employed, the role of danwei has lost some of its im- portance compared to the era of pre-reform, because through danwei is no longer the only way to get all social services, the market has made it more diverse. However, danwei does not disappear with the challenge of the market, and remains the main agent of social stratification in contemporary urban China. Except danwei or work unit, “ownership type has always been an important factor in determining income”, (Wang, 2008: p. 113). According to the questionnaire in CGSS, 2006, types of work unit and ownership are two separate but close-related questions. The types of work unit include government and party agencies, enterprises, institutions, social organizations, and individual operation or self-employed. Among these work or- 1“The term danwei or work unit refers to all work organizations in general, but was often used to refer to state economic enterprises in particular” (Wu, 2002: p. 1073). Copyright © 2012 SciRes. 374  Q. WU ET AL. Copyright © 2012 SciRes. 375 Table 1. Description of predictors for the analysis of individual income inequality in urban China. Variables Description Total income (income 2005) Personal yearly total income in 2005 (Yuan) Gender (gender) 1 = female; 2 = male Work experience (workexp) Work experience is measured by subtracting the end year of a job from the start year (in years) Education level (education) Education is measured by eight levels 1 = never schooled 2 = classes for eliminating illiteracy 3 = elementary School 4 = middle School 5 = high School 6 = junior college 7 = college/university 8 = graduate Foreign language skill (lanskill) Four categories: 1 = not at all 2 = know a little 3 = somewhat fluent 4 = very fluent Type of “Hukou” (“Hukou”) Four categories: 1 = urban “Hukou” in small cities/towns 2 = urban “Hukou” in middle cities 3 = urban “Hukou” in large cities (Municipalities and Provincial capital) 4 = rural “Hukou” Party membership (party) Two categories: 1 = member of communist party of China or communist youth league of China; 2 = non-communist party member (other parties or no party) Type of workplace (including danwei and other workplaces in the market sector) (workplace) 1 = government agencies and state-owned enterprises (SOEs) 2 = collective enterprises 3 = private enterprises 4 = foreign-invested enterprises (including Hong Kong, Macao, and Taiwan) 5 = institutions 6 = social organizations or public organizations 7 = other Geographic or residential location (location) 1 = eastern coastal regions 2 = central regions 3 = western regions Source: data from CGSS, 2006. ganizations, only those who answered enterprises and institu- tions have to answer the second question about the type of sec- tor or ownership. The options are state-owned, collective, pri- vate enterprises, enterprises from Hong Kong, Macao and Tai- wan, and foreign-invested or owned enterprises. Since all insti- tutions are government-sponsored, the first author combine the type of work unit and ownership into one variable Workplace to distinguish the different types of enterprises. I distinguish the following type of workplace in urban China: 1) Government agencies and SOEs, which include all levels of government and Communist party agencies and state- owned enterprises is the reference group. 2) Collective enterprises are not directly supported by the state but are mostly sponsored by local governments. 3) Private enterprises include private firms and individual operation or self-employed. 4) Foreign enterprises include foreign-owned, foreign-invested companies and the enterprises from Hong Kong, Macao, and Taiwan. 5) Institutions or public institutions include schools, research institutions, libraries, museums, hospitals and publishing houses, are the backbone of public service providers in China. 6) Social organizations or public organizations are sets of as- sociations emerged in the late 1980s with official encour- agement, consisting of genuine NGOs and government-or- ganized NGOs. 7) Others. Residential location is a control variable that the first author will use in the analysis. In the survey data, it covers all the provinces and municipalities in China except Qinghai, Tibet and Ningxia, which are all located in the west. The first author recoded the cities by geographical location into three categories: eastern coastal (=1), central (=2), and western regions (=3). In the study, the dependent variable is the natural logged personal total income in 2005. The independent variables in- clude gender, education level, foreign language skill, years of work experience, party membership, type of workplace, type of “Hukou” and residential location. The analyses rely on OLS regression to predict the total individual income in urban China. In the analysis, I attempt to find out “trends in the importance of individual-level earnings determinants and their cones- quences for trends in overall inequality” (Hauser & Xie, 2003: p. 52). Methods In order to estimate the relationships between the logged an-  Q. WU ET AL. nual income and several predictors including gender, work experience, education, foreign language skill, party member- ship, type of “Hukou”, geographical location, and workplace, my analyses rely on Ordinary Least Squares (OLS) regression to predict total individual income in urban China. Before developing a multiple regression, the first author did several preliminary analyses, including univariate descriptive analysis, bivariate scatterplots of the income with age and years of education. Table 2 summarizes the descriptive statistics of all the variables in the analysis (see Table 2). The mean of personal total yearly income in 2005 is 18383.343 RMB (yuan), the standard deviation is 23214.25. The mean of education level is 4.8378, which roughly reaches high school level, and the standard deviation is 1.185. The mean of level of foreign language skill is 1.5873 (approxima- tely the level of knowing a little of foreign language), and the standard deviation is .58826. Among all the respondents, there are 17.7% are members of the Communist Party of China or the Table 2. Descriptive statistics. N Mean Standard Deviation Standard Error Total Income 2005 3109 18383.343 23214.25416.336 Education Level 3109 4.8378 1.185 .0213 Foreign Language Skill 3109 1.5873 .58826.01055 N Percent Party Membership 1 = Communist Party & Communist Youth League 550 17.7 Gender 1 = male 1697 54.6 2 = female 1412 45.4 “Hukou” 1 = Small cities 844 27.1 2 = Middle cities 635 20.4 3 = Large cities 950 30.6 4 = Rural 680 21.9 Workplace 1 = Government Agencies and SOEs 1020 32.8 2 = Collective Enterprises 334 10.7 3 = Private Enterprises 993 31.92 4 = Foreign Enterprises 48 1.52 5 = Institutions 519 16.68 6 = Social Organizations 74 2.38 7 = Others 122 3.94 Residential Location 1 = Eastern Coastal Regions 1731 55.7 2 = Central Regions 880 28.3 3 = Western Regions 498 16 Note: used the results from averaging the five imputations. Source: data from CGSS, 2006. Communist Youth League, 82.3% are from other political par- ties, and those who do not belong to any parties. There are 54.6% of males, and 45.4% of females. For the type of “Hu- kou”, 27.1% are from small cities, 20.4% are from middle-size cities, 30.6% are from large cities, and 21.9% hold the rural “Hukou”. In terms of the type of work place, 32.8% of the re- spondents work at government agencies or state-owned enter- prises, 10.7% work at collective enterprises, 31.92% are em- ployed at private enterprises, 1.52% work for foreign enter- prises, 16.68% work at institutions, 2.38% work at social or- ganizations, and 3.94% work for other workplace. Then the first author ran the regression model and tested the residuals for normality, and found that the residuals of the de- pendent variable income are not normal distributed based on a significant Kolmogorov-Smirnov test. Accordingly, I logged income, and used lnincome as the dependent variable in subse- quent analyses. Though according to the residual of the regres- sion model using the natural logged income variable were still not perfectly normal distributed, the distribution looked much closer to normal. With only a slight departure from normality and a very large sample size, the first author is confident that the results of the regression analysis are robust. Then the first author generated new scatterplots with the logged income, and found a nonlinear relationship between logged income and years of work experience. Thus, the first author used curve estimation to check for the nonlinearity. By doing the curve fit analysis and incremental F-test between linear and quadratic models; the first author found that the quadratic model is the best in this case. After detecting and correcting for nonlinearity, I ran a regression and performed the White’s test for homoskedasticity and found that the first author needed to correct for heteroskedasticity using weighted least squares regression which yielded homoskedastic residuals. According to the results of collinearity diagnostics, all the indexes, including VIF, square root of VIF, Tolerance, Eigen- value, and condition index, show that there is no problem of multicollinearity when excluded the variable workexp. Results Having fulfilled all the assumptions of OLS regression and corrected for the violation, my regression now is the best linear unbiased estimator. Table 3 presents the main results from the final regression model with location as the control variable. From the table, we can see that the adjusted R2 is .2652, which indicates that 26.52% of the variation in logged income in 2005 is explained by the sets of independent variables. Also, R is .5192, which shows that there is a statistically significant and moderate rela- tionship between logged income in 2005 and the sets of inde- pendent variables (See Table 3). Table 3 also shows the coefficients of each independent variable. The unstandardized slope B for Education is .2136. Taking the antilog and multiplying by 100, shows that for each additional level of education, there is a 23.8 percent increase in earning. The unstandardized slope B for Lanskill is .0742. Tak- ing the antilog and multiplying by 100, shows that for each additional level of foreign language skill, there is a 7.7 percent increase in earnings. The unstandardized slope B for Female is –.2582. Taking the antilog and multiplying by 100, shows that females earn 22.8 percent less than males. The unstandardized slope B for Small is –.2654. Taking the antilog and multiply- Copyright © 2012 SciRes. 376 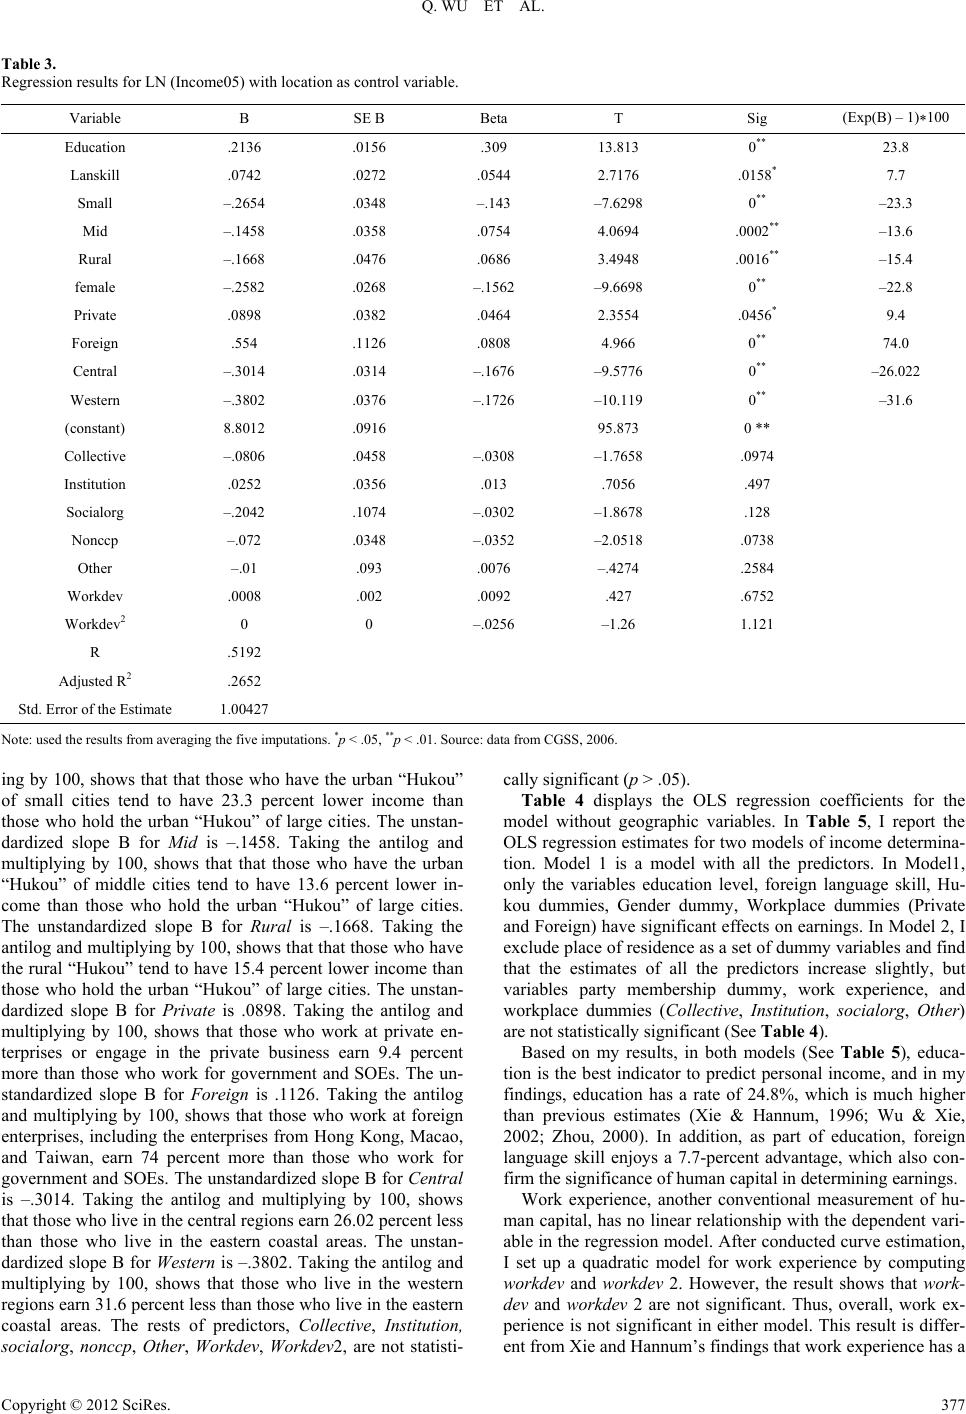 Q. WU ET AL. Copyright © 2012 SciRes. 377 Table 3. Regression results for LN (Income05) with location as control variable. Variable B SE B Beta T Sig (Exp(B) – 1)*100 Education .2136 .0156 .309 13.813 0** 23.8 Lanskill .0742 .0272 .0544 2.7176 .0158* 7.7 Small –.2654 .0348 –.143 –7.6298 0** –23.3 Mid –.1458 .0358 .0754 4.0694 .0002** –13.6 Rural –.1668 .0476 .0686 3.4948 .0016** –15.4 female –.2582 .0268 –.1562 –9.6698 0** –22.8 Private .0898 .0382 .0464 2.3554 .0456* 9.4 Foreign .554 .1126 .0808 4.966 0** 74.0 Central –.3014 .0314 –.1676 –9.5776 0** –26.022 Western –.3802 .0376 –.1726 –10.119 0** –31.6 (constant) 8.8012 .0916 95.873 0 ** Collective –.0806 .0458 –.0308 –1.7658 .0974 Institution .0252 .0356 .013 .7056 .497 Socialorg –.2042 .1074 –.0302 –1.8678 .128 Nonccp –.072 .0348 –.0352 –2.0518 .0738 Other –.01 .093 .0076 –.4274 .2584 Workdev .0008 .002 .0092 .427 .6752 Workdev2 0 0 –.0256 –1.26 1.121 R .5192 Adjusted R2 .2652 Std. Error of the Estimate 1.00427 Note: used the results from averaging the five imputations. *p < .05, **p < .01. Source: data from CGSS, 2006. ing by 100, shows that that those who have the urban “Hukou” of small cities tend to have 23.3 percent lower income than those who hold the urban “Hukou” of large cities. The unstan- dardized slope B for Mid is –.1458. Taking the antilog and multiplying by 100, shows that that those who have the urban “Hukou” of middle cities tend to have 13.6 percent lower in- come than those who hold the urban “Hukou” of large cities. The unstandardized slope B for Rural is –.1668. Taking the antilog and multiplying by 100, shows that that those who have the rural “Hukou” tend to have 15.4 percent lower income than those who hold the urban “Hukou” of large cities. The unstan- dardized slope B for Private is .0898. Taking the antilog and multiplying by 100, shows that those who work at private en- terprises or engage in the private business earn 9.4 percent more than those who work for government and SOEs. The un- standardized slope B for Foreign is .1126. Taking the antilog and multiplying by 100, shows that those who work at foreign enterprises, including the enterprises from Hong Kong, Macao, and Taiwan, earn 74 percent more than those who work for government and SOEs. The unstandardized slope B for Central is –.3014. Taking the antilog and multiplying by 100, shows that those who live in the central regions earn 26.02 percent less than those who live in the eastern coastal areas. The unstan- dardized slope B for Western is –.3802. Taking the antilog and multiplying by 100, shows that those who live in the western regions earn 31.6 percent less than those who live in the eastern coastal areas. The rests of predictors, Collective, Institution, socialorg, nonccp, Other, Workdev, Workdev2, are not statisti- cally significant (p > .05). Table 4 displays the OLS regression coefficients for the model without geographic variables. In Table 5, I report the OLS regression estimates for two models of income determina- tion. Model 1 is a model with all the predictors. In Model1, only the variables education level, foreign language skill, Hu- kou dummies, Gender dummy, Workplace dummies (Private and Foreign) have significant effects on earnings. In Model 2, I exclude place of residence as a set of dummy variables and find that the estimates of all the predictors increase slightly, but variables party membership dummy, work experience, and workplace dummies (Collective, Institution, socialorg, Other) are not statistically significant (See Table 4). Based on my results, in both models (See Table 5), educa- tion is the best indicator to predict personal income, and in my findings, education has a rate of 24.8%, which is much higher than previous estimates (Xie & Hannum, 1996; Wu & Xie, 2002; Zhou, 2000). In addition, as part of education, foreign language skill enjoys a 7.7-percent advantage, which also con- firm the significance of human capital in determining earnings. Work experience, another conventional measurement of hu- man capital, has no linear relationship with the dependent vari- able in the regression model. After conducted curve estimation, I set up a quadratic model for work experience by computing workdev and workdev 2. However, the result shows that work- dev and workdev 2 are not significant. Thus, overall, work ex- perience is not significant in either model. This result is differ- ent from Xie and Hannum’s findings that work experience has a 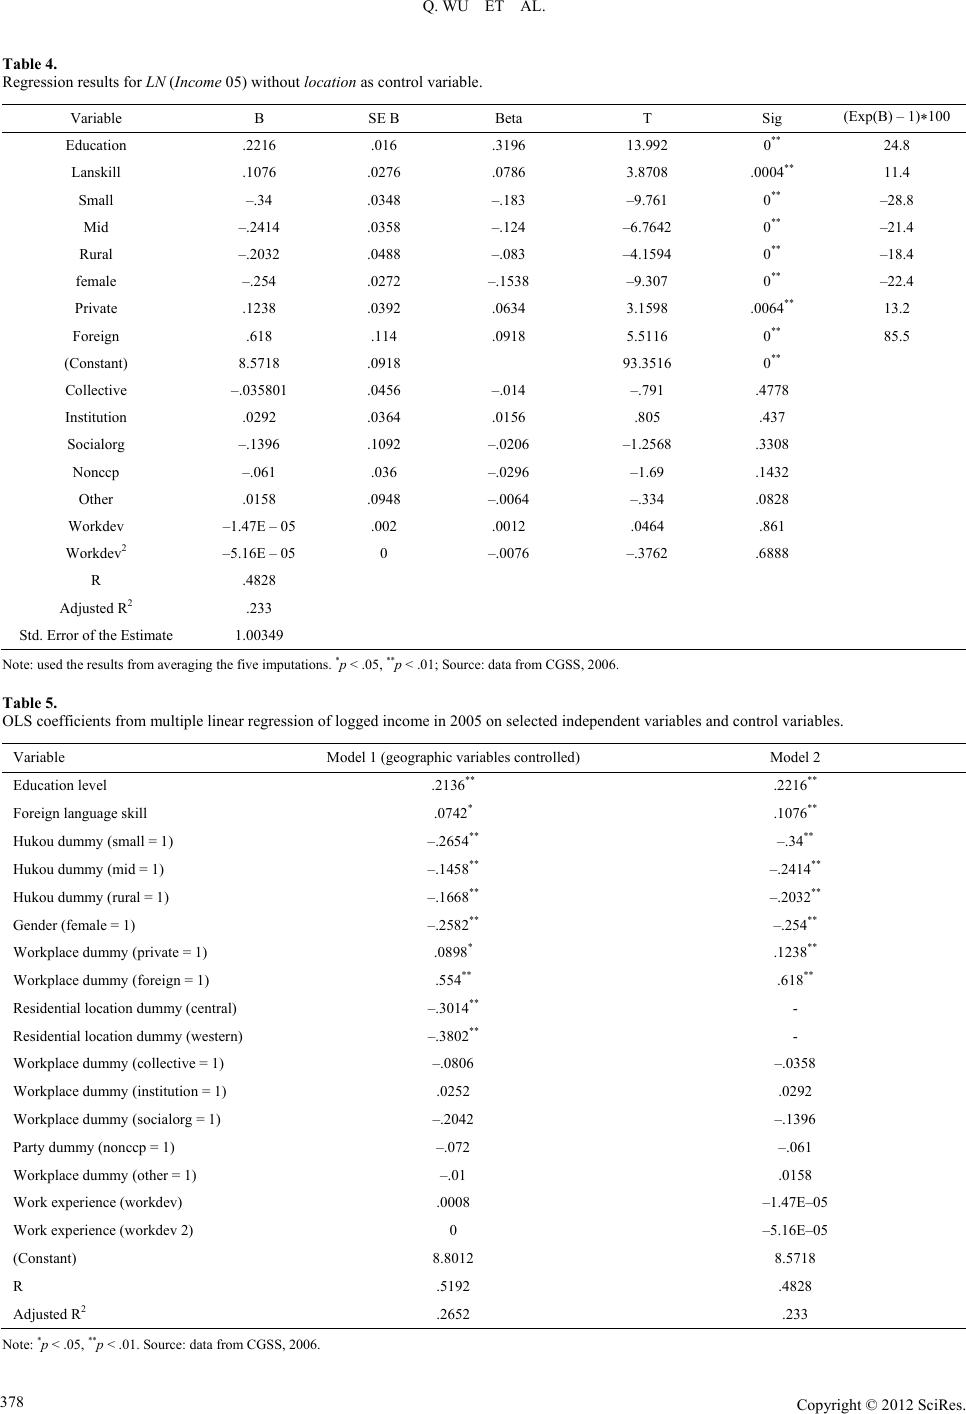 Q. WU ET AL. Table 4. Regression results for LN (Income 05) without location as control variable. Variable B SE B Beta T Sig (Exp(B) – 1)*100 Education .2216 .016 .3196 13.992 0** 24.8 Lanskill .1076 .0276 .0786 3.8708 .0004** 11.4 Small –.34 .0348 –.183 –9.761 0** –28.8 Mid –.2414 .0358 –.124 –6.7642 0** –21.4 Rural –.2032 .0488 –.083 –4.1594 0** –18.4 female –.254 .0272 –.1538 –9.307 0** –22.4 Private .1238 .0392 .0634 3.1598 .0064** 13.2 Foreign .618 .114 .0918 5.5116 0** 85.5 (Constant) 8.5718 .0918 93.3516 0** Collective –.035801 .0456 –.014 –.791 .4778 Institution .0292 .0364 .0156 .805 .437 Socialorg –.1396 .1092 –.0206 –1.2568 .3308 Nonccp –.061 .036 –.0296 –1.69 .1432 Other .0158 .0948 –.0064 –.334 .0828 Workdev –1.47E – 05 .002 .0012 .0464 .861 Workdev2 –5.16E – 05 0 –.0076 –.3762 .6888 R .4828 Adjusted R2 .233 Std. Error of the Estimate 1.00349 Note: used the results from averaging the five imputations. *p < .05, **p < .01; Source: data from CGSS, 2006. Table 5. OLS coefficients from multiple linear regression of logged income in 2005 on selected independent variables and control variables. Variable Model 1 (geographic variables controlled) Model 2 Education level .2136** .2216** Foreign language skill .0742* .1076** Hukou dummy (small = 1) –.2654** –.34** Hukou dummy (mid = 1) –.1458** –.2414** Hukou dummy (rural = 1) –.1668** –.2032** Gender (female = 1) –.2582** –.254** Workplace dummy (private = 1) .0898* .1238** Workplace dummy (foreign = 1) .554** .618** Residential location dummy (central) –.3014** - Residential location dummy (western) –.3802** - Workplace dummy (collective = 1) –.0806 –.0358 Workplace dummy (institution = 1) .0252 .0292 Workplace dummy (socialorg = 1) –.2042 –.1396 Party dummy (nonccp = 1) –.072 –.061 Workplace dummy (other = 1) –.01 .0158 Work experience (workdev) .0008 –1.47E–05 Work experience (workdev 2) 0 –5.16E–05 (Constant) 8.8012 8.5718 R .5192 .4828 Adjusted R2 .2652 .233 Note: *p < .05, **p < .01. Source: data from CGSS, 2006. Copyright © 2012 SciRes. 378  Q. WU ET AL. positive but concave effect on logged income. Thus, I partially approve my hypothesis that education has the greatest impact in determining income distribution, while work experience does not show much significance. Beyond my expectation, party membership is not significant in either model. This suggests that party membership has little impact on earnings, and weak support for hypothesis 2. Com- pared to government agencies and state-owned enterprises, where accumulate the redistributive power and political capital, collective enterprises, public institutions and social organiza- tions, which have more or less connections or relationships with the state reveal no remarkable advantages in earnings. However, private sector (private and foreign enterprises) dem- onstrates considerable disparity on income. Beyond the regional income differences in urban China, “the gap incomes between the different state and non-state sectors has become more im- portant in explaining social inequality as whole, with the rapid growth of the foreign-invested and domestic private econo- mies” (Guan, 2001: p. 246). My findings also suggest that gender difference in earnings is also estimated to be large, with females earning 22.8 percent less than males. “Hukou” is still playing a crucial role in that large cities’ residents earn 23.3 percent more than “Hukou”- holders in small cities, 13.6 percent more than citizens in mid- dle cities, and 15.4 percent more than those who originally from rural areas. Regional income disparities are also evident. Resi- dents in eastern coastal areas tend to earn 26.02% more than those who live the central China 31.6% more than the people in the west. I do find high returns to education, but fail to find high re- turns to work experience and party membership. And I did not find the significant effect on work unit sector and state owner- ship either. These findings are consistent with Nee’s prediction that the significance of political power declines with the proc- ess of the marketization, and “the income determination will depend more on market credentials (such as education), and less on political factors as economic reform advances” (Xie, 2008: p. 195). Discussion In this paper, I have examined the determinants of income in urban China based on the data of 2006. My hypotheses regard- ing the role of educational credentials was generally supported in both analyses and held up when various controls were intro- duced. According to the results from the regression models, working at market sector firms, especially foreign enterprises are the most predominant in determining the income distribu- tion in urban China. Does Political Capital or Power Really Decline Significantly? Returns to political capital or power “is operationalized in three ways: a) party membership, b) cadre position, and c ) jobs with redistributive power” (Bian, 2002: p. 100). In China, not everyone can become a member of Communist Party. There are mainly two ways to apply for a membership of Chinese Com- munist Party. One way is that first one should join the Commu- nist Youth League in middle school or high school, and until when he becomes an adult (≥18 years old) and enters a college or university, he can write an application letter to show his desire and loyalty to the party. A party membership can be an advantage to find a job in government or party agencies after graduation. Another way to be a party member is to apply at work units, such as public institutions, SOEs. For both ways, “to achieve Chinese Communist Party membership, individuals must pass through five ‘loyalty filters’ (Walder, 1995): 1) self-selection; 2) political participation; 3) daily monitoring; 4) closed-door evaluation; and 5) probationary examination” (Bian, Shu, & Logan, 2001: p. 813). Nowadays, the Chinese Communist Party tends to recruit educated youths and profes- sional, which indicates that the role of educational credentials has become more and more important. While variables related political capital did not turn out to be significant, things does not mean that party membership ceases to be an important factor in determining income. For example, “grey income is not included in the survey data and the limita- tion of my current research that does not partition cadre posi- tion into the party officials, government bureaucrats, and man- agers in SOEs”. Income distribution in the foreign enterprises and private companies are directly reflected in salaries, while in the gov- ernment agencies and SOEs, the base wages may be lower than the workers in foreign and private enterprises, but the hidden bonuses and other forms of welfare benefit including allowance for transportation as well food, a housing packages, medical insurance, unemployment insurance and annuity. Moreover, many SOEs assumed monopoly positions in the new market economy after the structural reforms. Those monopolized en- terprises, such as China Mobile, State Grid, China Telecom and China National Petroleum Corporation occupy the most impor- tant and profitable industries, such as mining industry, banking, communication and telecom. With the powerful supporting polices and ample and stable financial support from the state, the profits of these SOEs rose tremendously given the size and importance of these enterprises in the state sector it would be hard to conclude that political capital has no influence on in- come. Moreover, the “grey income” of the state bureaucrats has great widen the income gap that 54% of the respondents of CGSS, 2006 recognize the huge gap between the cadre and the mass (poor vs rich has 57.7%). In light of this, most people do realize the existence of the “grey income”. According to Xiaolu Wang’s research, “the government’s statistics omit roughly RMB 9.26 trillion (about US$1.36 trillion) in ‘invisible’ in- come—that is, money earned illegally and under the table or not declared to tax authorities” (http://www.knowledgeatwharton.com.cn/index.cfm?fa=viewA rticle&Articleid=2284&languageid=1). What’s more, “as private economic activities became legal and market competition played a greater role in economic op- erations, people with more human capital and political capital began to be involved in business activities. Some cadres also managed to convert their political privileges into new economic advantages in this stage” (Wu, 2006: p. 391). In CGSS, 2006, there is question asking “comparatively, speaking, in the recent decade, which group of people in the following do you think obtain the most benefit?” 38.5% of the respondents think state cadres gain the most, 20.8% claim that it is private entrepre- neurs, and 15% favor in foreign investors. Based on the an- swers, we can clearly find that most people still deem that the state cadres who hold the political capital and power benefit the most. Even in the market system, the state cadres can transfer their political power and skills to revive in the new economy. Copyright © 2012 SciRes. 379  Q. WU ET AL. This is consistent with my third hypotheses of the technocratic continuity. Thus, I advocate that not only capitalists are the winners of the market transition in China, cadre still gain bene- fits but not as remarkable as in the pre-reform era. Impact of Marketization and Globaliza tion on Income Inequality Since the reform, especially after 2001 when China joined the World Trade Organization (WTO), an increasing foreign trade and investment has flown into Chinese market. Along with this trend, the impacts of globalization and marketization from the exterior forces have greatly influenced the patterns of income equality. First, from the Table 6 below, we can see that foreign in- vestment is unevenly distributed which, to great extent, leads to the regional income gap. There are 87.46% of foreign enter- prises investing in the eastern coastal areas, while central and western areas all together share 12.45%. To the extent that the unbalanced development pace and unequal policy support in the initial stage of the reform opened the gap between regions, then the involvement of foreign investment has greatly increased the disparity. Second, with more and more foreign-owned enterprises en- tering Chinese market, many SOEs face more challenges and competitions. From my regression result, we can clearly find that those who work at foreign companies earn much more than any others on average. Moreover, the income advantage in SOEs that gain all kinds of support from the state has declined greatly. Third, “income inequality within foreign-invested enterprises is generally much higher than in state and collective enter- prises” (Guan, 2001: p. 249). According to a survey conducted in Shanghai in 2005, the average annual wages of the highest level managerial personnel, such as Chief Executive Officer (CEO) and Chief Finance Officer (CFO), earn “over 400,000 yuan, which is 13.68 times higher than the ordinary workers who only earn 28,000 yuan yearly” (http://www.ccw.com.cn/work2/culture/clcw/htm2006/2006020 8_13SBO.htm). In the foreign enterprises, the unequal salary structure is considered as a way to stimulate high efficiency under the market mechanism. Thus, SOEs also adopted this method during the structural reform in the mid-1990s and early 2000s, which further widen the income gap within the market sector. Table 6. Regional distribution of the foreign-invested enterprises in China (2005). Number of foreign invested enterprises (unit) Total investment (100 million USD) Regions No. % No. % Eastern Coastal* 227401 87.46192 12729 86.9586 Central** 21464 8.255385 1393 9.516327 Western*** 11135 4.282692 516 3.525072 National Total 260000 100 14638 100 *Includes: Beijing, Tianjin, Hebei, Liaoning, Jilin, Heilongjiang, Shanghai, Ji- angsu, Zhejiang, Fujian, Shandong, Guangdong, and Hainan; **Includes: Shanxi, inner-Mongolia, Anhui, Jiangxi, Henan, Hubei, Hunan, Guangxi, and Chongqing; ***Includes: Sichuan, Guizhou, Yunan, Tibet, Qinghai, Shaanxi, Gansu, Ningxia, and Xinjiang. Source: “Chinese Statistics Yearbook (2006), Calculated from the data in the Tables 18-19 in 2006 Chinese Statistics Yearbook, Chinese Statistic Publishing House (See references)”. Conclusion By using new data from 2006 China General Social Survey (CSSS, 2006), I conduct an OLS regression analysis on the logged annual income and gender, work experience, education, foreign language skill, party membership, type of “Hukou”, geographical location, and workplace. The results of the OLS regression analysis suggest that there is estimated to be a large gender-based difference, “Hukou” discrimination and regional disparity in earnings. The empirical results also reveal that education matters more while the political advantage of party membership drops, so do state ownership or non-market workplaces. This finding pro- vides evidence to support Nee’s theory that market transition lead to “a decline of the significance of redistributive power and political capital, relative to market-based non-state eco- nomic actors, higher return to human capital than under a cen- trally planned economy, and new sources of economic advan- tage associated with entrepreneurship and hybrid/private sec- tor employment” (Nee & Cao, 1999: p. 807). While my findings imply that political capital is less impor- tant, I am not ready to reject the role of party membership in determining earnings. First of all, there is a large deal of invisi- ble income (grey income) and all kinds of welfare benefit which are not covered in the survey data, I cannot simply rely on the results from data analysis to make conclusions. Second, my research is limited in that it 1) excludes the variables of occupation and cadre status; 2) parental party membership, parental education level, and the parental social capital link; 3) “grey income” sources; and 4) welfare benefit. For further research, I would like to take the variables of oc- cupation and cadre status; take parental party membership, parental education level, and the parental social capital link (e.g., education) and how that turns into more market power into account to improve the model, and investigate more in the part of “grey income” and welfare benefit. Acknowledgements This work is based on Qiong Wu’s Master’s thesis. Wu’s gratitude goes to her thesis committee, Dr. Barry Goetz, Dr. David Hartmann, and Dr. Yuan-Kang Wang. They have been her inspiration as she hurdles all the obstacles in the completion this research work for the support and guidance. Also, Wu thanks China General Social Survey Open Database to provide the data of 2006 for free. REFERENCES Bian, Y. (1994). Work and inequality in urban China. Albany, NY: State University of New York Press. Bian, Y., & Logan, J. R. (1996). Market transition and the persistence of power: The chaning stratification system in urban China. Ameri- can Sociological Review, 61, 739-758. doi:10.2307/2096451 Bian, Y., Shu, X., & Logan, J. R. (2001). Communist party membership and regime dynamics in China. Social Forces, 7 9, 805-841. doi:10.1353/sof.2001.0006 Guan, X. (2001). Globalization, inequality and social policy: China on the threshold of entry into the World Trade Organization. Social Policy and Administration, 35, 242-257. doi:10.1111/1467-9515.00231 Hauser, S., & Xie, Y. (2005). Temporal and regional variation in earn- ings inequality: Urban China in transition between 1988 and 1995. Social Science Research, 34, 44-79. Copyright © 2012 SciRes. 380  Q. WU ET AL. Copyright © 2012 SciRes. 381 doi:10.1016/j.ssresearch.2003.12.002 Lewis, W. A. (1976). Development and distribution. In A. Cairncross, & M. Puri (Eds.), Employment, income distribution and development strategy. London: Macmillan. National Bureau Statistics (2006). China statistical yearbook. Beijing: China Statistical Publishing House. Nee, V. (1989). A theory of market transition: From redistribution to markets in state socialism. American Sociological Review, 54, 663- 681. doi:10.2307/2117747 Rona-Tas, A. (1994). The first shall be last? Entrepreneurship and communist cadres in the transition from socialism. American Journal of Sociology, 100, 40-69. doi:10.1086/230499 Tang, W., & Parish, W. L. (2000). Chinese urban life under reform: The changing social contract. Cambridge: Cambridge University Press. Victor, N., & Cao, Y. (1999). Path dependent societal transformation: Stratification in hybrid mixed economies. Theory and Society, 28, 799-834. doi:10.1023/A:1007074013540 Wang, F. (2008). Boundaries and categories: Rising inequality in post-socialist urban China. Stanford, CA: Stanford University Press. Wu, X. (2006). Communist cadres and market opportunities: Entry into self-employment in China, 1978-1996. Social Force, 85, 389-411. doi:10.1353/sof.2006.0149 Wu, X., & Treiman, D. J. (2004). The household registration system and social stratification in China: 1955-1996. Demography, 41, 363- 384. doi:10.1353/dem.2004.0010 Wu, X., & Xie, Y. (2003). Does the market pay off? Earnings Returns to education in urban China. American Sociological Review, 68, 425- 442. doi:10.2307/1519731 Xie, Y., & Hannum, E. (1996). Regional variation in earnings inequal- ity in reform-era urban China. American Journal of Sociology, 101, 950-992. doi:10.1086/230785 Xie, Y., & Wu, X. (2008). Danwei profitability and earnings inequality in urban China. The China Quarterly, 1, 558-581. Xinhua (2004). Survey of Chinese officials’ opinions on reform: Bei- jing Daily. Xinhua Ne w s Bulletin. Zhou, X. (2000). Economic transformation and income inequality in urban China: Evidence from panel data. American Journal of Soci- ology, 105, 1135-1174. doi:10.1086/210401
|