 Journal of Cancer Therapy, 2012, 3, 731-740 http://dx.doi.org/10.4236/jct.2012.325092 Published Online October 2012 (http://www.SciRP.org/journal/jct) 731 Metabolic, Health and Lifestyle Profiling of Breast Cancer Radiotherapy Patients and the Risk of Developing Fatigue R. Hugh Dunstan1*, Diane L. Sparkes1, Christopher Wratten2, James W. Denham2, Johan Gottfries3, Tim K. Roberts1, Margaret M. Macdonald1 1School of Environmental and Life Sciences, University of Newcastle, Callaghan, Australia; 2Radiation Oncology Department, Cal- vary Mater Newcastle, Newcastle, Australia; 3Department of Chemistry and Molecular Biology, Gothenberg, Sweden. Email: *hugh.dunstan@newcastle.edu.au Received August 31st, 2012; revised September 28th, 2012; accepted October 10th, 2012 ABSTRACT Background: Fatigue is commonly reported by cancer patients. In some instances it can persist after treatment is com- pleted. In order to develop effective treatment strategies it is important to understand the mechanisms underlying the development of fatigue and to be able to predict those that may be at greatest risk of experiencing fatigue during and following treatment. The current paper examines predisposing factors for fatigue including altered fatty acid homeosta- sis in a cohort of breast cancer radiotherapy patients. Methodology: Patients had undergone breast-conserving surgery and adjuvant breast irradiation. Prior to radiotherapy the patients were free from significant fatigue. Levels of fatigue were determined prior to and following radiotherapy using the Functional Assessment of Cancer Therapy fatigue sub- scale. Plasma fatty acid levels, urinary and plasma amino acid levels, blood biochemistry factors and general health and lifestyle characteristics were assessed. Results: Following radiotherapy, significant fatigue affected approximately one third of the 26 patients and these subjects were then assigned to the fatigued cohort. Univariate analysis revealed that higher levels of the fatty acids myristic acid and eicosadienoic acid were present for the fatigued cohort prior to radio- therapy. Multivariate analysis also revealed that fatty acid homeostasis was altered between the fatigued and non-fatigued groups at baseline. Orthogonal partial least squares discriminant analysis of the general health, lifestyle and metabolic data revealed that the fatigued and non-fatigued patients could be clustered into two clearly separate groups. Conclusions: The results supported the proposition that the fatigued patients had an underlying metabolic ho- meostasis which may predispose them to the development of fatigue. Biochemical and general health profiling of breast cancer patients has the potential to identify those at most risk of developing significant fatigue following radiotherapy. Keywords: Fatigue; Fatty Acids; Radiotherapy; Breast Cancer 1. Introduction With the development of improved methods for the screening and treatment of breast cancer and subsequent increased survival rates [1] there is a growing need to consider quality of life after treatment is completed. Fa- tigue is the most common symptom experienced by can- cer patients. It can result in a reduction in quality of life both during therapy [2] and in some cases persist long after treatment has been completed [3,4]. Although its etiology remains unknown a number of therapies have been trialed for cancer-related fatigue including exercise programs [5] and various psychosocial interventions [6]. Not all breast cancer patients receiving radiotherapy will develop fatigue and to date it has not been possible to predict which patients would develop significant fatigue following treatment and which would remain fatigue-free. It has been proposed that cancer-related fatigue is multi- factorial in origin with biological, psychological and so- cial factors contributing to its development [6]. Profiling may provide an opportunity to further understand the etiology of cancer-related fatigue and to potentially de- velop a predictive method to identify those patients most at risk of developing significant fatigue. The ability to identify patients at risk of developing fatigue would al- low clinicians to target therapies for fatigue at this sub- group. Through patient profiling it may be possible to not only prevent the development of fatigue but also to iden- tify particular risk factors which are amenable to treat- ment. The formulation of an amino acid nutritional sup- plement aimed at addressing possible nutritional defi- ciencies may prove to be one such treatment. The current study aimed to determine whether alterations in underly- ing fatty acid metabolism could be identified in breast cancer radiotherapy patients who developed significant *Corresponding author. Copyright © 2012 SciRes. JCT 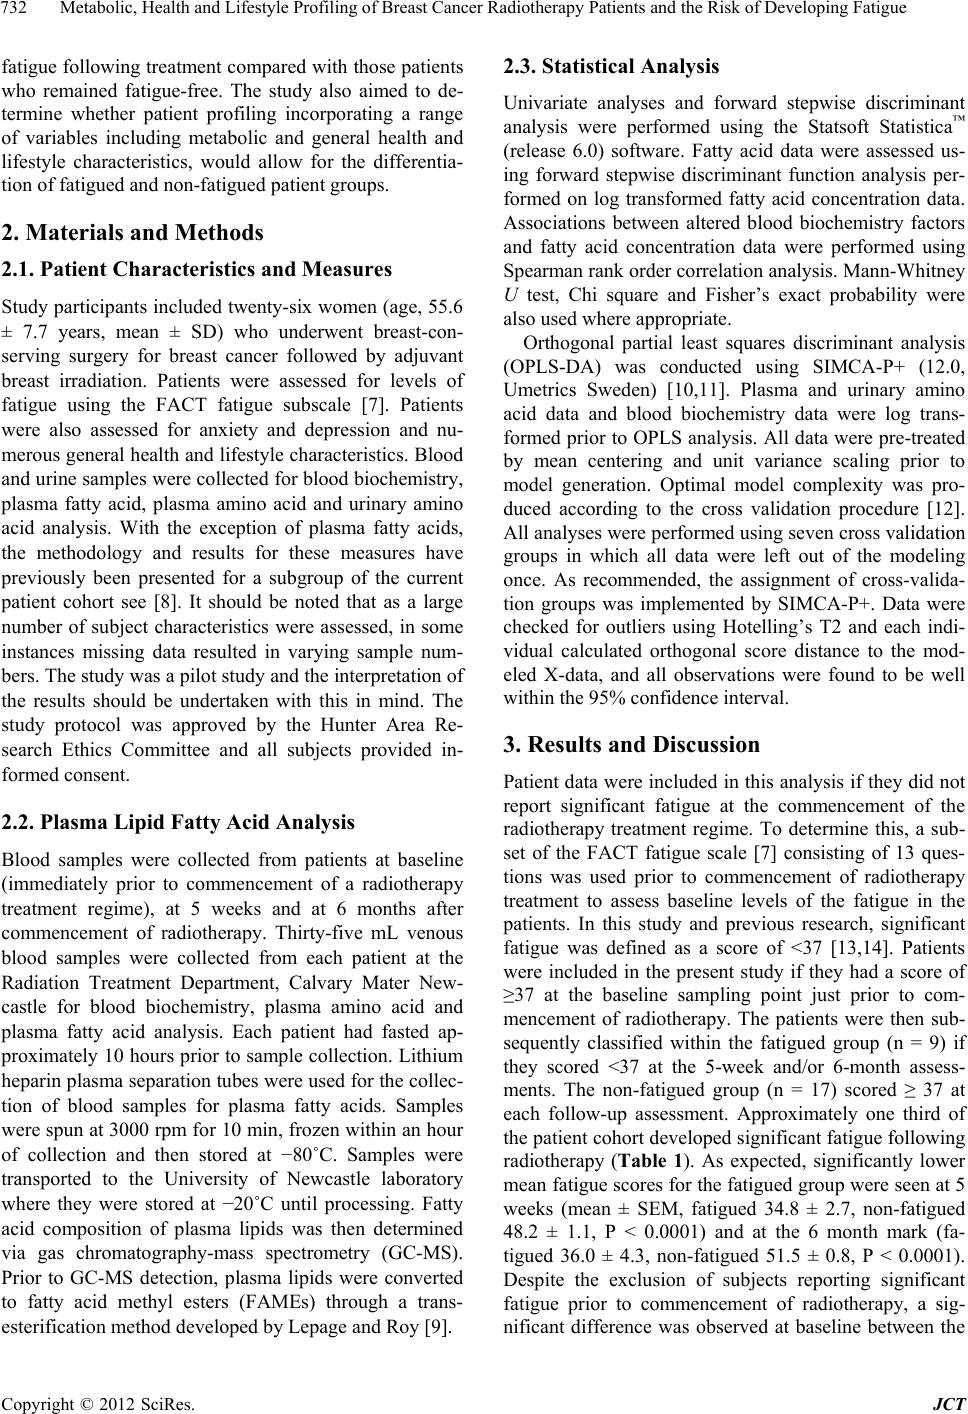 Metabolic, Health and Lifestyle Profiling of Breast Cancer Radiotherapy Patients and the Risk of Developing Fatigue 732 fatigue following treatment compared with those patients who remained fatigue-free. The study also aimed to de- termine whether patient profiling incorporating a range of variables including metabolic and general health and lifestyle characteristics, would allow for the differentia- tion of fatigued and non-fatigued patient groups. 2. Materials and Methods 2.1. Patient Characteristics and Measures Study participants included twenty-six women (age, 55.6 ± 7.7 years, mean ± SD) who underwent breast-con- serving surgery for breast cancer followed by adjuvant breast irradiation. Patients were assessed for levels of fatigue using the FACT fatigue subscale [7]. Patients were also assessed for anxiety and depression and nu- merous general health and lifestyle characteristics. Blood and urine samples were collected for blood biochemistry, plasma fatty acid, plasma amino acid and urinary amino acid analysis. With the exception of plasma fatty acids, the methodology and results for these measures have previously been presented for a subgroup of the current patient cohort see [8]. It should be noted that as a large number of subject characteristics were assessed, in some instances missing data resulted in varying sample num- bers. The study was a pilot study and the interpretation of the results should be undertaken with this in mind. The study protocol was approved by the Hunter Area Re- search Ethics Committee and all subjects provided in- formed consent. 2.2. Plasma Lipid Fatty Acid Analysis Blood samples were collected from patients at baseline (immediately prior to commencement of a radiotherapy treatment regime), at 5 weeks and at 6 months after commencement of radiotherapy. Thirty-five mL venous blood samples were collected from each patient at the Radiation Treatment Department, Calvary Mater New- castle for blood biochemistry, plasma amino acid and plasma fatty acid analysis. Each patient had fasted ap- proximately 10 hours prior to sample collection. Lithium heparin plasma separation tubes were used for the collec- tion of blood samples for plasma fatty acids. Samples were spun at 3000 rpm for 10 min, frozen within an hour of collection and then stored at −80˚C. Samples were transported to the University of Newcastle laboratory where they were stored at −20˚C until processing. Fatty acid composition of plasma lipids was then determined via gas chromatography-mass spectrometry (GC-MS). Prior to GC-MS detection, plasma lipids were converted to fatty acid methyl esters (FAMEs) through a trans- esterification method developed by Lepage and Roy [9]. 2.3. Statistical Analysis Univariate analyses and forward stepwise discriminant analysis were performed using the Statsoft Statistica™ (release 6.0) software. Fatty acid data were assessed us- ing forward stepwise discriminant function analysis per- formed on log transformed fatty acid concentration data. Associations between altered blood biochemistry factors and fatty acid concentration data were performed using Spearman rank order correlation analysis. Mann-Whitney U test, Chi square and Fisher’s exact probability were also used where appropriate. Orthogonal partial least squares discriminant analysis (OPLS-DA) was conducted using SIMCA-P+ (12.0, Umetrics Sweden) [10,11]. Plasma and urinary amino acid data and blood biochemistry data were log trans- formed prior to OPLS analysis. All data were pre-treated by mean centering and unit variance scaling prior to model generation. Optimal model complexity was pro- duced according to the cross validation procedure [12]. All analyses were performed using seven cross validation groups in which all data were left out of the modeling once. As recommended, the assignment of cross-valida- tion groups was implemented by SIMCA-P+. Data were checked for outliers using Hotelling’s T2 and each indi- vidual calculated orthogonal score distance to the mod- eled X-data, and all observations were found to be well within the 95% confidence interval. 3. Results and Discussion Patient data were included in this analysis if they did not report significant fatigue at the commencement of the radiotherapy treatment regime. To determine this, a sub- set of the FACT fatigue scale [7] consisting of 13 ques- tions was used prior to commencement of radiotherapy treatment to assess baseline levels of the fatigue in the patients. In this study and previous research, significant fatigue was defined as a score of <37 [13,14]. Patients were included in the present study if they had a score of ≥37 at the baseline sampling point just prior to com- mencement of radiotherapy. The patients were then sub- sequently classified within the fatigued group (n = 9) if they scored <37 at the 5-week and/or 6-month assess- ments. The non-fatigued group (n = 17) scored ≥ 37 at each follow-up assessment. Approximately one third of the patient cohort developed significant fatigue following radiotherapy (Table 1). As expected, significantly lower mean fatigue scores for the fatigued group were seen at 5 weeks (mean ± SEM, fatigued 34.8 ± 2.7, non-fatigued 48.2 ± 1.1, P < 0.0001) and at the 6 month mark (fa- tigued 36.0 ± 4.3, non-fatigued 51.5 ± 0.8, P < 0.0001). Despite the exclusion of subjects reporting significant fatigue prior to commencement of radiotherapy, a sig- nificant difference was observed at baseline between the Copyright © 2012 SciRes. JCT 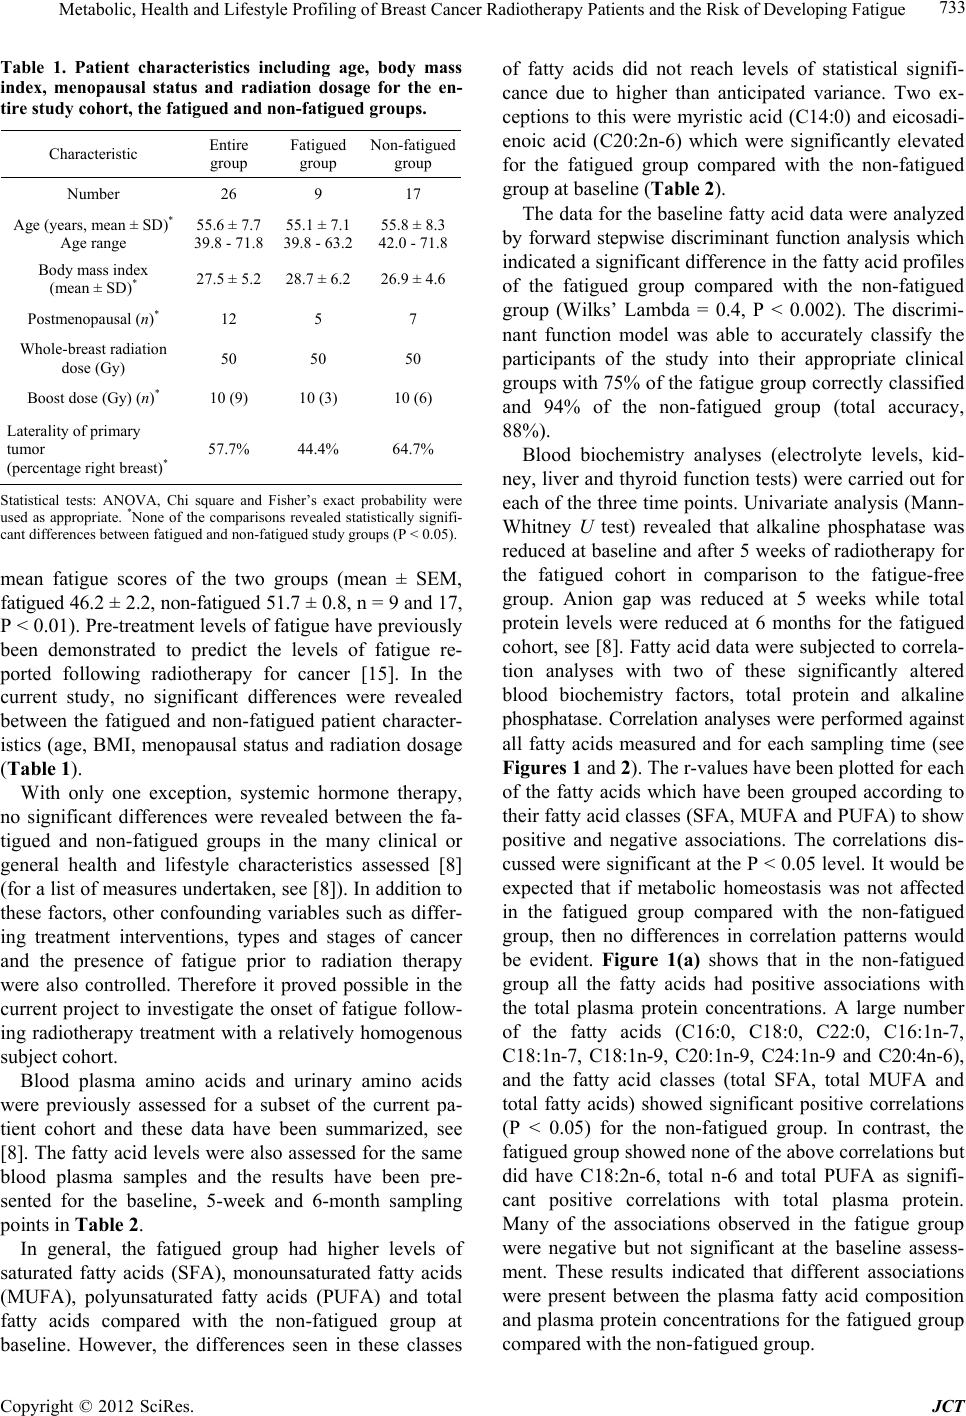 Metabolic, Health and Lifestyle Profiling of Breast Cancer Radiotherapy Patients and the Risk of Developing Fatigue 733 Table 1. Patient characteristics including age, body mass index, menopausal status and radiation dosage for the en- tire study cohort, the fatigued and non-fatigued groups. Characteristic Entire group Fatigued group Non-fatigued group Number 26 9 17 Age (years, mean ± SD)* Age range 55.6 ± 7.7 39.8 - 71.8 55.1 ± 7.1 39.8 - 63.2 55.8 ± 8.3 42.0 - 71.8 Body mass index (mean ± SD)* 27.5 ± 5.2 28.7 ± 6.2 26.9 ± 4.6 Postmenopausal (n)* 12 5 7 Whole-breast radiation dose (Gy) 50 50 50 Boost dose (Gy) (n)* 10 (9) 10 (3) 10 (6) Laterality of primary tumor (percentage right breast)* 57.7% 44.4% 64.7% Statistical tests: ANOVA, Chi square and Fisher’s exact probability were used as appropriate. *None of the comparisons revealed statistically signifi- cant differences between fatigued and non-fatigued study groups (P < 0.05). mean fatigue scores of the two groups (mean ± SEM, fatigued 46.2 ± 2.2, non-fatigued 51.7 ± 0.8, n = 9 and 17, P < 0.01). Pre-treatment levels of fatigue have previously been demonstrated to predict the levels of fatigue re- ported following radiotherapy for cancer [15]. In the current study, no significant differences were revealed between the fatigued and non-fatigued patient character- istics (age, BMI, menopausal status and radiation dosage (Table 1). With only one exception, systemic hormone therapy, no significant differences were revealed between the fa- tigued and non-fatigued groups in the many clinical or general health and lifestyle characteristics assessed [8] (for a list of measures undertaken, see [8]). In addition to these factors, other confounding variables such as differ- ing treatment interventions, types and stages of cancer and the presence of fatigue prior to radiation therapy were also controlled. Therefore it proved possible in the current project to investigate the onset of fatigue follow- ing radiotherapy treatment with a relatively homogenous subject cohort. Blood plasma amino acids and urinary amino acids were previously assessed for a subset of the current pa- tient cohort and these data have been summarized, see [8]. The fatty acid levels were also assessed for the same blood plasma samples and the results have been pre- sented for the baseline, 5-week and 6-month sampling points in Table 2. In general, the fatigued group had higher levels of saturated fatty acids (SFA), monounsaturated fatty acids (MUFA), polyunsaturated fatty acids (PUFA) and total fatty acids compared with the non-fatigued group at baseline. However, the differences seen in these classes of fatty acids did not reach levels of statistical signifi- cance due to higher than anticipated variance. Two ex- ceptions to this were myristic acid (C14:0) and eicosadi- enoic acid (C20:2n-6) which were significantly elevated for the fatigued group compared with the non-fatigued group at baseline (Table 2). The data for the baseline fatty acid data were analyzed by forward stepwise discriminant function analysis which indicated a significant difference in the fatty acid profiles of the fatigued group compared with the non-fatigued group (Wilks’ Lambda = 0.4, P < 0.002). The discrimi- nant function model was able to accurately classify the participants of the study into their appropriate clinical groups with 75% of the fatigue group correctly classified and 94% of the non-fatigued group (total accuracy, 88%). Blood biochemistry analyses (electrolyte levels, kid- ney, liver and thyroid function tests) were carried out for each of the three time points. Univariate analysis (Mann- Whitney U test) revealed that alkaline phosphatase was reduced at baseline and after 5 weeks of radiotherapy for the fatigued cohort in comparison to the fatigue-free group. Anion gap was reduced at 5 weeks while total protein levels were reduced at 6 months for the fatigued cohort, see [8]. Fatty acid data were subjected to correla- tion analyses with two of these significantly altered blood biochemistry factors, total protein and alkaline phosphatase. Correlation analyses were performed against all fatty acids measured and for each sampling time (see Figures 1 and 2). The r-values have been plotted for each of the fatty acids which have been grouped according to their fatty acid classes (SFA, MUFA and PUFA) to show positive and negative associations. The correlations dis- cussed were significant at the P < 0.05 level. It would be expected that if metabolic homeostasis was not affected in the fatigued group compared with the non-fatigued group, then no differences in correlation patterns would be evident. Figure 1(a) shows that in the non-fatigued group all the fatty acids had positive associations with the total plasma protein concentrations. A large number of the fatty acids (C16:0, C18:0, C22:0, C16:1n-7, C18:1n-7, C18:1n-9, C20:1n-9, C24:1n-9 and C20:4n-6), and the fatty acid classes (total SFA, total MUFA and total fatty acids) showed significant positive correlations (P < 0.05) for the non-fatigued group. In contrast, the fatigued group showed none of the above correlations but did have C18:2n-6, total n-6 and total PUFA as signifi- cant positive correlations with total plasma protein. Many of the associations observed in the fatigue group were negative but not significant at the baseline assess- ment. These results indicated that different associations were present between the plasma fatty acid composition and plasma protein concentrations for the fatigued group compared with the non-fatigued group. Copyright © 2012 SciRes. JCT  Metabolic, Health and Lifestyle Profiling of Breast Cancer Radiotherapy Patients and the Risk of Developing Fatigue Copyright © 2012 SciRes. JCT 734 Table 2. The concentrations of blood plasma fatty acids in the fatigued and non-fatigued groups at the commencement of radiotherapy (baseline), completion of radiotherapy (5-week) and at 6-months after the baseline assessment. Plasma fatty acid Baseline nmol/mL, mean (SEM) 5 weeks nmol/mL, mean (SEM) 6 months nmol/mL, mean (SEM) Fatigued Non-fatigued Fatigued Non-fatigued Fatigued Non-fatigued Saturated Myristic acid (14:0) 338.9 (27.2)* 266.1 (22.9*) 289.3 (40.8) 319.3 (28.5) 332.9 (38.4) 294.8 (22.5) Palmitic acid (16:0) 22324.0 (1625.8) 15837.1 (2470.6)18965.0 (2430.0)19777.0 (2664.3)18813.9 (4212.7) 14081 (2691.1) Stearic acid (18:0) 3,932.8 (124.5) 3111.4 (364.3) 3541.8 (311.5) 3543.4 (345.0) 3361.3 (514.5) 2911.4 (401.8) Arachidic acid (20:0) 107.4 (5.6) 92.1 (7.2) 100.1 (7.7) 105.1 (7.4) 104.5 (8.6) 92.2 (6.8) Behenic acid (22:0) 306.6 (15.2) 268.3 (28.4) 251.8 (32.0) 281.4 (20.3 274.6 (23.1) 258.3 (23.0) Lignoceric acid (24:0) 291.7 (20.5) 273.8 (29.4) 265.0 (15.7) 281.4 (21.2) 261.1 (24.0) 261.8 (25.5) Total SFA 27301.3 (1742.8) 19848.7 (2877.7)23413.0 (2747.9)24307.6 (3019.1)23148.2 (4768.2) 17899.7 (3122.9) Monounsaturated Palmitoleic acid (16:1n-7) 1537.6 (219.5) 1271.3 (156.4) 1218.9 (187.1) 1530.8 (164.6) 1448.8 (210.1) 1203.1 (153.2) cis-Vaccenic acid (18:1n-7) 1194.7 (103.9) 983.0 (116.9) 1004.7 (73.0) 1207.9 (143.4) 1069.6 (180.6) 872.2 (144.2) Oleic acid (18:1n-9) 24637.8 (2161.1) 18940.5 (3276.8)20800.4 (2756.2)23442.8 (3589.5)22412.5 (5250.3) 16831.6 (3572.8) Gondoic acid (20:1n-9) 143.7 (6.2) 146.6 (7.1) 147.5 (3.4) 152.3 (5.9) 150.9 (7.2) 143.3 (7.3) Erucic acid (22:1n-9) 167.0 (25.2) 149.7 (20.5) 183.1 (23.9) 178.4 (25.2) 107.7 (17.4) 114.5 (16.4) Nervonic acid (24:1n-9) 1062.7 (56.5) 867.3 (116.7) 975.1 (92.0) 986.6 (99.2) 874.2 (109.7) 810.0 (109.2) Total MUFA 28743.4 (2437.3) 22358.5 (3603.0)24329.6 (3018.6)27498.9 (3911.3)26063.7 (5683.6) 19974.6 (3947.4) Polyunsaturated n – 6 Linoleic acid (18:2n-6) 20971.3 (1049.7) 15650.9 (2350.3)18581.2 (1358.9)17,802.6 (2432.1)15,698.8 (3233.7) 13369.1 (2337.5) Arachidonic acid (20:4n-6) 5913.7 (496.8) 4468.5 (631.1) 5255.1 (500.5) 5,416.9 (672.1) 4,705.6 (896.5) 3927.5 (605.5) Eicosadienoic acid (20:2n-6) 100.0 (3.2)** 77.6 (7.4)** 92.6 (4.7) 89.3 (6.7) 84.0 (7.1) 80.5 (7.1) Total n-6 26,985.0 (1276.0) 20197.1 (2954.5)23865.9 (1721.7)23,308.7 (2996.5)20,488.3 (4016.8) 17377.1 (2917.7) n-3 Eicosapentaenoic acid (20:5n-3) 970.0 (145.3) 860.5 (158.1) 821.0 (117.8) 958.9 (159.5) 772.7 (141.5) 739.7 (89.0) Docosahexaenoic acid (22:6n-3) 1983.1 (240.8) 1478.2 (189.3) 1906.8 (227.9) 1,774.9 (187.3) 1,888.7 (375.0) 1564.0 (226.8) Total n-3 2953.1 (373.9) 2338.7 (341.0) 2727.8 (331.0) 2,733.7 (332.5) 2,661.4 (510.5) 2303.7 (303.8) Total PUFA 29938.0 (1278.8) 22535.8 (3205.2)26593.7 (1805.3)26,042 (3192.9)23,149.7 (4434.4) 19680.8 (3162.1) Total Fatty Acids 85982.8 (4451.5) 64743.0 (9500.2)74336.3 (7083.0)77,848.9 (9938.2)72,361.7 (14724.0) 57555.1 (10018.6) Statistical test: Mann-Whitney U test, P < 0.04* and P < 0.02**. Values are the mean (SEM) and are expressed as fatty acid concentration (nmol/mL). n = 8 and 17 at baseline, 9 and 16 at 5 weeks and 9 and 17 at 6 months for the fatigued and non-fatigued groups respectively. Following five weeks of radiation treatment all fatty acid associations with total plasma protein were positive for the non-fatigued group, although only those for C22:0, C24:0, C24:1n-9, C18:2n-6, total n-6, total n-3, total PUFA and total fatty acids were statistically significant (P < 0.05) (Figure 1(b)). In comparison to the 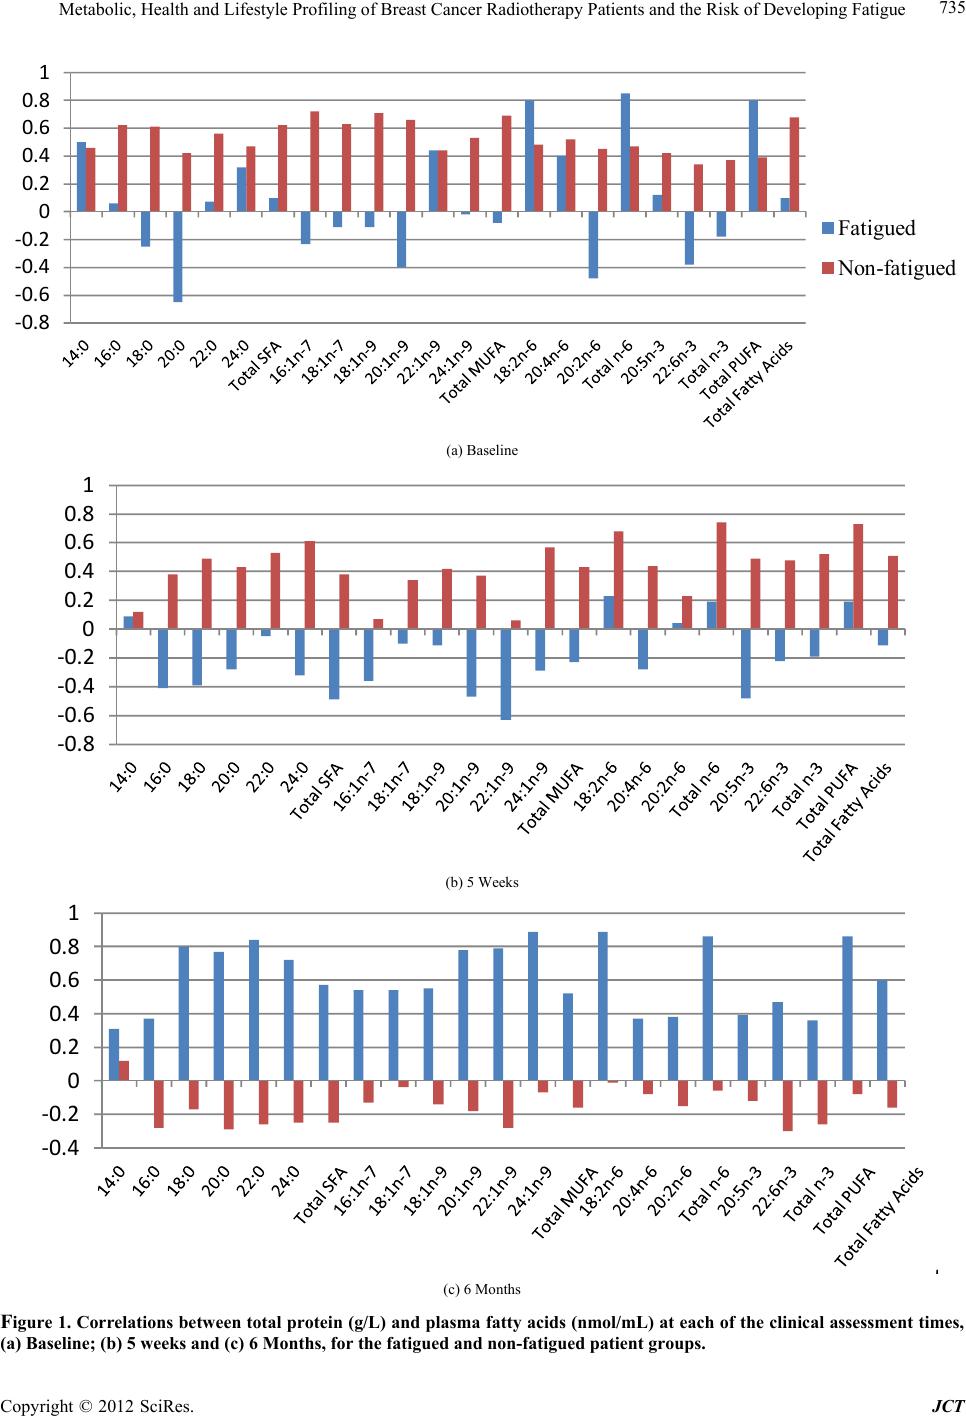 Metabolic, Health and Lifestyle Profiling of Breast Cancer Radiotherapy Patients and the Risk of Developing Fatigue 735 ‐0.8 ‐0.6 ‐0.4 ‐0.2 0 0.2 0.4 0.6 0.8 1 Fatigued Non-fatigued (a) Baseline ‐0.8 ‐0.6 ‐0.4 ‐0.2 0 0.2 0.4 0.6 0.8 1 (b) 5 Weeks ‐0.4 ‐0.2 0 0.2 0.4 0.6 0.8 1 (c) 6 Months Figure 1. Correlations between total protei n (g/L) and plasma fatty acids (nmol/mL) at each of the clinical assessment times, (a) Baseline; (b) 5 weeks and (c) 6 Months, for the fatigued and non-fatigued patient groups. Copyright © 2012 SciRes. JCT 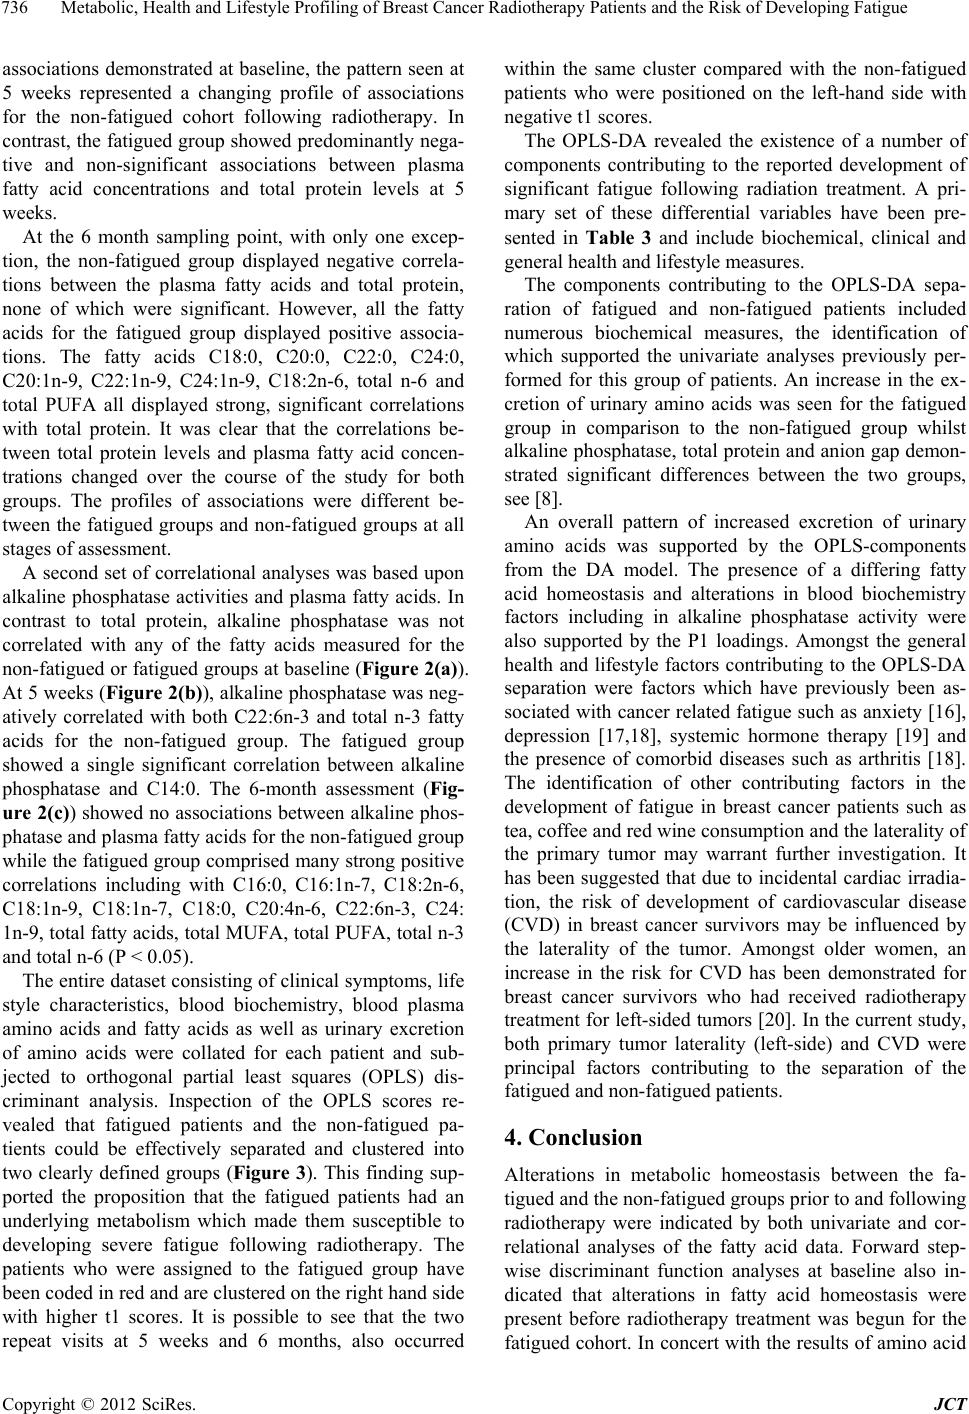 Metabolic, Health and Lifestyle Profiling of Breast Cancer Radiotherapy Patients and the Risk of Developing Fatigue 736 associations demonstrated at baseline, the pattern seen at 5 weeks represented a changing profile of associations for the non-fatigued cohort following radiotherapy. In contrast, the fatigued group showed predominantly nega- tive and non-significant associations between plasma fatty acid concentrations and total protein levels at 5 weeks. At the 6 month sampling point, with only one excep- tion, the non-fatigued group displayed negative correla- tions between the plasma fatty acids and total protein, none of which were significant. However, all the fatty acids for the fatigued group displayed positive associa- tions. The fatty acids C18:0, C20:0, C22:0, C24:0, C20:1n-9, C22:1n-9, C24:1n-9, C18:2n-6, total n-6 and total PUFA all displayed strong, significant correlations with total protein. It was clear that the correlations be- tween total protein levels and plasma fatty acid concen- trations changed over the course of the study for both groups. The profiles of associations were different be- tween the fatigued groups and non-fatigued groups at all stages of assessment. A second set of correlational analyses was based upon alkaline phosphatase activities and plasma fatty acids. In contrast to total protein, alkaline phosphatase was not correlated with any of the fatty acids measured for the non-fatigued or fatigued groups at baseline (Figure 2(a)). At 5 weeks (Figure 2(b)), alkaline phosphatase was neg- atively correlated with both C22:6n-3 and total n-3 fatty acids for the non-fatigued group. The fatigued group showed a single significant correlation between alkaline phosphatase and C14:0. The 6-month assessment (Fig- ure 2(c)) showed no associations between alkaline phos- phatase and plasma fatty acids for the non-fatigued group while the fatigued group comprised many strong positive correlations including with C16:0, C16:1n-7, C18:2n-6, C18:1n-9, C18:1n-7, C18:0, C20:4n-6, C22:6n-3, C24: 1n-9, total fatty acids, total MUFA, total PUFA, total n-3 and total n-6 (P < 0.05). The entire dataset consisting of clinical symptoms, life style characteristics, blood biochemistry, blood plasma amino acids and fatty acids as well as urinary excretion of amino acids were collated for each patient and sub- jected to orthogonal partial least squares (OPLS) dis- criminant analysis. Inspection of the OPLS scores re- vealed that fatigued patients and the non-fatigued pa- tients could be effectively separated and clustered into two clearly defined groups (Figure 3). This finding sup- ported the proposition that the fatigued patients had an underlying metabolism which made them susceptible to developing severe fatigue following radiotherapy. The patients who were assigned to the fatigued group have been coded in red and are clustered on the right hand side with higher t1 scores. It is possible to see that the two repeat visits at 5 weeks and 6 months, also occurred within the same cluster compared with the non-fatigued patients who were positioned on the left-hand side with negative t1 scores. The OPLS-DA revealed the existence of a number of components contributing to the reported development of significant fatigue following radiation treatment. A pri- mary set of these differential variables have been pre- sented in Table 3 and include biochemical, clinical and general health and lifestyle measures. The components contributing to the OPLS-DA sepa- ration of fatigued and non-fatigued patients included numerous biochemical measures, the identification of which supported the univariate analyses previously per- formed for this group of patients. An increase in the ex- cretion of urinary amino acids was seen for the fatigued group in comparison to the non-fatigued group whilst alkaline phosphatase, total protein and anion gap demon- strated significant differences between the two groups, see [8]. An overall pattern of increased excretion of urinary amino acids was supported by the OPLS-components from the DA model. The presence of a differing fatty acid homeostasis and alterations in blood biochemistry factors including in alkaline phosphatase activity were also supported by the P1 loadings. Amongst the general health and lifestyle factors contributing to the OPLS-DA separation were factors which have previously been as- sociated with cancer related fatigue such as anxiety [16], depression [17,18], systemic hormone therapy [19] and the presence of comorbid diseases such as arthritis [18]. The identification of other contributing factors in the development of fatigue in breast cancer patients such as tea, coffee and red wine consumption and the laterality of the primary tumor may warrant further investigation. It has been suggested that due to incidental cardiac irradia- tion, the risk of development of cardiovascular disease (CVD) in breast cancer survivors may be influenced by the laterality of the tumor. Amongst older women, an increase in the risk for CVD has been demonstrated for breast cancer survivors who had received radiotherapy treatment for left-sided tumors [20]. In the current study, both primary tumor laterality (left-side) and CVD were principal factors contributing to the separation of the fatigued and non-fatigued patients. 4. Conclusion Alterations in metabolic homeostasis between the fa- tigued and the non-fatigued groups prior to and following radiotherapy were indicated by both univariate and cor- relational analyses of the fatty acid data. Forward step- wise discriminant function analyses at baseline also in- dicated that alterations in fatty acid homeostasis were present before radiotherapy treatment was begun for the fatigued cohort. In concert with the results of amino acid Copyright © 2012 SciRes. JCT 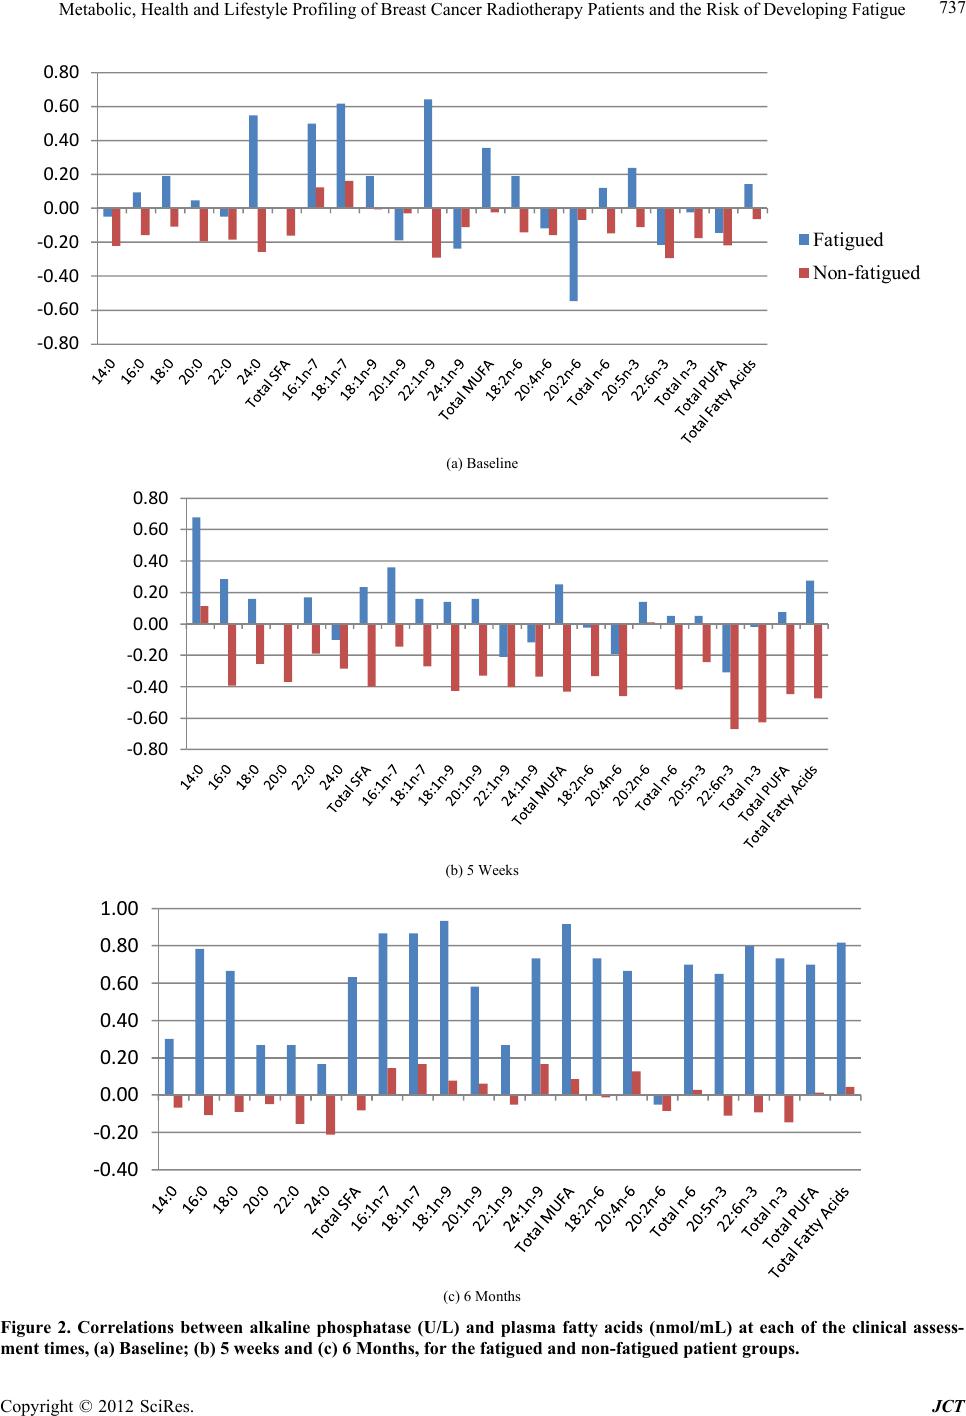 Metabolic, Health and Lifestyle Profiling of Breast Cancer Radiotherapy Patients and the Risk of Developing Fatigue 737 ‐0.80 ‐0.60 ‐0.40 ‐0.20 0.00 0.20 0.40 0.60 0.80 Fatigued Non-fatigued (a) Baseline ‐0.80 ‐0.60 ‐0.40 ‐0.20 0.00 0.20 0.40 0.60 0.80 (b) 5 Weeks ‐0.40 ‐0.20 0.00 0.20 0.40 0.60 0.80 1.00 (c) 6 Months Figure 2. Correlations between alkaline phosphatase (U/L) and plasma fatty acids (nmol/mL) at each of the clinical assess- ment times, (a) Baseline; (b) 5 weeks and (c) 6 Months, for the fatigued and non-fatigued patient groups. Copyright © 2012 SciRes. JCT  Metabolic, Health and Lifestyle Profiling of Breast Cancer Radiotherapy Patients and the Risk of Developing Fatigue 738 Table 3. Parameters contributing to the OPLS-DA separation of patient groups: Characteristics of patients who developed fatigue following radiotherapy compared with the non-fatigued cohort. Health and lifestyle Less likely to report menopausal status as perimenopausal or status unknown Less likely to be taking antihypertensive medication baseline Less likely to be taking lipid lowering medication at baseline Shorter distances travelled to treatment Laterality of primary tumor less likely to be on right-side Drinking less tea (cups/day) Less likely to have undergone major surgery in previous 6 months Drinking less coffee (cups/day) Less likely to have a diagnosis of coronary vascular disease Less likely to report marital status as married Higher HADS Depression score More hours worked per week More likely to be taking medications (other than aspirin/NSAI, corticosteroid, antihypertensive, antiangina, lipid lowering, anticoagulin, hormone) More likely to have a history of previous major surgery More likely to be a drinker of red wine More likely to report marital status as single—never married More likely to report a previous/current significant infectious disease and recovery More likely to be receiving systemic hormone therapy (tamoxifen or Arimidex) More likely to be receiving systemic hormone therapy post-radiotherapy Higher HADS Anxiety score More likely to be a coffee drinker Laterality of primary tumor more likely to be on left-side More likely to report a diagnosis of arthritis More likely to report diagnosis with other major disease/s More likely to be working More likely to report menopausal status as pre-menopausal More likely to be a tea drinker Biochemical measures Reduced measures Increased measures Plasma components: Alkaline phosphatase (U/L) Tyrosine Total protein (g/L) Anion gap (mmol/L) Lysine C20:5n-3 (%) C20:1n-9 (%) Calculated globulin (g/L) C16:1n-7 (%) C24:0 (%) Aspartic acid C14:0 (%) C22:0 (%) Thyroid stimulating hormone (mU/L) C22:1n-9 (%) C18:0 (%) Plasma components: Chloride (mmol/L) C16:0 (%) Urinary components (concentration): Alanine Glutamine Threonine Proline Histidine Glycine Phenylalanine Asparagine Serine Valine Tryptophan Glutamic acid Leucine Alpha-aminoadipic acid Tyrosine Cystine Isoleucine Proline-hydroxyproline Alpha-aminobutyric acid Methionine Aspartic acid Copyright © 2012 SciRes. JCT 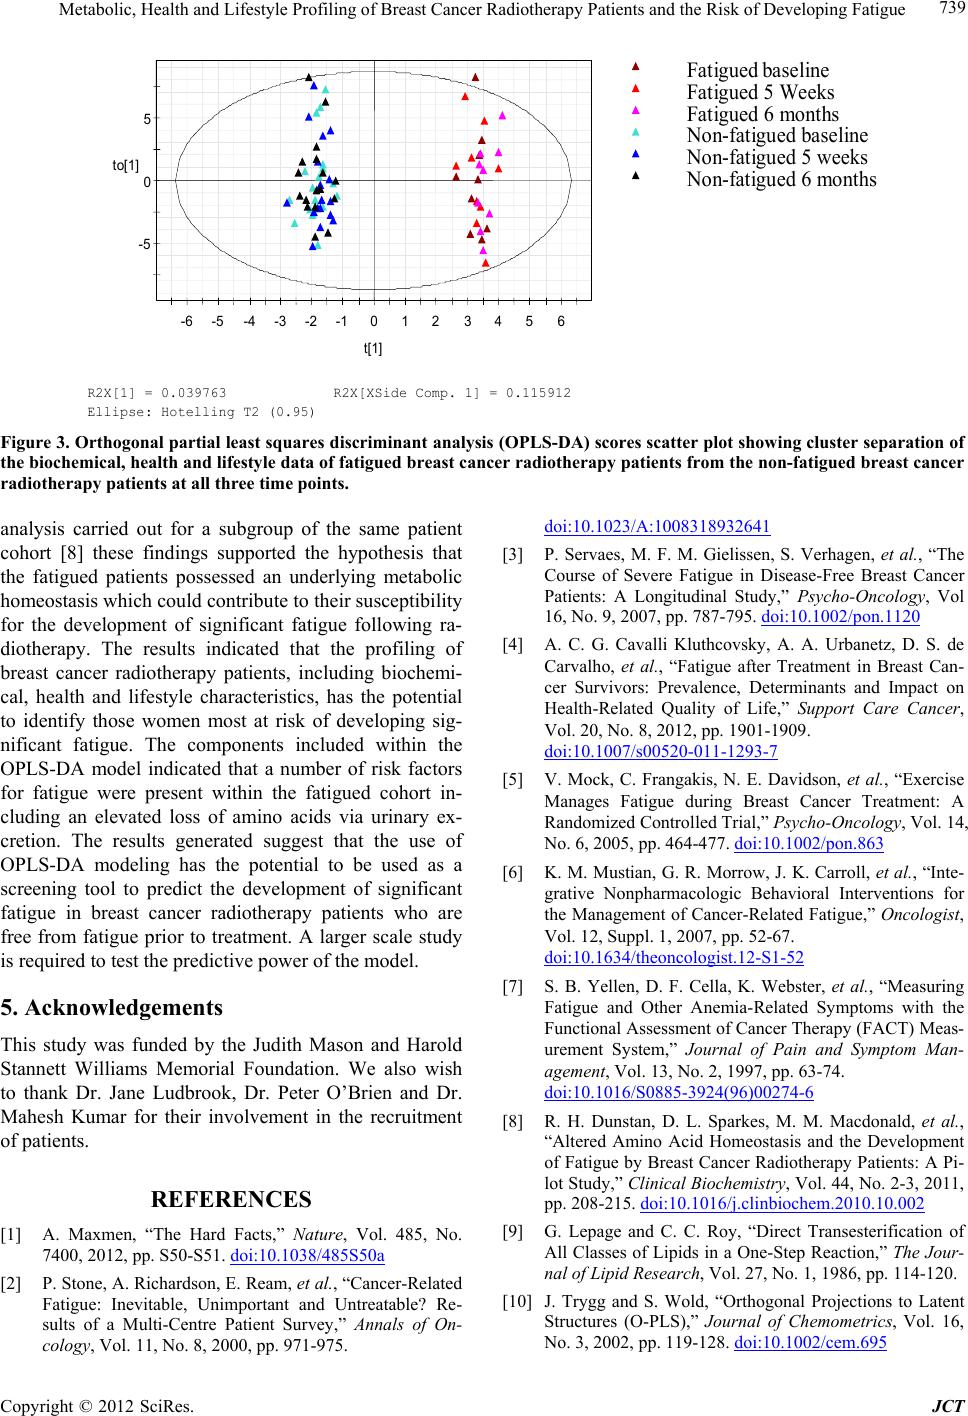 Metabolic, Health and Lifestyle Profiling of Breast Cancer Radiotherapy Patients and the Risk of Developing Fatigue Copyright © 2012 SciRes. JCT 739 -5 0 5 -6 -5-4 -3 -2 -10123456 to[1] t[1] R2X[1] = 0.039763 R2X[XSide Comp. 1] = 0.115912 Ellipse: Hotelling T2 (0.95) Fatigued aseline Fatigued 5 Weeks Fatigued 6 months on-fatigued baseline on-fatigued 5 weeks on-fatigued 6 months Figure 3. Orthogonal partial least squares discriminant analysis (OPLS-DA) scores scatter plot showing cluster separation of the biochemical, health and li festyle data of fatigue d breast ca ncer radi otherapy patients from the non-fati gued brea st cancer radiotherapy patients at all three time points. analysis carried out for a subgroup of the same patient cohort [8] these findings supported the hypothesis that the fatigued patients possessed an underlying metabolic homeostasis which could contribute to their susceptibility for the development of significant fatigue following ra- diotherapy. The results indicated that the profiling of breast cancer radiotherapy patients, including biochemi- cal, health and lifestyle characteristics, has the potential to identify those women most at risk of developing sig- nificant fatigue. The components included within the OPLS-DA model indicated that a number of risk factors for fatigue were present within the fatigued cohort in- cluding an elevated loss of amino acids via urinary ex- cretion. The results generated suggest that the use of OPLS-DA modeling has the potential to be used as a screening tool to predict the development of significant fatigue in breast cancer radiotherapy patients who are free from fatigue prior to treatment. A larger scale study is required to test the predictive power of the model. 5. Acknowledgements This study was funded by the Judith Mason and Harold Stannett Williams Memorial Foundation. We also wish to thank Dr. Jane Ludbrook, Dr. Peter O’Brien and Dr. Mahesh Kumar for their involvement in the recruitment of patients. REFERENCES [1] A. Maxmen, “The Hard Facts,” Nature, Vol. 485, No. 7400, 2012, pp. S50-S51. doi:10.1038/485S50a [2] P. Stone, A. Richardson, E. Ream, et al., “Cancer-Related Fatigue: Inevitable, Unimportant and Untreatable? Re- sults of a Multi-Centre Patient Survey,” Annals of On- cology, Vol. 11, No. 8, 2000, pp. 971-975. doi:10.1023/A:1008318932641 [3] P. Servaes, M. F. M. Gielissen, S. Verhagen, et al., “The Course of Severe Fatigue in Disease-Free Breast Cancer Patients: A Longitudinal Study,” Psycho-Oncology, Vol 16, No. 9, 2007, pp. 787-795. doi:10.1002/pon.1120 [4] A. C. G. Cavalli Kluthcovsky, A. A. Urbanetz, D. S. de Carvalho, et al., “Fatigue after Treatment in Breast Can- cer Survivors: Prevalence, Determinants and Impact on Health-Related Quality of Life,” Support Care Cancer, Vol. 20, No. 8, 2012, pp. 1901-1909. doi:10.1007/s00520-011-1293-7 [5] V. Mock, C. Frangakis, N. E. Davidson, et al., “Exercise Manages Fatigue during Breast Cancer Treatment: A Randomized Controlled Trial,” Psycho-Oncology, Vol. 14, No. 6, 2005, pp. 464-477. doi:10.1002/pon.863 [6] K. M. Mustian, G. R. Morrow, J. K. Carroll, et al., “Inte- grative Nonpharmacologic Behavioral Interventions for the Management of Cancer-Related Fatigue,” Oncologist, Vol. 12, Suppl. 1, 2007, pp. 52-67. doi:10.1634/theoncologist.12-S1-52 [7] S. B. Yellen, D. F. Cella, K. Webster, et al., “Measuring Fatigue and Other Anemia-Related Symptoms with the Functional Assessment of Cancer Therapy (FACT) Meas- urement System,” Journal of Pain and Symptom Man- agement, Vol. 13, No. 2, 1997, pp. 63-74. doi:10.1016/S0885-3924(96)00274-6 [8] R. H. Dunstan, D. L. Sparkes, M. M. Macdonald, et al., “Altered Amino Acid Homeostasis and the Development of Fatigue by Breast Cancer Radiotherapy Patients: A Pi- lot Study,” Clinical Biochemistry, Vol. 44, No. 2-3, 2011, pp. 208-215. doi:10.1016/j.clinbiochem.2010.10.002 [9] G. Lepage and C. C. Roy, “Direct Transesterification of All Classes of Lipids in a One-Step Reaction,” The Jour- nal of Lipid Research, Vol. 27, No. 1, 1986, pp. 114-120. [10] J. Trygg and S. Wold, “Orthogonal Projections to Latent Structures (O-PLS),” Journal of Chemometrics, Vol. 16, No. 3, 2002, pp. 119-128. doi:10.1002/cem.695  Metabolic, Health and Lifestyle Profiling of Breast Cancer Radiotherapy Patients and the Risk of Developing Fatigue 740 [11] J. E. Jackson, “A User’s Guide to Principal Components,” Wiley, New York, 1991. doi:10.1002/0471725331 [12] S. Wold, “Cross-Validatory Estimation of the Number of Components in Factor and Principal Components Mod- els,” Technometrics, Vol. 20, No. 4, 1978. pp. 397-405. doi:10.1080/00401706.1978.10489693 [13] C. Cleeland and S. Wang, “Measuring and Understanding Fatigue,” Oncology, Vol. 13, No. 11A, 1999, pp. 91-97. [14] C. Wratten, J. Kilmurray, S. Nash, et al., “Fatigue during Breast Radiotherapy and Its Relationship to Biological Factors,” International Journal of Radiation Oncology, Biology and Physics, Vol. 59, No. 1, 2004, pp. 160-167. doi:10.1016/j.ijrobp.2003.10.008 [15] E. M. A. Smets, M. R. M. Visser, A. F. M. N. Wil- lems-Groot, et al., “Fatigue and Radiotherapy: (A) Ex- perience in Patients Undergoing Treatment,” British Journal of Cancer, Vol. 78, No. 7, 1998, pp. 899-906. doi:10.1038/bjc.1998.599 [16] H. Geinitz, F. B. Zimmermann, R. Thamm, et al., “Fa- tigue in Patients with Adjuvant Radiation Therapy for Breast Cancer: Long-Term Follow-Up,” Journal of Can- cer Research and Clinical Oncology, Vol. 130, No. 6, 2004, pp. 327-333. doi:10.1007/s00432-003-0540-9 [17] R. Morant, “Asthenia: An Important Symptom in Cancer Patients,” Cancer Treatment Reviews, Vol. 22, Suppl. A, 1996, pp. 117-122. doi:10.1016/S0305-7372(96)90073-0 [18] J. E. Bower, P. A. Ganz, K. A. Desmond, et al., “Fatigue in Breast Cancer Survivors: Occurrence, Correlates, and Impact on Quality of Life,” Journal of Clinical Oncology, Vol. 18, No. 4, 2000, pp. 743-753. [19] S. Haghighat, M. E. Akbari, K. Holakouei, et al., “Factors Predicting Fatigue in Breast Cancer Patients,” Support Care Cancer, Vol. 11, No. 8, 2003. pp. 533-538. doi:10.1007/s00520-003-0473-5 [20] R. Haque, M. U. Yood, A. M. Geiger, et al., “Long-Term Safety of Radiotherapy and Breast Cancer Laterality in Older Survivors,” Cancer Epidemiology, Biomarkers & Prevention, Vol. 20, No. 10, 2011, pp. 2120-2126. doi:10.1158/1055-9965.EPI-11-0348 Copyright © 2012 SciRes. JCT
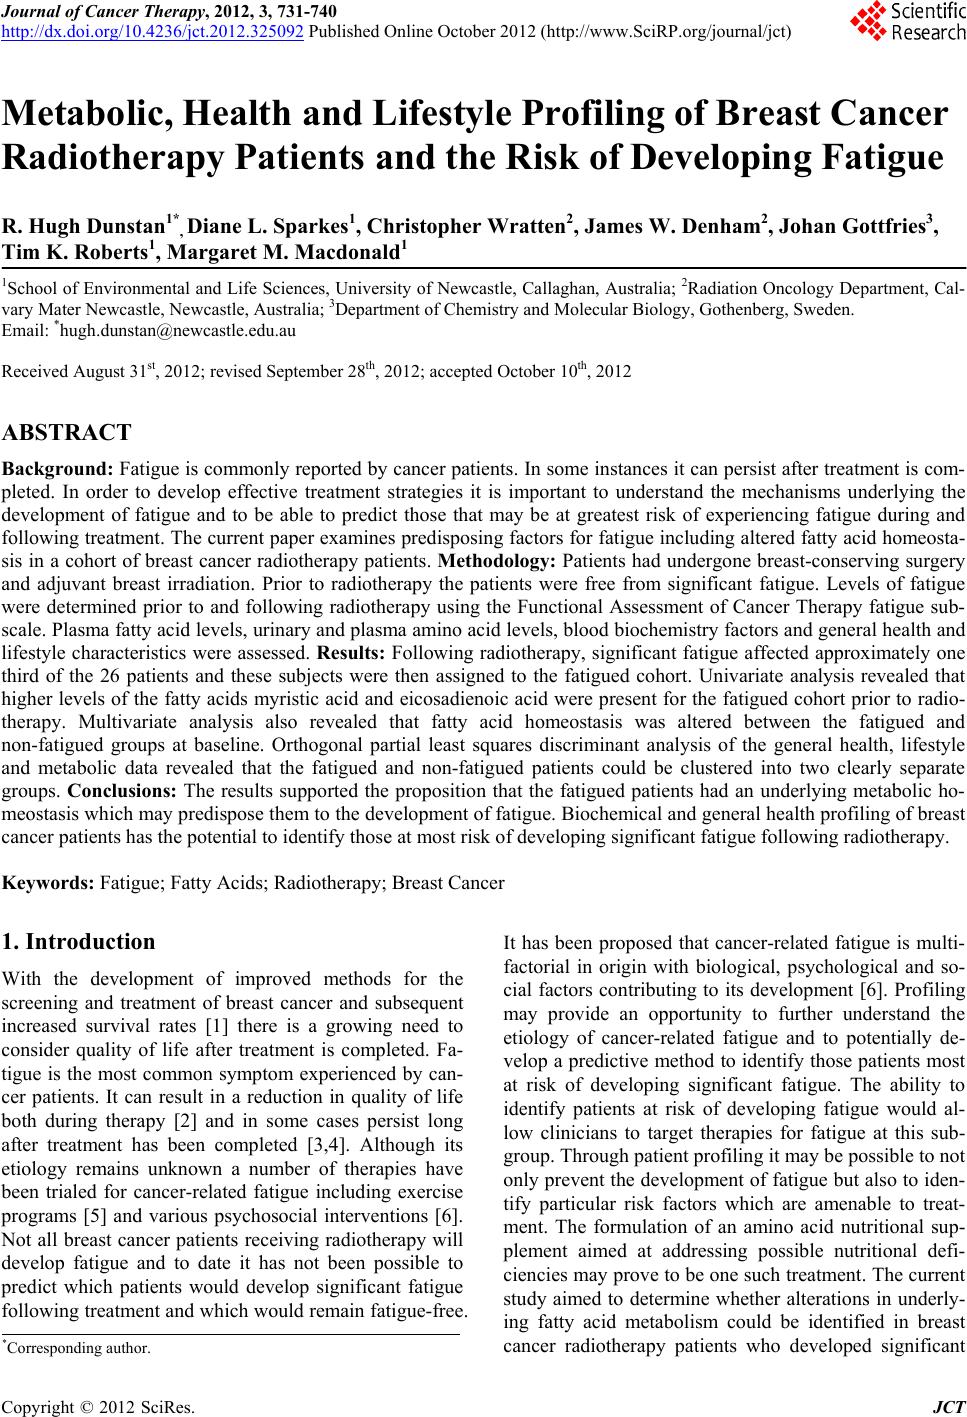
|