Journal of Geographic Information System, 2012, 4, 444-461
http://dx.doi.org/10.4236/jgis.2012.45049 Published Online October 2012 (http://www.SciRP.org/journal/jgis)
Land Capability Index Mapping for Waste Disposal
Landuse Option Using Geographic Information System
(GIS) in Enugu Area, South Eastern Nigeria
Augustine Onunkwo-Akunne, Samuel Okechukwu Onyekuru, Godwin Ifedilichukwu Nwankwor
Department of Geology, Federal University of Technology Owerri, Owerri, Nigeria
Email: Onyekuru2001@yahoo.com
Received January 2, 2012; revised February 5, 2012; accepted March 14, 2012
ABSTRACT
The projected 300% growth rate in the population of Enugu area and its environs by the year 2020 and the expected
increase in waste generation necessitated the need to map out areas for waste disposal for future utilization and as a
protective strategy for the environment in Enugu area. Land capability index mapping using Geographic Information
System (GIS) is one of the appropriate tools required for solving this problem. A total of 12 landuse determinants were
selected as thematic data layers, and as basic factors influencing the choice of waste disposal landuse option in the area.
The themes (thematic maps) generated from field/laboratory measurements and from literature, include slope, water
table, surface and subsurface water conditions, elevation, geology, soil, drainage and geo-structural stability (fault, ero-
sion, landslide and flooding) maps. The maps were scanned, digitized, georeferenced, and polygonized using autocard
drawing capabilities to convert them into vector format and later exported to arc view software for analysis. The final
processing using overlay model builder yields layers that display areas of preferred waste disposal sites in a map form,
which generally shows areas of varying suitability (suitable, moderately (low) suitable and unsuitable). The waste dis-
posal map of Enugu area shows that blocks 1 (Obeagu area) and 3 (Ebe/Nsude areas) represent suitable and unsuitable
areas, respectively, while block 2 (Ngwo area) has low suitability for waste disposal.
Keywords: Landuse; Thematic Maps; Waste Disposal; Land Capability
1. Introduction
The purpose of landuse planning is to make the best,
most sensible, practical, safe and efficient use of each
parcel of land [1]. Mapping of a land unit for a particular
purpose is an aspect of Landuse planning which ensures
maximum and safe utilization of land. Enugu area under
investigation is presently witnessing high rate of popula-
tion growth. Accordingly, a projection of the population
of Enugu area is pegged at approximately 300%, giving
rise to a population figure of about 3,237,298 people by
the year 2020, [2]. Problems of improper waste disposal
are always associated with over population in developing
countries of the world. This condition usually causes en-
vironmental degradation leading to contamination/pollu-
tion of the environment. It is therefore, necessary to map
out areas of varying capabilities for waste attenuation
and containment in the Enugu area for future utilization
and as a protective strategy for the environment.
Site evaluation for waste disposal involves the under-
standing of basic soil components and properties, mecha-
nisms operating in the soil and limitations of the mecha-
nisms in terms of pollutant loading rates. It also describes
the important criteria used in evaluating land for waste
disposal. The factors to be considered in such evaluations
include: climate, topography, drainage, soil properties,
groundwater, slope, surface water, fault and flood poten-
tial [3-11].
The application of Geographic Information System
(GIS) in the evaluation of land has widely been ac-
claimed to facilitate efficient decision making and plan-
ning of land use options, [12]. GIS consists of a set of
computerized tools and procedures that can be used to
effectively store, retrieve, overlay, correlate, manipulate,
analyze, query, display (both graphically and numerically)
and disseminate land related information, [13].
This approach is applied in the determination of areas
with varying degrees of suitability for waste disposal
land use option in the Enugu area and environs.
1.1. Location of Study Area
The study area is located within Latitudes 6˚16'N and
6˚31'N and Longitudes 7˚20'E and 7˚41'E covering an
C
opyright © 2012 SciRes. JGIS
A. ONUNKWO-AKUNNE ET AL. 445
areal extent of about 630 km2
(Figure 1). The area is also
located within the rain forest belt of Nigeria and has an
average annual rainfall of about 1100 mm a year, [14].
1.2. Topography of the Study Area
The most striking feature within the study area is Enu-
gu-Awgu escarpment. This escarpment is part of the
Nsukka–Okigwe Cuesta, which was formed by the resis-
tant sandstones of the lower part of the Ajali Sandstone
and the Mamu Formation (Figure 1), [15]. The elevation
of the escarpment ranges from 450 m to about 530 m,
while the slopes range between 3% and 6% in the dip
slope part to between 55% and 65% along the scarp face,
[16]. Terminating at the foot of the escarpment to the east
is the extensive undulating Cross River Plain, underlain
by the Enugu Shale.
1.3. Drainage
The Enugu-Awgu escarpment forms the most important
watershed separating the Cross River system to the east
from a network of streams flowing westwards towards
the Anambra Basin, [14]. The escarpment is also in-
dented with river valleys, which form the source of
streams rising at about the 305 m elevation and flowing
down into deep canyons and v-shaped gullies incised in
the weakly bedded and friable sandstones and sands of
the Ajali and Mamu Formations, [17]. The rivers and
rivulets give rise to dendritic drainage pattern, usually
developed in rocks with uniform resistance to weathering
and erosion, [18].
1.4. Geology
The study area lies in the Anambra Basin of southeastern
Nigeria. The basin is of Cretaceous to Tertiary age,
[15,19]. Five formations that underlie the study area in-
clude: Ezeaku Formation (Turonian), Awgu Ndiabo Shale
(Santonian), Asata-Nkporo/Enugu Shale (Campanian-
Maastrichtian), Mamu Formation (middle Maastrichtian)
and Ajali Sandstone (late Maastrichtian). The strati-
graphic succession is shown in Figure 2 and Table 1.
The formations are conformable, although minor discor-
dance may be present, but there is no evidence of any
prolonged break in sedimentation, [20].
1.5. Hydrogeology
The major water bearing units (aquifers) occur in the
Ajali Sandstone that underlie areas to the west of the
study area, with a generally deep static water table of
about 30 to 40 m deep, [21]. Aquifers also occur within
the Mamu Formation, while some aquitards occur within
the Enugu Shale, [18]. The aquitards, are fractured and
are tapped by hand dug wells which show high coliform
counts, [22]. In the eastern part of Enugu area, the static
water table occurs at an average depth of 5 to 9 m mak-
ing the area vulnerable to pollution. The generalized
depth to water table in the area is shown in Figure 3. It
shows that depth to water table decreases from west to
east. At the western section, the water table is at an av-
erage depth of 60 m and at the eastern section towards
the Cross River plain, the water table is very close to the
ground surface averaging about 9 m deep.
Figure 1. Location map showing Enugu area and environs.
Copyright © 2012 SciRes. JGIS
A. ONUNKWO-AKUNNE ET AL.
446
Figure 2. Geological map of Enugu area and environs.
Table 1. Generalized sedimentary sequences in southeastern Nigeria [15].
Age Formation Lithology
Maastrichtian 6.5 - 6.8 Ma Ajali Formation Friable sandstone with cross bedding.
Mamu Formation Alternating sequence of sandstone clay stone and shale with coal seams.
Campanian 78 - 82 Ma Nkporo. Enugu Shale Dark grey shale with clayey shale with clay lenses.
Santonian 78 - 82 Ma Awgu Formation Bluish grey shale with clay lenses.
Turonian 82 - 92 Ma Ezeaku Formation Black shale with clay and limestone lenses.
Figure 3. Water table map of the study area.
Copyright © 2012 SciRes. JGIS
A. ONUNKWO-AKUNNE ET AL.
Copyright © 2012 SciRes. JGIS
447
1.6. Soils 2.2. Laboratory Studies
The main soil types in the area are ferralithic and hy-
dromorphic soils, which are derived from the Ajali Sand-
stones and Enugu Shales underlying the area. The soils
derived from Enugu Shale are expansive and have hy-
draulic conductivity values of about 10–5 m/s, [23]. These
soils can be grouped into four classes (based on weath-
ering conditions): Ferralithic Soil (deep, friable and po-
rous), hydromorphic soil (saline soil), lithosoil (thin soils
mostly found on hill slopes) and forralithic soils, (Figure
4), [7].
Laboratory investigations carried out on the soils in-
cluded: particle size analysis, porosity, permeability and
Atterberg limit tests.
Samples for particle size distribution analysis were
first thoroughly disintegrated by alternate cycles of wet-
ting and drying. The disintegrated material was sieved
through 3.35 mm, 0.425 mm to 0.075 mm sieve meshes
after thoroughly shaking the samples with a standard
electric sieve shaker. The percentage by weight of soil
particles retained on each sieve mesh, were plotted
against sieve mesh size to obtain the size distribution
pattern of each sediment sample. The particle size distri-
bution of sediments less than 0.075 mm was determined
using the hydrometer method in accordance with [24] BS
standard. Only hydromorphic and ferralithic soils were
investigated using this method. The hydrometer analysis
is based on Stroke law and indicates the percentage of
clay fraction present in a sample of soil.
2. Materials and Methods
Data required for the analysis of land use options for
Enugu Area is divided into primary and secondary data
types. The primary data involved information obtained
from field and laboratory studies, while secondary data
included information obtained from literature and raw
data collated from ministries, parastatals, universities and
companies. The porosity and permeability of the soils were also
determined as one of the necessary parameters used in
delineating potential of an area for waste disposal lan-
duse option. The tests were carried out on the hydro-
morphic, ferralithic and forralithic soils using falling
head method.
2.1. Soil Sampling
Soil samples were taken randomly from two horizons at
Owa, Enugu, Ugwuafor and Agbani. Sampling was car-
ried out by pitting to a fairly considerable depth of 5 and
5.8 m horizons. Collection was made on fresh samples,
while indurated surfaces, humus sections and gravely
beds were avoided. The collected soils were preserved in
polythene bags and taken to the laboratory for necessary
soil tests in accordance with [24] BS standard.
3. Results and Data Analysis
The results of particle size distribution of 3 samples rep-
resenting the different soil types in Enugu area is pre-
ented in Tables 2-4 and Figures 5-7. The results s
Figure 4. Soil map of Enugu area.
A. ONUNKWO-AKUNNE ET AL.
448
Table 2. Grain size data for ferralithic soil.
Sieve Size (mm) Mass retained Cumulative mass retained (g) % Cum-mass retained % Passing
5.56 0 0 0 100
3.35 0.2 0.2 0.04 99.96
2.0 2.1 2.3 0.46 99.54
1.18 33.1 35.4 7.08 92.92
0.6 60.8 96.2 19.24 80.76
0.425 98.6 194.8 38.96 61.04
0.5 97.8 292.6 58.52 41.48
0.212 84.0 377.6 75.52 14.48
0.15 85.6 463.2 92.64 7.36
0.075 32.8 496.0 99.20 0.8
Received 3.4 499.4 99.98 0.02
Table 3. Grain size data for forralithic soil.
Sieve Size (mm) Mass retained Cumulative mass retained % Cum-mass retained % Passing
3.35 0 0 0 100
2.0 0.2 0.2 0.04 99.56
1.18 2.8 3.0 0.6 99.4
0.6 8.7 11.7 2.34 97.66
0.425 19.1 30.8 6.16 93.84
0.3 21.7 52.5 10.5 89.5
0.212 56.0 108.5 21.7 78.3
0.15 153.2 261.7 52.34 47.3
0.075 191.0 452.7 90.54 9.46
Received 47.0 495.7 99.94 0.06
Table 4. Grain size data for hydromorphic soil.
Sieve Size (mm) Mass retained(g) Cumulative mass retained (g) % Cum-mass retained % Passing
28.0 0 10 0 100
19.0 18.4 18.4 374 96.26
14.0 6.2 24.6 5.00 95.00
10.0 27.3 51.9 10.55 89.45
5.6 76.6 131.5 26.75 73.25
3.35 81.3 212.8 43.26 56.12
2.0 70.6 283.4 57.65 42.35
1.18 57.3 340.9 67.34 30.66
0.6 30.5 371.4 75.34 24.46
0.425 13.4 384.8 78.28 21.72
0.3 10.5 395.6 80.41 19.59
0.212 6.3 401.6 81.69 18.31
0.15 26.3 427.9 87.04 12.96
0.075 36.3 464.2 94.43 5.57
Received 17.7 481.9 98.03 1.97
Copyright © 2012 SciRes. JGIS
A. ONUNKWO-AKUNNE ET AL. 449
Figure 5. Grain size distribution of the forralithic soil (Owa).
Figure 6. Grain size distribution of the ferralithic soil (Ugwuafor).
Figure 7. Grain size distribution of the hydromorphic soil (Enugu).
Copyright © 2012 SciRes. JGIS
A. ONUNKWO-AKUNNE ET AL.
Copyright © 2012 SciRes. JGIS
450
show that forralithic soils can be grouped as sandy clay
soils while hydromorphic and ferralithic soils are silty
clay soils.
The plots of hydrometer analysis for the two soil types
(ferralithic and hydromorphic soils) are shown in Fig-
ures 8(a) and (b), which show that the clay fraction of
the hydromorphic soil is 13% and that of ferralithic soil
is 13.5% in the analyzed samples.
The result of the falling head test for some of soil
types in the study area is shown in Table 5. The For-
ralithic and hydromorphic soils have higher porosity and
permeability which corroborates the work of [25].
(a)
(b)
Figure 8. (a) Plot of grain size analysis result using hydrometer for ferralithic soil; (b) Plot of grain size analysis result using
hydrometer for hydromorphic soil.
A. ONUNKWO-AKUNNE ET AL. 451
Table 5. Permeability and porosity of soils in Enugu area.
Soil Type Pe rm eabi lity (cm/s) Porosity (%)
Hydromorphic Soil 1.97 × 10⁻² 31
Ferralithic Soil 1.89 × 10⁻² 30
Forralithic Soil 1.92 × 10⁻² 31
Similarly, the following physical properties of litho-
soils that also underlie part of the study area have also
been defined, [16]: shear strength = 88.36 N/m2, porosity
= 30% and permeability is 1.70 cm/s, soil group is silty
sand.
3.1. Engineering Classification of Soils
The Unified Soil Classification System (USCS; Table 6)
used particle size distribution and Atterberg Limit Data
(Tables 7-9) to describe two main soil groups in the
study area: coarse and fine grained soils. The plasticity
chart (Figure 9) also used grain size distribution and
Atterberg limit data (Tables 7-9) to characterize three
classes of soils in the study area (Forralithic Soil, Hy-
dromorphic Soil and Ferralithic Soil): Forralithic soils,
plotted on CL-ML field (Figure 9) representing silty clay
and poorly graded soils. Hydromorphic soil plotted on
SP-CL field which is silty clay and poorly sorted soils.
Ferralithic soil plotted on SW-CL field which is silty clay
and well sorted soils.
3.2. Thematic Maps
Twelve thematic maps generated from the various field
and laboratory operations and from literature were em-
ployed as basic landuse determinants in the study area.
The maps are the themes that form data layers for Geo-
graphic Information System (GIS) operation. The the-
matic maps were first scanned at 150 dpi (dot per inch)
esolutions, digitized, polygonized and georeferenced r
Table 6. Unified soil classification system.
Major
Divisions Subdivisions USCS
Symbol Typical Names
Laboratory
Classification
Criteria
Remarks
GW Well Graded Gravels, or gravel-
sand mixtures with little or no fines Less than 5% fines C –4 and 1 C 3
GP Poorly Graded Gravels, or
gravely sands, little or no fines Less than 5% fines Does not meet C and or
C criteria listed above
GM Silty Gravels and sand mixtures More than 12% fines Minus No. 40 Soils plot
above A Line
Gravels (More than
50% Retained on
No. 4 Sieve
GC Silty Gravels, Gravels and clay
Mixtures More than 12% fines Minus No. 40 Soils plot
above A Line
SW Well graded Sands or Gravelly
Sands, little or no fines Less than 5% fines C –6 and 1 C 3
SP Poorly Graded Sands or Gravelly
Sands little or no fines Less than 5% fines Does not meet C and or
C criteria listed above
SM Silty Sands, Sand Silt Mixtures More than 12% fines Minus No. 40 Soils plot
above A Line
Coarse Grained
Soil (More than
50% Retained
on No. 200
Sieve
Sands (50% or
more of coarse
fraction passing
No. 4 Sieve)
SC Clayey Sands, Clay-Sand
Mixtures More than 12% fines Minus No. 40 Soils plot
above A Line
ML Inorganic silts, rock, flour, silts
of low plasticity Inorganic soil PL < 4 or Plots below A
Line
CL Inorganic Clays of low plasticity
(Gravel Clays, Sandy Clays, etc. Inorganic soil PL > 7 or Plots above A
Line
Silts and Clays
(Liquid Limit <
50%)
OL Organic Silts, Organic Clays
of low plasticity Organic soil LL (Oven-Dried) LL
(Not Oven Dried) 0.75
MH Inorganic silts, micaceous silts,
silts of high plasticity Inorganic soil Plots below A Line
CH Inorganic highly plastic Clays,
fat clays, silty clays, etc. Inorganic soil Plots on or above A line
Fine Grained
Soils (50% or
more passes
No. 200 Sieve
Silts and Clays
(Liquid Limit 50%
or more)
OH Organic Silts and Organic Clays
of high plasticity Organic soil LL (Oven-Dried) LL
(Not Oven Dried) 0.75
Peat Highly Organic PT
Peat and other highly
organic soils
Primary organic
matter, dark in colour
Copyright © 2012 SciRes. JGIS
A. ONUNKWO-AKUNNE ET AL.
452
Table 7. Soil parameters determined for forralithic soils.
US Sieve % passing Atterberg limits
N04 (3.35) 99.96
N010 (2.0) 99.54
N040 (0.425) 01.04
N0100 (0.15) 7.36
N0200 (0.075) 0.8
LL = 26.06%
PL = 19.75%
PI = 6.31%
Table 8. Soil parameters determined for hydromorphic
soils.
US Sieve % passing Atterberg limits
N04 (3.35) 100
N010 (2.0) 99.6
N040 (0.425) 93.8
N0100 (0.15) 47.3
N0200 (0.075) 9.5
LL = 43.3%
PL = 16.89%
PI = 26.46%
Table 9. Soil parameters determined for ferralithic soils.
US Sieve % passing Atterberg limits
N04 (3.35) 56.12
N010 (2.0) 42.35
N040 (0.425) 21.96
N0100 (0.15) 12.96
N0200 (0.075) 5.57
LL = 39.84%
PL = 14.70%
PI = 25.14%
Figure 9. Unified soil classification system-plasticity chart.
with 4 control points of 6˚16'N and 6˚31'N (Latitude) and
7˚20'E and 7˚41'E (Longitude). The digitized thematic
maps include: elevation map, slope map, soil depth map,
drainage map, soil class map, surface water map, depth
to water table map, erosion map, escarpment map, fault
map, flood/landslide map and geologic map of the study
area (Figures 10-21). These data base (thematic maps)
were modified using excel statistical software and geo-
graphic calculator and arranged as distinct layers. Data
analysis also involved conversion of the collected eleva-
tion values and coordinates to national grid. With the aid
of the topographic map of Enugu area and the Geo-
graphic Positioning System (GPS), the 3D Digital Ter-
rain Model (DTM) of the study area was developed in
Arc view by the extrapolation of elevation values at 100
m range (Figure 22). The DTM of the area revealed de-
tailed picture of the drainage pattern that aided selection
of waste disposal sites free from environment of internal
drainage, [3].
3.3. Organization of Geographic Input Data
and the Establishment of GIS Data Layers
The thematic data layers used in this work are relevant
for waste disposal land use option (Table 10). The scale
values of the tables are the capability ratings assigned to
each environmental factor based on a scale of 0 - 2, to
make up three classes of landuse representing zones of
unsuitable (0), low suitability (1) and suitable (2). A zero
(0) capability value renders the land of any area very
unsuitable as the capability values of other landuse fac-
tors within the same polygon remains zero irrespective of
their high suitability values, [26].
3.4. Overlay Process
The input themes (thematic layers) were overlaid using
computer iterative technique starting from theme I to 12
(Figure 23). This operation was done by the selection of
a model builder from the operational table (Table 10)
using the Arc view software. Individual themes are added
to one another using the matrix operation of the form:
1
12
T Scale Value:
T



This operation produced a waste disposal land use map
(Figure 24). The waste disposal map shows that areas 1
(Obeagu area) and 3 (Ebe/Nsude areas) represent suitable
and unsuitable areas, respectively, while 2 (Ngwo area)
has low suitability for waste disposal.
4. Discussion
The result of the overlay operations produced the pre-
ferred areas for waste disposal land use option. The map
shows various areas of capabilities for waste disposal
designated as areas 1, 2 and 3 representing suitable, un-
suitable and low suitability, respectively. The study
shows that area 1 (Obeagu area) occupies 60% of the
land area that is suitable for waste disposal. This means
that the greater percentage of Enugu area is suitable for
Copyright © 2012 SciRes. JGIS
A. ONUNKWO-AKUNNE ET AL. 453
Figure 10. Digitized elevation map of Enugu area.
Figure 11. Digitized slope map of the study area.
Copyright © 2012 SciRes. JGIS
A. ONUNKWO-AKUNNE ET AL.
454
Figure 12. Soil-depth maps of the study are a .
Figure 13. Digitized and polygonized soil drainage maps.
Copyright © 2012 SciRes. JGIS
A. ONUNKWO-AKUNNE ET AL. 455
Figure 14. Digitized and polygonized soil class map.
Figure 15. Digitized and polygonized surface water map.
Copyright © 2012 SciRes. JGIS
A. ONUNKWO-AKUNNE ET AL.
456
Figure 16. Digitized and polygonized wate r table map.
Figure 17. Digitized and buffered gully erosion map.
Copyright © 2012 SciRes. JGIS
A. ONUNKWO-AKUNNE ET AL. 457
Figure 18. Digitized and polygonized esc ar pment map.
Figure 19. Digitized and buffered fault map.
Copyright © 2012 SciRes. JGIS
A. ONUNKWO-AKUNNE ET AL.
458
Figure 20. Digitized geological map of Enugu area and environs.
Figure 21. Digitized, buffered, landslide and flooded area.
Copyright © 2012 SciRes. JGIS
A. ONUNKWO-AKUNNE ET AL. 459
Figure 22. Digital terrain model map of Enugu area.
Table 10. Organization of thematic data layers for w aste disposal landuse option.
Input Theme Percentage
Influence Input
Field Input Label Scale Value Remarks
Slope Theme 1
(Layer 1) 10%
1
2
3
0-9(Gentle Slope)
9-19( sloppy)
> 19 ( steep)
2
1
0
Down migration of
leachate
Elevation Theme 2
(Layer 2) 6%
Used in the derivation of
DEM for slope
computation
Soil Depth Theme 3
(Layer 3) 5%
1
2
3
Deep
Deep
Shallow
2
2
1
Attenuation of pollutants
Geology Theme 4
(Layer 4) 20%
1
2
3
4
5
Ajali FM
Mamu FM
Asata/Nkporo
Awgu-Ndi Abo
Ezeaku
2
1
1
2
1
Based on geological
characteristics e.g.
Fractured rocks enhance
the migration of pollutants
Drainage Theme 5
(Layer 5) 10%
1
2
3
Moderate
Moderate
Well Drained
1
1
2
Poorly Drained soil can
lead to reducing
conditions
Soil Class Theme 6
(Layer 6) 5%
1
2
3
4
Sandy (Foralithic)
Clayey Sand (Hyromorphic)
Silty Sand (Lithosoil)
Sandy Clay (Ferralithic)
1
2
0
1
Based on soil
Engineering classification
Surface Water
Theme 7 (Layer 7) 8% Buffered 1000 m (1 km)
Depth To Water Table
Theme 8 (Layer 8) 9%
1
2
3
Very Shallow
Shallow
Deep
1
2
3
Can be polluted when
shallow
Erosion Theme 9
(Layer 9) 8% 1
2
Buffered
Active
Non Active
0
0
0
Can distribute wastes GIS
Buffer (1 km)
Escarpment Theme 10
(Layer 10) 4%
Scarp
Crest
Dip
0
1
2
Escarpment is
characterized by high
slope.
Flooded/Land Slide
Theme 11 (Layer 11) 5% 1
2
Buffered
Active
Non Active
0
0
Reducing condition
distribution of wastes and
leachate Buffer 1 km)
Fault Theme 12
(Layer 12) 10% 1
2
Buffered
Active
Non Active
0
0
0
Can create pathway for
leachate migration to
ground water. GIS buffer
(1 km)
Total 100%
Copyright © 2012 SciRes. JGIS
A. ONUNKWO-AKUNNE ET AL.
Copyright © 2012 SciRes. JGIS
460
Figure 23. Overlay model for waste disposal land use.
Figure 24. Suitability map for waste disposal land use option in Enugu area.
waste disposal except Enugu Metropolis. The western
quadrant is suitable due to low water table conditions,
considerable soil thickness of about 19 m and very high
sorption capacities due to the presence of fines in the
samples. Areas of low suitability for waste disposal
(Area 2: Ngwo area) occupy 20% of the land area, and
falls mainly around the escarpment and the eastern end of
the map. The low suitability in Area 2 is a function of
steep slopes of around 50%, seepage at the foot of the
escarpment due probably to high pore water pressure,
and very shallow water table conditions. The unsuitable
zones for waste disposal—Area 3 (Ebe/Nsude areas) also
occupy about 20% of the land area and correspond to
fault zones, scarp face terrain, flood and landslide prone
areas.
If a terrain is suitable for waste disposal, such a land
has an advantage over unsuitable areas as leachates are
easily attenuated by natural processes, hence the envi-
ronment is protected and safe for man to live. Natural
protection also saves huge costs required in waste man-
agement, especially in constructing engineered systems
in areas that have high suitability for residential land use
A. ONUNKWO-AKUNNE ET AL. 461
but low suitability for waste disposal landuse option. In
such areas the international standard practice of leachate
treatment, containment and discharge into the environ-
ment should be observed.
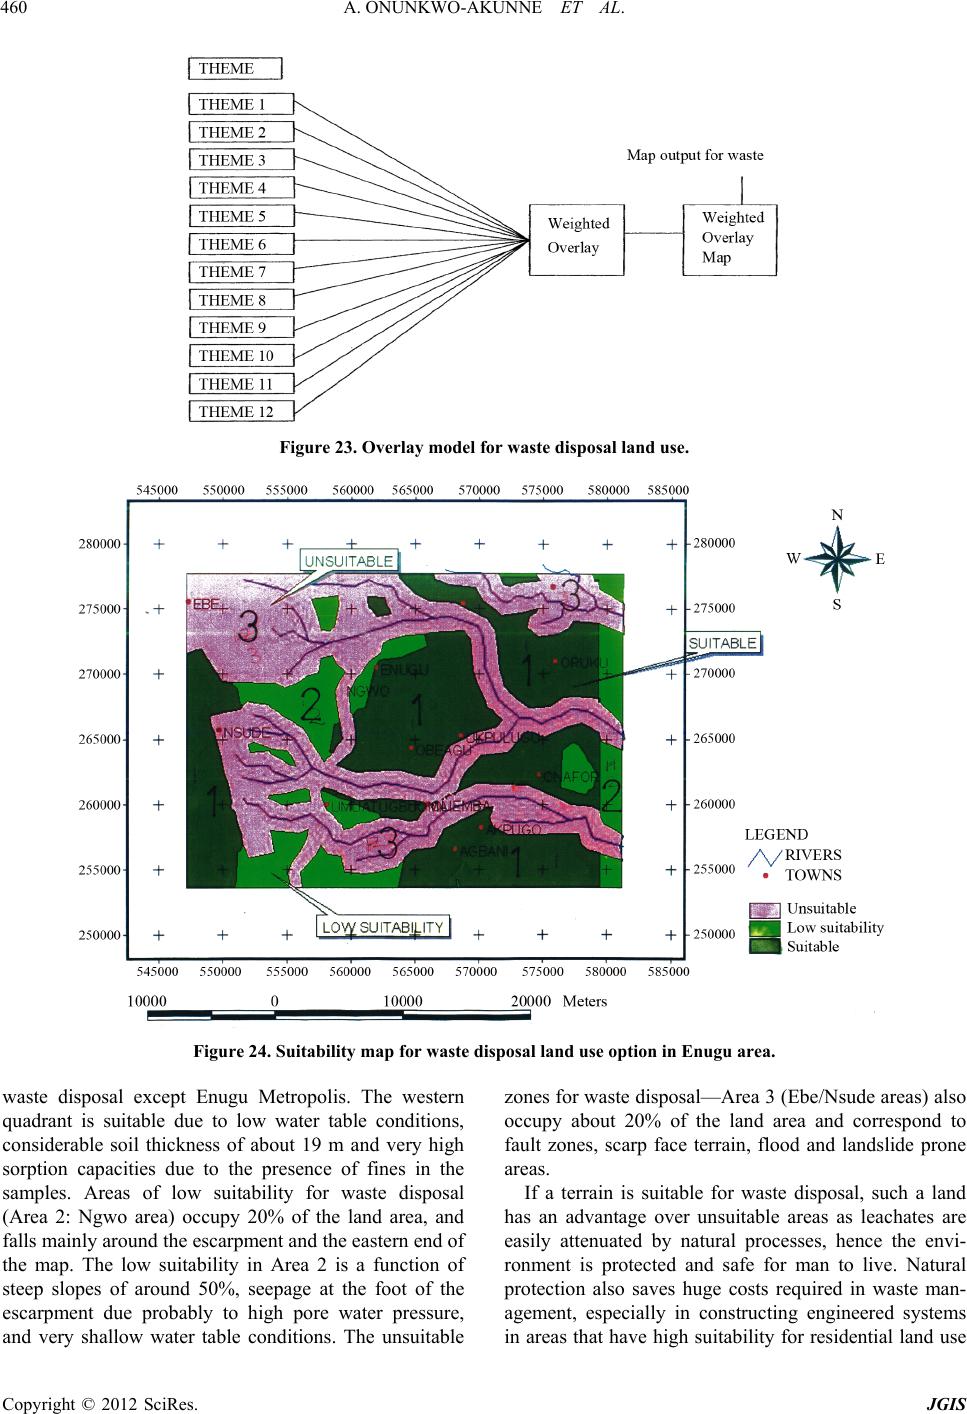
The area at Ugwuaji off Enugu-Port Harcourt ex-
pressway presently mapped out and used by Enugu State
Environmental Sanitation Authority (ESESA) for the
disposal of the wastes falls in one of the areas of high
suitability of the present study. This implies that its pre-
sent position is well cited. Most industries and residential
buildings within Enugu Metropolis also correspond to
areas of low suitability for waste disposal.
5. Conclusion
This study has shown that the area suitable for waste
disposal practices in Enugu Area cover the greater per-
centage of the land unit and are found within the western,
central and to a reasonable extent, the eastern blocks.
Some of the available lands were adjudged unsuitable
due to faults, erosion, landslides, floods and scarp face.
This study is therefore expected to form the basis for
future landuse management for enhanced sustainable
development and better planning of Enugu area and en-
virons.
REFERENCES
[1] L. V. Dutra and R Hober, “Primary Forest and Landcover
Contextual Brazil Proceedings on International Geo-
sciences and Remote Sensing Symposium,” USA, 1998,
pp. 5-35.
[2] “Nigerian Population Census,” Enugu State Government
Gazette, 2006.
[3] C. C. Raymond, “Land Application of Wastes,” John
Wiley and Sons Publishers, Hoboken, 1979, pp. 150-160.
[4] S. A. Griffiths, “Land Treatment of Leachate for Munici-
pal Landfills Nayea Publications,” 1981, pp. 210-216.
[5] P. N. Gauley and R. B. Korne, “Soil Mantle as a Waste
Treatment System,” University of California, Berkely,
1966, pp. 120-131.
[6] W. R. Aria, “Principles of Geotechnics, Environmental
Protection Service,” Harwood Academic Publishers, New
York, 2003, pp. 85-124
[7] R. Davis and G. Rogers, “Landfill Evaluation and Siting
Study New Jersey,” John Wiley and Sons Publishers,
Hoboken, 1975, pp. 240-285.
[8] P. Crynine, “Land Disposal of Solid Wastes CBS Pub-
lishers and Distributors,” New Deihi, 1977, pp. 850-930.
[9] C. B. Hunt, “Geology of Soils, Their Evolution, Classifi-
cation and Uses,” W. H. Freeman, San Francisco, 2002,
pp. 130-172.
[10] M. J. Hammer, “Water and Waste Water Technology,”
2nd Edition, Wiley publisher’s, New York, 2003, pp
230-238.
[11] P. C. Sidle, “Relative Importance of Factors Influencing
Landsliding in Coastal Alaska,” Proceedings of Annual
Engineering Geology and Soil Engineering Symposium,
Juneau, 1985, pp. 34-38.
[12] D. A. Holland and S. L. Smith, “The Effect of Changing
Grid in the Creation of Laser Scanner, Digital Surface
Models in Geo-Computation,” Oxford University Press,
Oxford, 2003, pp. 230-240.
[13] V. C. Kang, “Introduction to Geographic Information
System,” Tata McGraw-Hill Publishing Company Ltd.,
New Delhi, 2002, pp. 20-25.
[14] N. P. Iloeje, “A New Geography of Nigeria,” Revised
Edition, Williams Clowes Ltd., London, 1981, pp. 85-
120.
[15] R. A. Reyment, “Aspect of the Geology of Nigeria,”
Ibadan University Press, Ibadan, 1965, pp. 22-38.
[16] G. E. K Ofomata, Technical Report on Feasibility Study
of Erosion Vulnerability Areas in the Eastern Part of Ni-
geria Ethiope Publishing House, Britain, 1985, pp. 35-37.
[17] L. C. Amajor, “Sedimentary Facies Analysis of the Cam-
pano-Maestritchtian Ajali Sandstone Okigwe Area Nige-
ria,” 20th Annual Conference of Nigeria Mining and Geo-
sciences Society, Vol. 13, Nsuka, 1984, p. 11.
[18] B. C. E. Egboka, “Water Resources Problem in the Enugu
Area of Enugu State,” Nigerian Journal of Mining Geol-
ogy, Vol. 20, 1993, pp. 1-6.
[19] R. C. Murat, “Stratigraphy and Paleogeography of Creta-
ceous and Lower Tertiany in Southern—Nigeria, African
Geology,” Ibadan University Press, Ibadan, 1972, pp.
251-266.
[20] A. Simpson, “The Nigerian Coal Field: The Geology of
Part of Onitsha, Owerri and Benue Provinces,” Geology
Survey Nigeria Bulletin, 1954, p. 24.
[21] G. I. Nwankwo, B. C. Egboka and I. P. Orajaka,
“Groundwater Occurrence and Flow Patterns in the
Enugu Coal-Mine Areas, Anambra State, Nigeria,” Hy-
drological Sciences Journal, Vol. 33, No. 5, 1988, pp.
465-485. doi:10.1080/02626668809491275
[22] E. C. Ezeanyim, “Hydrogeology of Enugu Area and En-
virons,” Master’s Thesis, University of Nigeria, Nsukka,
1988.
[23] B. C. E. Egboka and F. O. Onyebueke, “NAH Journal on
Acute Hydro-Geological Problems, VIS a VIS Planning
and Management of Developing Economy. A Case Study
of Enugu Area, Nigeria,” 1999.
[24] “Annual Book of ASTM Standard Vol. 04, Soil and Rock
Standard Practice for Particle Size Analysis and Deter-
mination of Soil Constants,” West Conshokockem, 2000,
pp. 8-9.
[25] Chengliu and Evett, “Soil Properties,” 2nd Edition, Pren-
tice Hall Inc., Englewood Cliffs, 2000, p. 28.
[26] F. J. Chapin, “Urban Land Use Planning,” University of
Illinois Press, Champaign, 1965, pp. 34-48.
Copyright © 2012 SciRes. JGIS