 Journal of Geographic Information System, 2012, 4, 403-411 http://dx.doi.org/10.4236/jgis.2012.45046 Published Online October 2012 (http://www.SciRP.org/journal/jgis) Potential Hazard Map for Disaster Prevention Us ing GIS-Based Linear Combination Approach and Analytic Hierarchy Method Szu-Hsien Peng1, Meng-Ju Shieh1, Shih-Yi Fan2 1Department of Spatial Design, Chienkuo Technology University, Changhua City, Chinese Taipei 2Economic Affairs Department, Changhua County Government, Changhua City, Chinese Taipei Email: shpeng@cc.ctu.edu.tw Received August 1, 2012; revised August 31, 2012; accepted September 28, 2012 ABSTRACT In recent years, global warming has gradually become obvious, thus created the climate change. Typhoon Morakot at- tacked Taiwan and brought heavy rainfall in August, 2009. In mountainous areas including Central and South Taiwan, the flood and debris flow disasters were induced by the typhoon. In this study, Changhua City is selected as the research region and the Delphi method is employed to interview experts and establish comprehensive evaluation criteria for as- sessing the evacuation plan on disaster areas. The concept is to combine the landslide potential analysis by geographic information systems with the flood or debris flow maps into the potential hazard map. Meanwhile, analytic hierarchy method (AHP) is comprehensively carried on the expert questionnaire survey for the potential hazard map of the com- pound disaster states. It should be useful for the local government and native people in the future. Keywords: Geographic Information Systems; Potential Hazard Map; Analytic Hierarchy Method (AHP) 1. Introduction With the gradually apparent global warming causing the climate change, Typhoon Morakot attacked the central and southern Taiwan in August 2009 and resulted in se- rious disasters. With the unusual route of Typhoon Mo- rakot, its long stay in Taiwan, and the effect of southwest monsoon, the heavy rainfall caused major disasters. Ac- cording to the estimation of Water Resources Agency [1], the rainfall reached the world extreme record. Besides, regarding the historical rainfall in one day, Typhoon Morakot was also ranked at the top. Climate change re- sulted from global warming is expected to result in simi- lar events in the future. The entire Taiwan experienced such heavy rainfall during the attack of Typhoon Mora- kot that various disasters were caused by long-period, high-intensity, and wide-spread rainfall, such as floods, debris flows, landslides, and landslide-dammed lakes [2,3]. In face of the reflection on natural disasters and disaster relief operations as well as in corresponding to the change of climate and natural environment, a lot of thinking models should be adjusted. How to arrange secure and prompt evacuation points has therefore become one of the primary research issues. A multi-criteria evaluation (MCE) method can usually deal with the available information concerning choice-possibilities in regional planning. Meanwhile, weighted linear combination (WLC) is one of the widely employed MCE methods for land suitability analysis [4]. Besides, flood risk and flood damage esti- mates are studied by spatial multi-criteria analysis, geo- graphic information systems (GIS) and mathematical models [5-8]. The previous researches offered the know- ledge of flood risk in different spatial locations for devel- oping effective flood mitigation strategy and damage es- timation for a watershed or regional planning. Therefore, with analytic hierarchy process (AHP) to proceed expert questionnaire survey and to analyze the weight of various factors, this study aims to collect map data related to landslide, flood potential analysis, debris flow potential areas, and land use in Changhua City. The map overlaying analysis in geographic information sys- tems (GIS) is utilized for establishing the compound po- tential hazard map. The research outcomes are expected to provide the relevant sectors evaluating the original hideout points, evacuation routes or evacuation system, and disaster prevention. 2. Research Method With linear combination method to evaluate the com- pound potential hazard map, the combination would give C opyright © 2012 SciRes. JGIS  S.-H. PENG ET AL. 404 each factor a relative weight when evaluating the appro- priateness of factor attribute toward the evaluated subject. Analytic hierarchy process (AHP) was applied to de- signing the expert questionnaire for the weights of fac- tors. With pair wise comparison to estimate the eigen- vector for the weight of the criteria [9], the weight was directly evaluated by the map overlaying analysis in geographic information systems (GIS). AHP and the map overlaying in GIS are briefly described as follows. 2.1. Analytic Hierarchy Process (AHP) Analytic hierarchy process (AHP) could master the fac- tors in decision-making with hierarchic structures. The nominal scale is applied to pair comparison among factors so that the uncountable human feelings and preference are quantified and the pair comparison matrix is established for the eigenvector for the priority. It presents the charac- teristics of structure, complex scale, rational pair com- parison, and integrating opinions from different deci- sion-makers with the weighted average value. Since Saaty first proposed AHP in 1971 and published the introduc- tion in 1980, the book was revised in 1986 and AHP has been widely applied to decision analysis practices. In order to obtain the relative importance of factors, they are paired for comparison. According to the sugges- tion of Saaty of nine-scale (Table 1), it could be designed a paired questionnaire. When there are n criteria, n(n – 1)/2 times pair comparisons are required, Table 2. The compared results are established paired positive reciprocal matrices, where aij is the compared value between i and j, and the main diagonal is the self-comparison of factors that the value appears 1. The compared questionnaire be- comes the value on the top-right of the diagonal in the matrix, while the value on the bottom-left of the diagonal is the reciprocal, i.e., aji = 1/aij. When pair evaluation is preceded, the entire geometric mean is regarded as the representative. The pair matrix A is shown as below: 12 1121 212 122 121 2 1 ...1... 1 ...11... ... ... ... 111... 1 n n nnn n aaa a aaa aaa a A For the relative weight among factors, the eigenvalue solution in numerical analyses could be utilized for the maximum eigenvalue and the correspondent eigenvector. According to AHP, pair comparison should satisfy the transitivity of preference and strength. Nevertheless, the actual evaluation could hardly satisfy such a hypothesis. Saaty therefore considered consistency tests for pair evaluation, including the steps of 1) Calculating Consistency Index (C.I.) max .. 1 n CI n ; (2) 2) Calculation Consistency Ratio (C.R.) .. .. .. CI CR RI , (3) where λmax is the maximum eigenvalue of the matrix, n is the matrix rank, and R.I. (Random Index) is the consis- tency index of the random matrix. R.I. value is related to the matrix level that the correspondent R.I. values could be found on the matrix level (Table 3). Saaty [10] regarded the comparison being randomly generated when C.R. approached 1 and the consistency being higher when C.R. approached 0. In general, C.R. ≤ 0.1 was considered acceptable, while C.R. > 0.1 showed the inconsistency that they had to be re-compared. After calculating the weight among factors in the hierarchies, the weight of the overall hierarchy should also be calcu- lated. 2.2. Map Overlaying Analysis in Geographic Information Systems n n a (1) Map overlaying is regarded as the major operation in analyzing the environmental features for regional plan- ning [11]. Basically, it classifies various environmental factors by space distribution characteristics and proceeds overlaying with evaluations. When computer technology was rapidly progressed in 1970s, it gradually replaced manually map overlaying and reduced time consuming and human errors. Geographic information systems de- veloped for distinct purposes rapidly grew in 1980s that he map overlaying analysis became one of the functions t Table 1. The meaning and description of scales for pair comparison with AHP (source: Saaty, 1990 [10]). Scale Definition Description 1 Equally important The contribution of the two factors is equally important. 3 Slightly important Experiences and judgment slightly tend to certain factor. 5 Quite important Experiences and judgment strongly tend to certain factor. 7 Extremely important Experiences and judgment extremely strongly tend to certain factor. 9 Absolutely important There is sufficient evidence for absolutely tending to certain factor. 2,4,6,8 The median between two neighboring scales In between two judgments Copyright © 2012 SciRes. JGIS 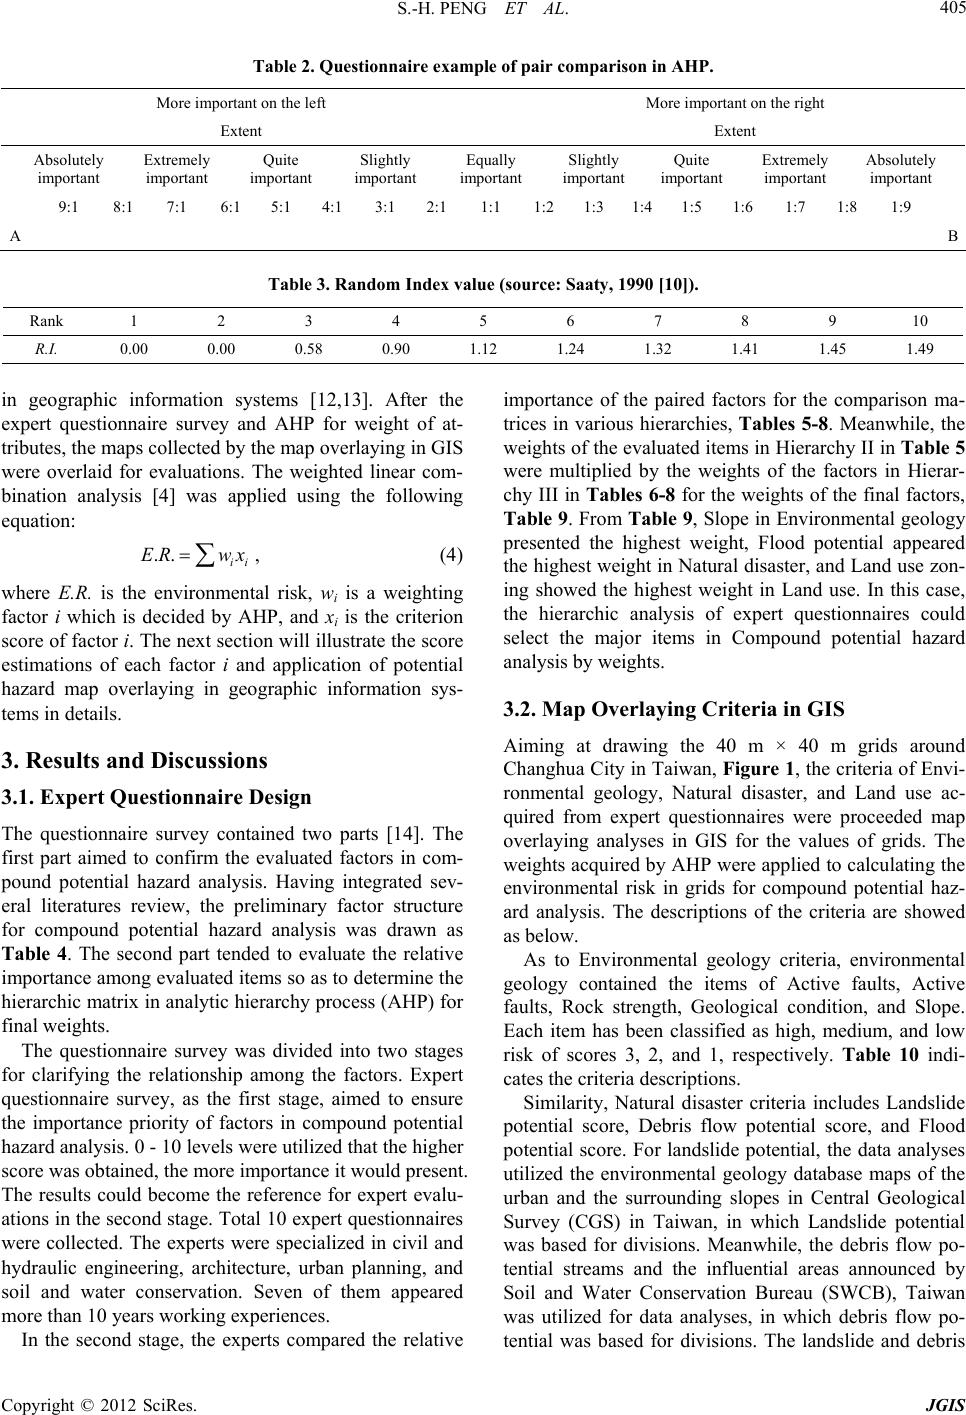 S.-H. PENG ET AL. 405 Table 2. Questionnaire example of pair comparison in AHP. More important on the left More important on the right Extent Extent Absolutely important Extremely important Quite important Slightly important Equally important Slightly important Quite important Extremely important Absolutely important 9:1 8:1 7:1 6:15:1 4:1 3:1 2:11:1 1:21:3 1:41:5 1:6 1:7 1:8 1:9 A B Table 3. Random Index value (source: Saaty, 1990 [10]). Rank 1 2 3 4 5 6 7 8 9 10 R.I. 0.00 0.00 0.58 0.90 1.12 1.24 1.32 1.41 1.45 1.49 in geographic information systems [12,13]. After the expert questionnaire survey and AHP for weight of at- tributes, the maps collected by the map overlaying in GIS were overlaid for evaluations. The weighted linear com- bination analysis [4] was applied using the following equation: .. ii ER wx, (4) where E.R. is the environmental risk, wi is a weighting factor i which is decided by AHP, and xi is the criterion score of factor i. The next section will illustrate the score estimations of each factor i and application of potential hazard map overlaying in geographic information sys- tems in details. 3. Results and Discussions 3.1. Expert Questionnaire Design The questionnaire survey contained two parts [14]. The first part aimed to confirm the evaluated factors in com- pound potential hazard analysis. Having integrated sev- eral literatures review, the preliminary factor structure for compound potential hazard analysis was drawn as Table 4. The second part tended to evaluate the relative importance among evaluated items so as to determine the hierarchic matrix in analytic hierarchy process (AHP) for final weights. The questionnaire survey was divided into two stages for clarifying the relationship among the factors. Expert questionnaire survey, as the first stage, aimed to ensure the importance priority of factors in compound potential hazard analysis. 0 - 10 levels were utilized that the higher score was obtained, the more importance it would present. The results could become the reference for expert evalu- ations in the second stage. Total 10 expert questionnaires were collected. The experts were specialized in civil and hydraulic engineering, architecture, urban planning, and soil and water conservation. Seven of them appeared more than 10 years working experiences. In the second stage, the experts compared the relative importance of the paired factors for the comparison ma- trices in various hierarchies, Tables 5-8. Meanwhile, the weights of the evaluated items in Hierarchy II in Tabl e 5 were multiplied by the weights of the factors in Hierar- chy III in Tables 6-8 for the weights of the final factors, Table 9. From Table 9, Slope in Environmental geology presented the highest weight, Flood potential appeared the highest weight in Natural disaster, and Land use zon- ing showed the highest weight in Land use. In this case, the hierarchic analysis of expert questionnaires could select the major items in Compound potential hazard analysis by weights. 3.2. Map Overlaying Criteria in GIS Aiming at drawing the 40 m × 40 m grids around Changhua City in Taiwan, Figure 1, the criteria of Envi- ronmental geology, Natural disaster, and Land use ac- quired from expert questionnaires were proceeded map overlaying analyses in GIS for the values of grids. The weights acquired by AHP were applied to calculating the environmental risk in grids for compound potential haz- ard analysis. The descriptions of the criteria are showed as below. As to Environmental geology criteria, environmental geology contained the items of Active faults, Active faults, Rock strength, Geological condition, and Slope. Each item has been classified as high, medium, and low risk of scores 3, 2, and 1, respectively. Table 10 indi- cates the criteria descriptions. Similarity, Natural disaster criteria includes Landslide potential score, Debris flow potential score, and Flood potential score. For landslide potential, the data analyses utilized the environmental geology database maps of the urban and the surrounding slopes in Central Geological Survey (CGS) in Taiwan, in which Landslide potential was based for divisions. Meanwhile, the debris flow po- tential streams and the influential areas announced by Soil and Water Conservation Bureau (SWCB), Taiwan was utilized for data analyses, in which debris flow po- tential was based for divisions. The landslide and debris Copyright © 2012 SciRes. JGIS 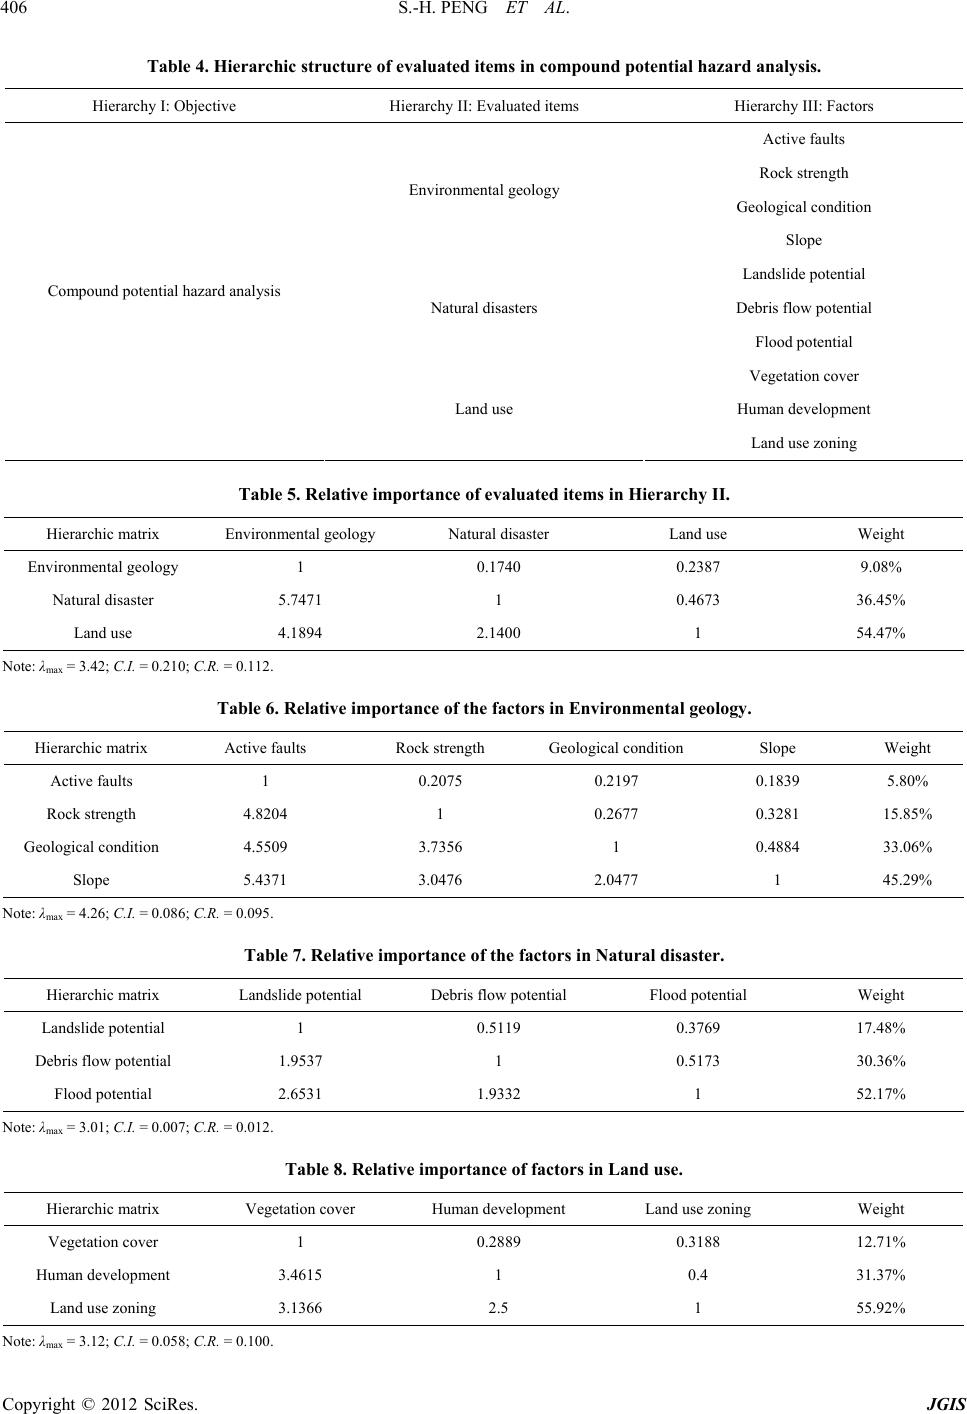 S.-H. PENG ET AL. 406 Table 4. Hierarchic structure of e valuate d items in compound potential hazar d analysis. Hierarchy I: Objective Hierarchy II: Evaluated items Hierarchy III: Factors Active faults Rock strength Geological condition Environmental geology Slope Landslide potential Debris flow potential Natural disasters Flood potential Vegetation cover Human development Compound potential hazard analysis Land use Land use zoning Table 5. Relative importance of evaluated items in Hierarchy II. Hierarchic matrix Environmental geology Natural disaster Land use Weight Environmental geology 1 0.1740 0.2387 9.08% Natural disaster 5.7471 1 0.4673 36.45% Land use 4.1894 2.1400 1 54.47% Note: λmax = 3.42; C.I. = 0.210; C.R. = 0.112. Table 6. Relative importance of the factors in Environmental geology. Hierarchic matrix Active faults Rock strength Geological condition Slope Weight Active faults 1 0.2075 0.2197 0.1839 5.80% Rock strength 4.8204 1 0.2677 0.3281 15.85% Geological condition 4.5509 3.7356 1 0.4884 33.06% Slope 5.4371 3.0476 2.0477 1 45.29% Note: λmax = 4.26; C.I. = 0.086; C.R. = 0.095. Table 7. Relative importance of the factors in Natural disaster. Hierarchic matrix Landslide potential Debris flow potential Flood potential Weight Landslide potential 1 0.5119 0.3769 17.48% Debris flow potential 1.9537 1 0.5173 30.36% Flood potential 2.6531 1.9332 1 52.17% Note: λmax = 3.01; C.I. = 0.007; C.R. = 0.012. Table 8. Relative importance of fact or s in Land use. Hierarchic matrix Vegetation cover Human development Land use zoning Weight Vegetation cover 1 0.2889 0.3188 12.71% Human development 3.4615 1 0.4 31.37% Land use zoning 3.1366 2.5 1 55.92% Note: λmax = 3.12; C.I. = 0.058; C.R. = 0.100. Copyright © 2012 SciRes. JGIS  S.-H. PENG ET AL. 407 Table 9. Weights of evaluated factors in Analytic Hierarchy Process (AHP). Hierarchy I: Objective Hierarchy II: Evaluated itemsHierarchy III: Factors Weight Active faults 0.53% Rock condition 1.44% Geological condition 3.00% Environmental geology Slope 4.11% Landslide potential 6.37% Debris flow potential 11.06% Natural disaster Flood potential 19.01% Vegetation cover 6.92% Human development 17.09% Compound potential hazard analysis Land use Land use zoning 30.46% Table 10. The descriptions of the criteria score. Evaluated items Factors Score Description High risk (3) The base locates within 100 m from confirmed fault area Medium risk (2) The base locates within 100 m - 1000 m from confirmed fault area Active faults Low risk (1) The base locates more than 1000m away from confirmed fault area High risk (3) Rock strength below 100 kg/cm2 Medium risk (2) Rock strength within 100 – 250 kg/cm2 Rock strength Low risk (1) Rock strength above 250 kg/cm2 High risk (3) Ill geological condition results in high disaster risk Medium risk (2) Ordinary geological condition results in low disaster risk Geological condition Low risk (1) Good geological condition High risk (3) Slope above 30% Medium risk (2) Slope within 5% - 30% Environmental geology Slope Low risk (1) Slope below 5% High risk (3) Medium risk (2) Landslide potential Low risk (1) According to the database of Central Geological Survey, Taiwan High risk (3) Medium risk (2) Debris flow potential Low risk (1) According to the database of Soil and Water Conservation Bureau, Taiwan High risk (3) Flooding depth above 2 m Medium risk (2) Flooding depth within 0.5 m - 2 m Natural disaster Flood potential Low risk (1) Flooding depth below 0.5 m High risk (3) Vegetation cover below 50% Medium risk (2) Vegetation cover within 50% - 80% Vegetation cover Low risk (1) Vegetation cover above 80% High risk (3) Human development above 60% Medium risk (2) Human development within 40% - 60% Human development Low risk (1) Human development below 40% High risk (3) Non-forest or agricultural area above 70% Medium risk (2) Non-forest or agricultural area within 30% - 70% Land use Land use Low risk (1) Non-forest or agricultural area below 30% Copyright © 2012 SciRes. JGIS  S.-H. PENG ET AL. Copyright © 2012 SciRes. JGIS 408 flow potential risk intensities were defined by CGS and SWCB, as to abide by the definitions of this research. The flooding areas were also utilized when the accumu- lated rainfall achieving 600 mm, announced by Water Resources Agency, Taiwan for data analyses, in which the flooding depth was applied to analyses in Table 10. This study utilized the results of national land survey by National Land Surveying and Mapping Center, Tai- wan in 2007 for analyzing the criteria of the Land use. Based on the types of land use to determine the relevant indices, the area corresponding to the items in the 40m grid was calculated. According to the percentage of the grid in the total area, three levels were divided for risk evaluation. Vegetation cover score, Human development score, and Land use score were obtained by analyzing the ratio of Vegetation cover area, Human development area, and Non-forest or agricultural areas in the 40 m grids, respectively, shown as in Table 10. Figure 1. Topography of the studied area. 3.3. Outcomes of Map Overlaying Analyses in GIS Having Changhua City as the studied area, the north end of Baguashan is located on the south, Wu River is next to the east and the north, the west and the north areas are plain terrain, and the elevation is within 0 m - 231.5 m (see Figure 1). In the first step, consider the Environmental geology criteria. The result of Active faults score in the studied area covered Changhua fault through the plain in the west, was shown as Figure 2. As Rock strength score, Rock strength in the studied area was less than 100 kg/cm2 that it was regarded as High risk area (Figure 3). Geological condition score in the studied area was con- sidered ill Geological condition and it was regarded as the high disaster risk area, in Figure 4. The last score, Slope score, based on 5 m × 5 m digital elevation model (DEM) to precede slope analyses, Figure 5, the average slope was 11.53%, and most areas appeared 5%. Figure 2. Active fault distribution in the studied area. The second step for Natural disaster criteria, there was no debris flow potential stream in the studied area, so the Debris flow potential risk was not considered. The land- slide potential area in Figure 4 represented the score value 3 and the non-landslide area 1 for calculations. In Flood potential consideration, the flooding areas when the accumulated rainfall being 600 mm, announced by Water Resources Agency in Taiwan, were utilized for data analyses. The flooding depth was the analysis crite- ria, shown in Figure 6. In the third step, Land use criteria, based on the results of the national land survey from Na- tional Land Surveying and Mapping Center, Taiwan in 2007, Figure 7, the risk level (Figures 8-10) according to Figure 7 and Table 10 for Land use was evaluated. Figure 3. Rock strength distribution in the studied area. 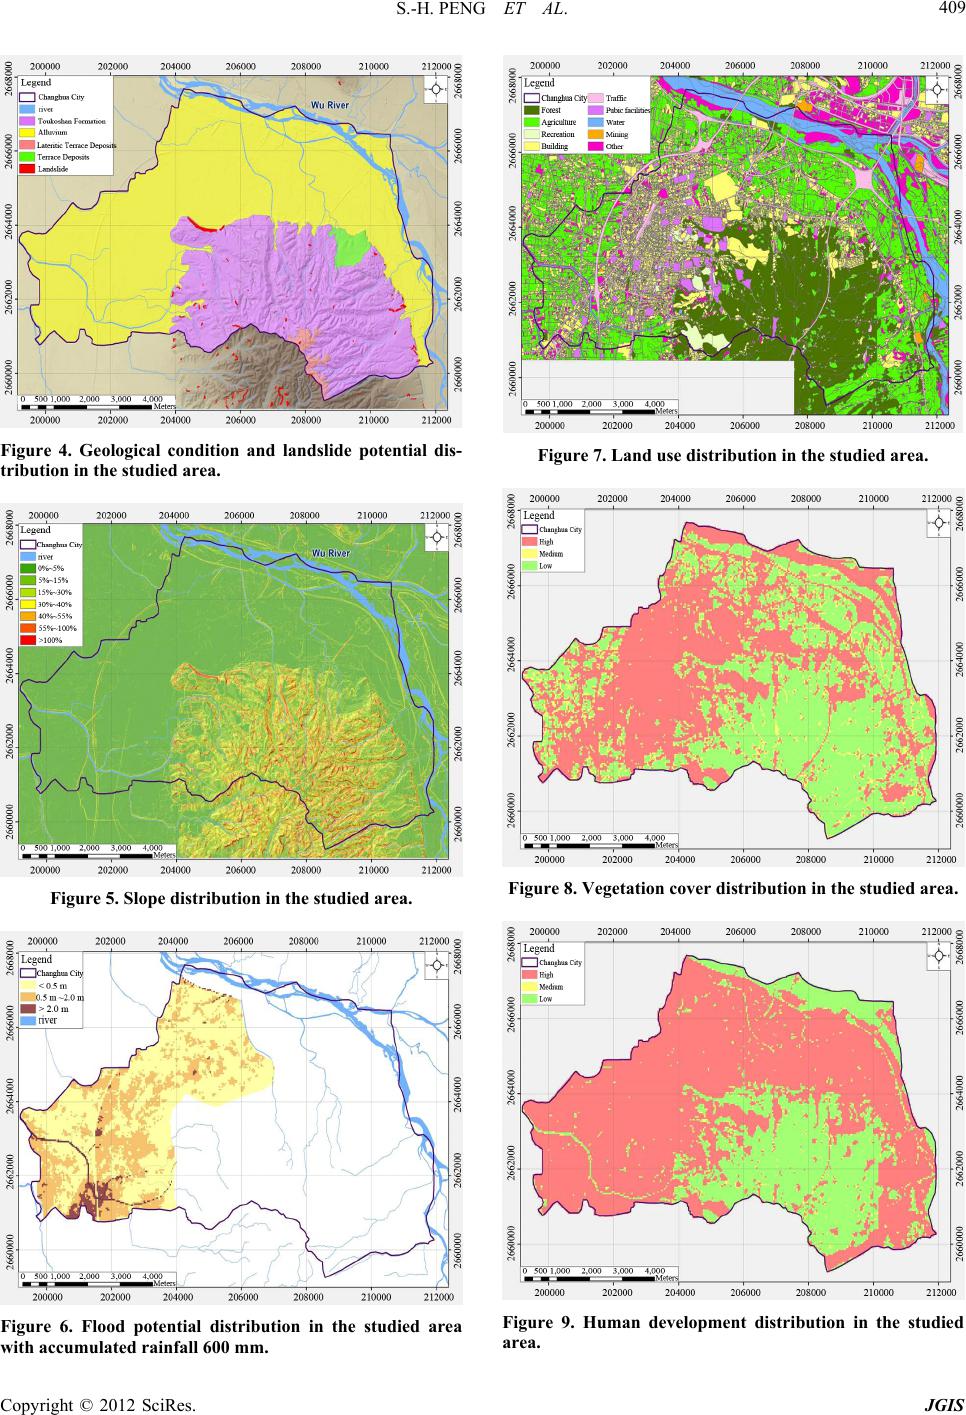 S.-H. PENG ET AL. 409 Figure 4. Geological condition and landslide potential dis- tribution in the studied area. Figure 5. Slope distribution in the studied area. Figure 6. Flood potential distribution in the studied area with accumulated rainfall 600 mm. Figure 7. Land use distribution in the studie d ar e a . Figure 8. Vegetation cover distribution in the studied area. Figure 9. Human development distribution in the studied area. Copyright © 2012 SciRes. JGIS 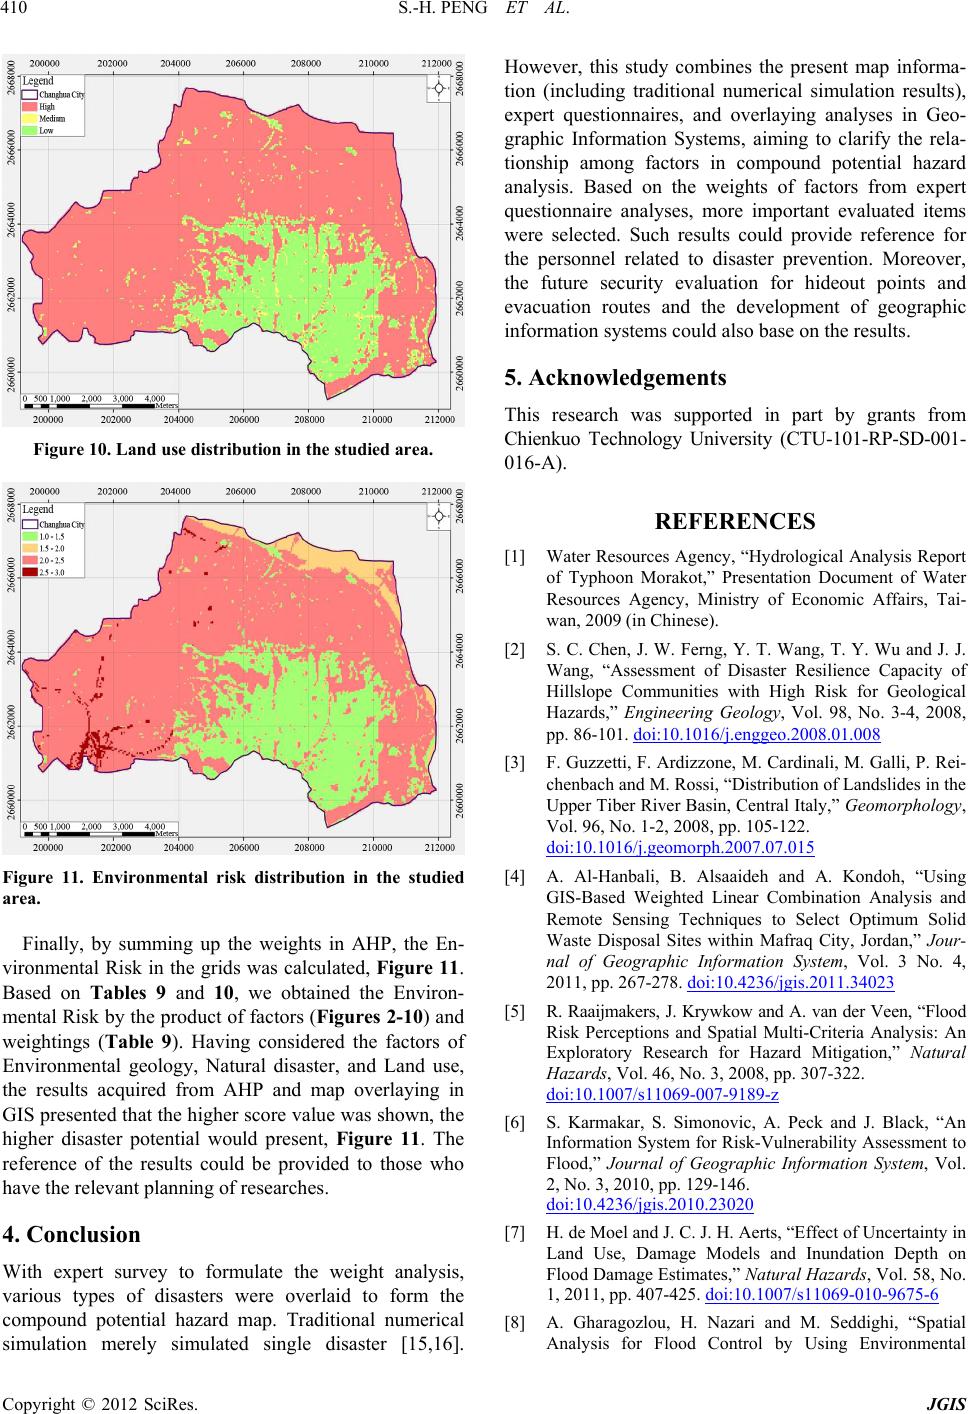 S.-H. PENG ET AL. 410 Figure 10. Land use distribution in the studied are a . Figure 11. Environmental risk distribution in the studied area. Finally, by summing up the weights in AHP, the En- vironmental Risk in the grids was calculated, Figure 11. Based on Tables 9 and 10, we obtained the Environ- mental Risk by the product of factors (Figures 2-10) and weightings (Table 9). Having considered the factors of Environmental geology, Natural disaster, and Land use, the results acquired from AHP and map overlaying in GIS presented that the higher score value was shown, the higher disaster potential would present, Figure 11. The reference of the results could be provided to those who have the relevant planning of researches. 4. Conclusion With expert survey to formulate the weight analysis, various types of disasters were overlaid to form the compound potential hazard map. Traditional numerical simulation merely simulated single disaster [15,16]. However, this study combines the present map informa- tion (including traditional numerical simulation results), expert questionnaires, and overlaying analyses in Geo- graphic Information Systems, aiming to clarify the rela- tionship among factors in compound potential hazard analysis. Based on the weights of factors from expert questionnaire analyses, more important evaluated items were selected. Such results could provide reference for the personnel related to disaster prevention. Moreover, the future security evaluation for hideout points and evacuation routes and the development of geographic information systems could also base on the results. 5. Acknowledgements This research was supported in part by grants from Chienkuo Technology University (CTU-101-RP-SD-001- 016-A). REFERENCES [1] Water Resources Agency, “Hydrological Analysis Report of Typhoon Morakot,” Presentation Document of Water Resources Agency, Ministry of Economic Affairs, Tai- wan, 2009 (in Chinese). [2] S. C. Chen, J. W. Ferng, Y. T. Wang, T. Y. Wu and J. J. Wang, “Assessment of Disaster Resilience Capacity of Hillslope Communities with High Risk for Geological Hazards,” Engineering Geology, Vol. 98, No. 3-4, 2008, pp. 86-101. doi:10.1016/j.enggeo.2008.01.008 [3] F. Guzzetti, F. Ardizzone, M. Cardinali, M. Galli, P. Rei- chenbach and M. Rossi, “Distribution of Landslides in the Upper Tiber River Basin, Central Italy,” Geomorphology, Vol. 96, No. 1-2, 2008, pp. 105-122. doi:10.1016/j.geomorph.2007.07.015 [4] A. Al-Hanbali, B. Alsaaideh and A. Kondoh, “Using GIS-Based Weighted Linear Combination Analysis and Remote Sensing Techniques to Select Optimum Solid Waste Disposal Sites within Mafraq City, Jordan,” Jour- nal of Geographic Information System, Vol. 3 No. 4, 2011, pp. 267-278. doi:10.4236/jgis.2011.34023 [5] R. Raaijmakers, J. Krywkow and A. van der Veen, “Flood Risk Perceptions and Spatial Multi-Criteria Analysis: An Exploratory Research for Hazard Mitigation,” Natural Hazards, Vol. 46, No. 3, 2008, pp. 307-322. doi:10.1007/s11069-007-9189-z [6] S. Karmakar, S. Simonovic, A. Peck and J. Black, “An Information System for Risk-Vulnerability Assessment to Flood,” Journal of Geographic Information System, Vol. 2, No. 3, 2010, pp. 129-146. doi:10.4236/jgis.2010.23020 [7] H. de Moel and J. C. J. H. Aerts, “Effect of Uncertainty in Land Use, Damage Models and Inundation Depth on Flood Damage Estimates,” Natural Hazards, Vol. 58, No. 1, 2011, pp. 407-425. doi:10.1007/s11069-010-9675-6 [8] A. Gharagozlou, H. Nazari and M. Seddighi, “Spatial Analysis for Flood Control by Using Environmental Copyright © 2012 SciRes. JGIS 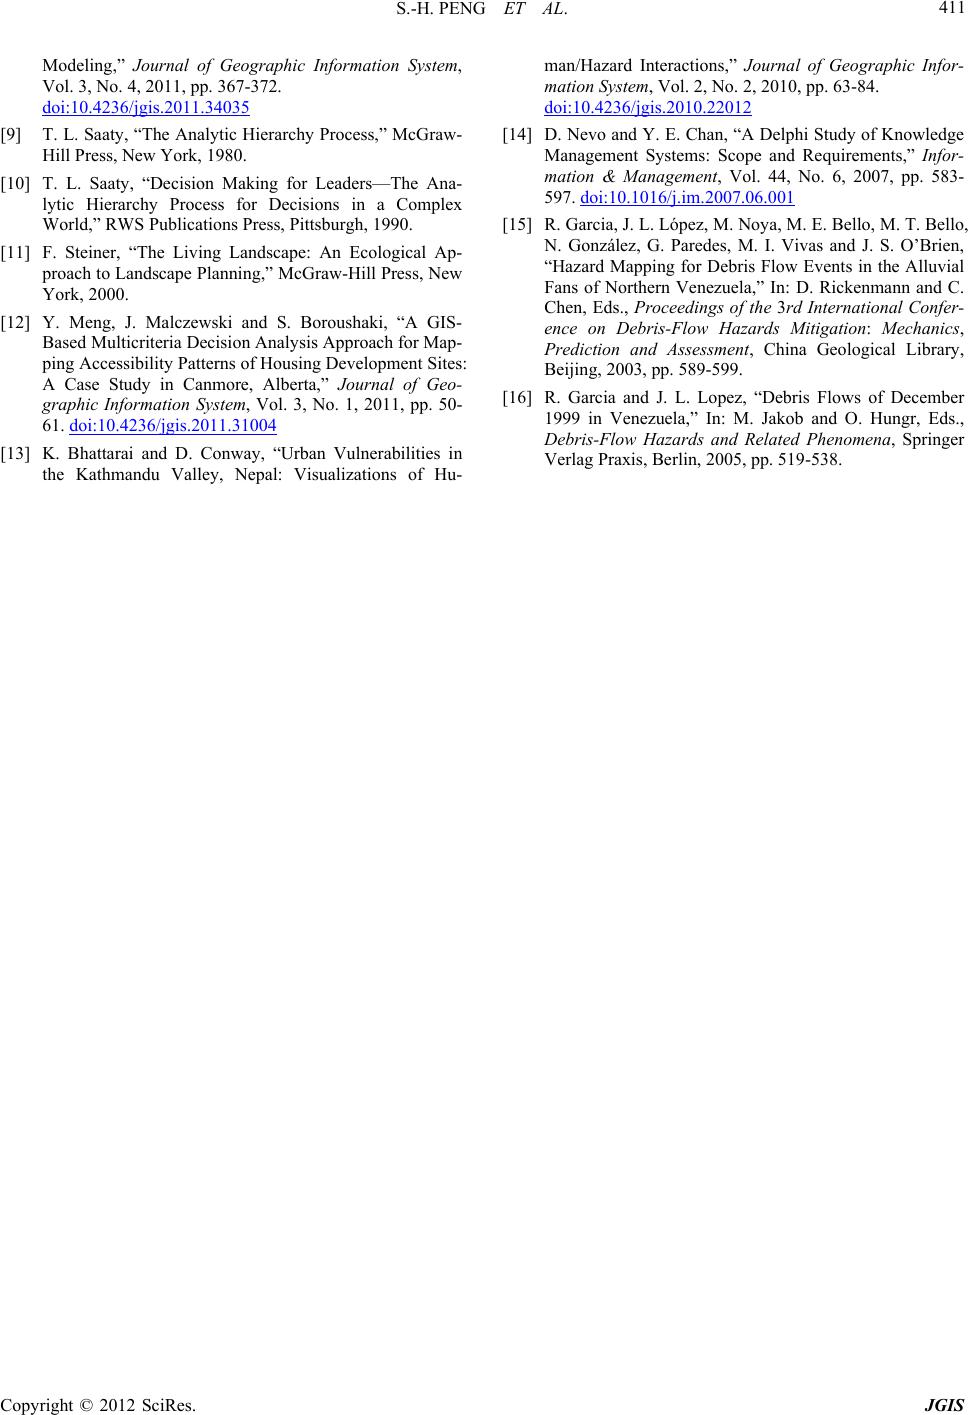 S.-H. PENG ET AL. Copyright © 2012 SciRes. JGIS 411 Modeling,” Journal of Geographic Information System, Vol. 3, No. 4, 2011, pp. 367-372. doi:10.4236/jgis.2011.34035 [9] T. L. Saaty, “The Analytic Hierarchy Process,” McGraw- Hill Press, New York, 1980. [10] T. L. Saaty, “Decision Making for Leaders—The Ana- lytic Hierarchy Process for Decisions in a Complex World,” RWS Publications Press, Pittsburgh, 1990. [11] F. Steiner, “The Living Landscape: An Ecological Ap- proach to Landscape Planning,” McGraw-Hill Press, New York, 2000. [12] Y. Meng, J. Malczewski and S. Boroushaki, “A GIS- Based Multicriteria Decision Analysis Approach for Map- ping Accessibility Patterns of Housing Development Sites: A Case Study in Canmore, Alberta,” Journal of Geo- graphic Information System, Vol. 3, No. 1, 2011, pp. 50- 61. doi:10.4236/jgis.2011.31004 [13] K. Bhattarai and D. Conway, “Urban Vulnerabilities in the Kathmandu Valley, Nepal: Visualizations of Hu- man/Hazard Interactions,” Journal of Geographic Infor- mation System, Vol. 2, No. 2, 2010, pp. 63-84. doi:10.4236/jgis.2010.22012 [14] D. Nevo and Y. E. Chan, “A Delphi Study of Knowledge Management Systems: Scope and Requirements,” Infor- mation & Management, Vol. 44, No. 6, 2007, pp. 583- 597. doi:10.1016/j.im.2007.06.001 [15] R. Garcia, J. L. López, M. Noya, M. E. Bello, M. T. Bello, N. González, G. Paredes, M. I. Vivas and J. S. O’Brien, “Hazard Mapping for Debris Flow Events in the Alluvial Fans of Northern Venezuela,” In: D. Rickenmann and C. Chen, Eds., Proceedings of the 3rd International Confer- ence on Debris-Flow Hazards Mitigation: Mechanics, Prediction and Assessment, China Geological Library, Beijing, 2003, pp. 589-599. [16] R. Garcia and J. L. Lopez, “Debris Flows of December 1999 in Venezuela,” In: M. Jakob and O. Hungr, Eds., Debris-Flow Hazards and Related Phenomena, Springer Verlag Praxis, Berlin, 2005, pp. 519-538.
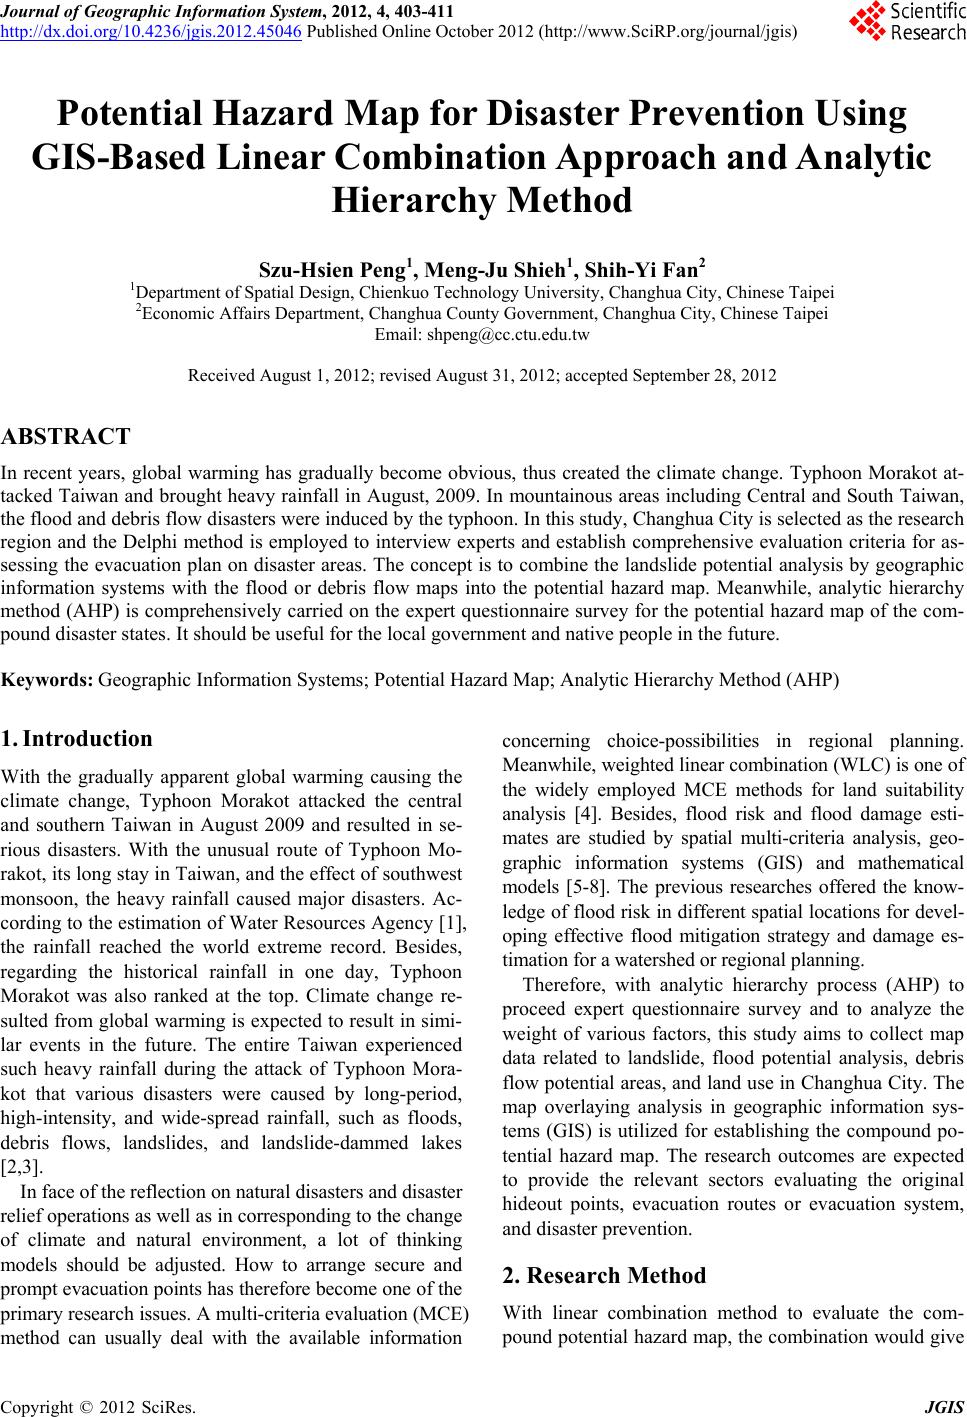
|