Paper Menu >>
Journal Menu >>
 Energy and Power En gi neering, 2010, 2, 161-170 doi:10.4236/epe.2010.23024 Published Online August 2010 (http://www.SciRP.org/journal/epe) Copyright © 2010 SciRes. EPE Constraints Based Decision Support for Site-Specific Preliminary Design of Wind Turbines Abdelaziz A rbaoui1, Mohamed Asbik2 1M2I - ENSAM Meknès Ismaïlia, Meknès, Maroc 2Laboratoire de Physique des Matériaux et Modélisation des Systèmes, Un ité associée au CNRST-URAC, Faculté des Sciences, Zitoune, Meknès, Maroc E-mail: {abdelaziz_ arbaoui, asbik _ m}@yahoo.fr Received April 7, 2010; revised May 21, 2010; accepted July 1, 2010 Abstract This study presents a decision-support tool for preliminary design of a horizontal wind turbine system. The function of this tool is to assist the various actors in making decisions about choices inherent to their activi- ties in the field of wind energy. Wind turbine cost and site characteristics are taken into account in the used models which are mainly based on the engineering knowledge. The present tool uses a constraint-modelling technique in combination with a CSP solver (numerical CSPs which are based on an arithmetic interval). In this way, it generates solutions and automatically performs the concept selection and costing of a given wind turbine. The data generated by the tool and required for decision making are: the quality index of solution (wind turbine), the amount of energy produced, the total cost of the wind turbine and the design variables which define the architecture of the wind turbine system. When applied to redesign a standard wind turbine in adequacy with a given site, the present tool proved both its ability to implement constraint modelling and its usefulness in conducting an appraisal. Keywords: Wind Turbine, Decision Support, Preliminary Design, Cost Modelling, Constraint Satisfaction Problem (CSP), Digital CSP Solver 1. Introduction For the past fifteen years, horizontal axis wind turbine systems (HAWT) have developed at a fast pace. Because of the renewability and cleanliness of the energy pro- duced, incorporating such systems has become a key element in the new energy policies of many countries. Governments and non-trading companies show an im- portant interest in sustainable development through the extensive incorporation of wind energy into electricity generation systems. Distributors are interested in the viability and in the cost as well as the quality of the en- ergy produced. Aims of investors have been focalized on potential profits whereas designers, manufacturers and project managers define the architecture of the system and its fitness to the site. Like all projects, a wind energy one is punctuated by successive phases with well-defined goals. In each phase, operations have to be performed and decisions have to be made by the various actors. Technical, economical, en- vironmental and political issues lead the actors to justify their decision approach and search for decision-support means and tools. The main actors involved in the deci- sion making process in the preliminary design phase are investors and distributors. To make a decision, these ac- tors require external knowledge to their organisations. These are mainly within the competence of the project manager, manufacturer and scientist, and are needed to be translated into trends or estimation s to be usable in th e preliminary decision process. In addition, the character- istics of required data and models depend on the decision environment and inexpressible needs [1]. Various tools and software has been developed for wind energy systems. The objective of such tools is to maximise the performance and/or decrease the produced energy cost. Frequently, the strength properties and stresses of structures are all taken into account, with a finite-element and/or modal-analysis approach. Some tools use digital simulations to reproduce the aerody- namic characteristics of wind at the site. These ones fo- cus on designing and defining details of wind energy systems, and they are not designed to provide decision support during the preliminary design phase [2]. 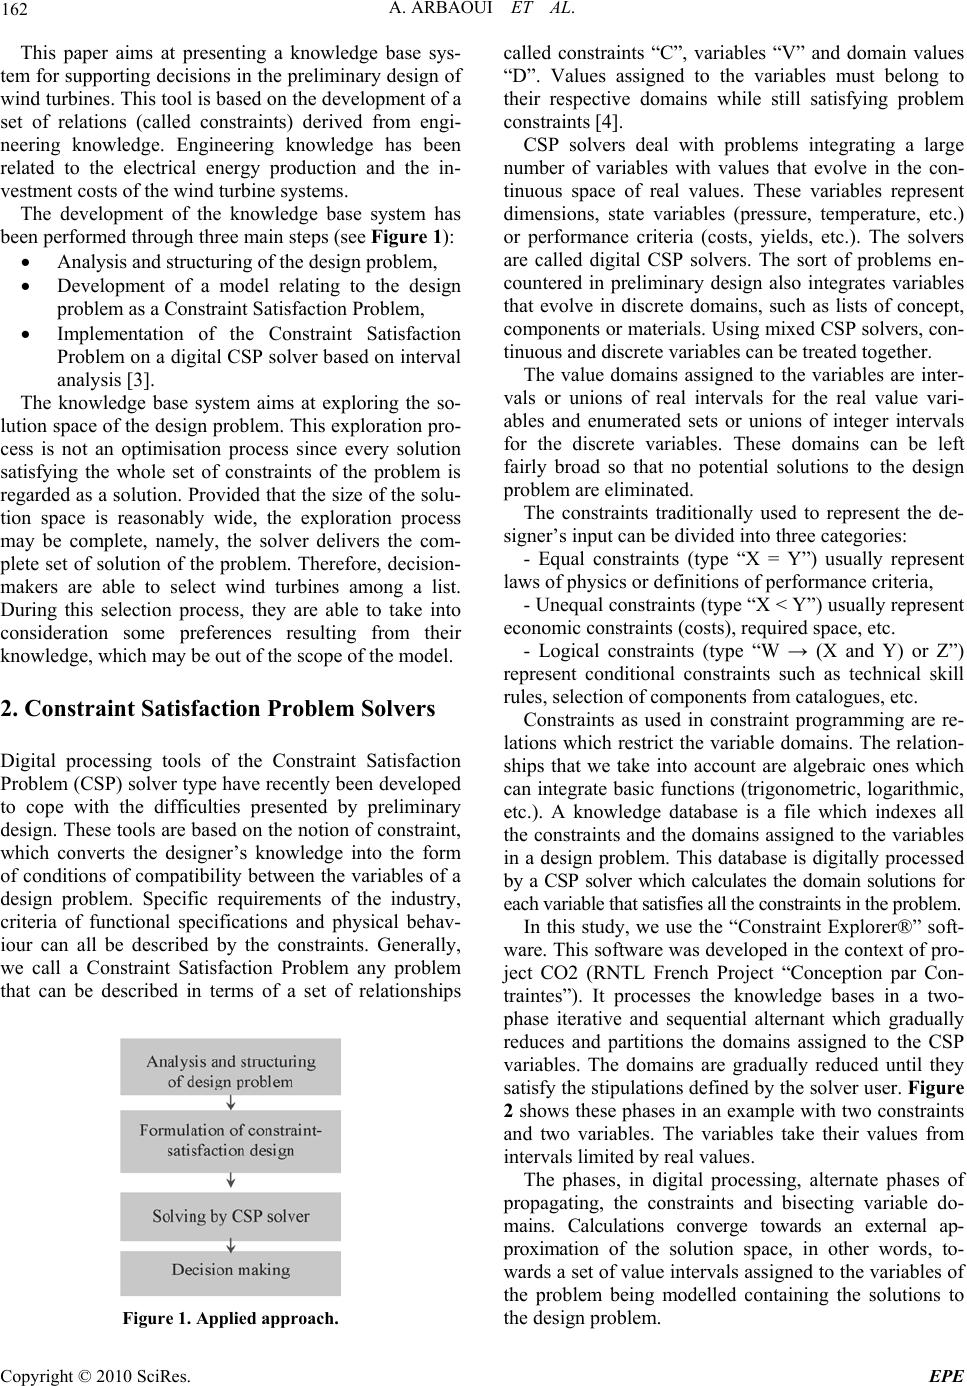 A. ARBAOUI ET AL. Copyright © 2010 SciRes. EPE 162 This paper aims at presenting a knowledge base sys- tem for supporting decision s in the preliminary design of wind turbines. This tool is based on the development of a set of relations (called constraints) derived from engi- neering knowledge. Engineering knowledge has been related to the electrical energy production and the in- vestment costs of the wind turbine systems. The development of the knowledge base system has been performed through three main steps (see Figure 1): Analysis and structuring of the d e sign problem, Development of a model relating to the design problem as a Constraint Satisfaction Problem, Implementation of the Constraint Satisfaction Problem on a digital CSP solver based on interval analysis [3]. The knowledge base system aims at exploring the so- lution space of the design problem. This explo ration pro- cess is not an optimisation process since every solution satisfying the whole set of constraints of the problem is regarded as a solution. Provided that the size of the solu- tion space is reasonably wide, the exploration process may be complete, namely, the solver delivers the com- plete set of solution of the problem. Therefore, decision- makers are able to select wind turbines among a list. During this selection process, they are able to take into consideration some preferences resulting from their knowledge, which may be out of the scope of the model. 2. Constraint Satisfaction Problem Solvers Digital processing tools of the Constraint Satisfaction Problem (CSP) solver type have recently been developed to cope with the difficulties presented by preliminary design. These tools are based on the notion of constraint, which converts the designer’s knowledge into the form of conditions of compatibility between the variables of a design problem. Specific requirements of the industry, criteria of functional specifications and physical behav- iour can all be described by the constraints. Generally, we call a Constraint Satisfaction Problem any problem that can be described in terms of a set of relationships Figure 1. Applied approach. called constraints “C”, variables “V” and domain values “D”. Values assigned to the variables must belong to their respective domains while still satisfying problem constraints [4]. CSP solvers deal with problems integrating a large number of variables with values that evolve in the con- tinuous space of real values. These variables represent dimensions, state variables (pressure, temperature, etc.) or performance criteria (costs, yields, etc.). The solvers are called digital CSP solvers. The sort of problems en- countered in preliminary design also integrates variables that evolve in discrete domains, such as lists of concept, components or materials. Using mixed CSP solvers, con- tinuous and discrete variables can be treated together. The value domains assigned to the variables are inter- vals or unions of real intervals for the real value vari- ables and enumerated sets or unions of integer intervals for the discrete variables. These domains can be left fairly broad so that no potential solutions to the design problem are eliminated. The constraints traditionally used to represent the de- signer’s input can be divi d e d int o three cate go rie s: - Equal constraints (type “X = Y”) usually represent laws of physics or defi ni t ions of performance criteri a, - Unequal constraints (type “X < Y”) usually represent economic constraints (costs), required space, etc. - Logical constraints (type “W → (X and Y) or Z”) represent conditional constraints such as technical skill rules, selection of components from catalogues, etc. Constraints as used in constraint programming are re- lations which restrict th e variable domains. The relation- ships that we take into account are algebraic ones which can integrate basic functions (trigonometric, logarithmic, etc.). A knowledge database is a file which indexes all the constraints and the domains assigned to the variables in a design problem. This database is digitally processed by a CSP solver which calculates the domain solutions for each variabl e that satisfies all t he const raints i n the problem . In this study, we use the “Constraint Explorer®” soft- ware. This software was developed in the context of pro- ject CO2 (RNTL French Project “Conception par Con- traintes”). It processes the knowledge bases in a two- phase iterative and sequential alternant which gradually reduces and partitions the domains assigned to the CSP variables. The domains are gradually reduced until they satisfy the stipulations defined by the solver user. Figure 2 shows these phases in an example with two constraints and two variables. The variables take their values from intervals limited by real values. The phases, in digital processing, alternate phases of propagating, the constraints and bisecting variable do- mains. Calculations converge towards an external ap- proximation of the solution space, in other words, to- wards a set of value intervals assigned to the variables of the problem being modelled containing the solutions to the design problem. 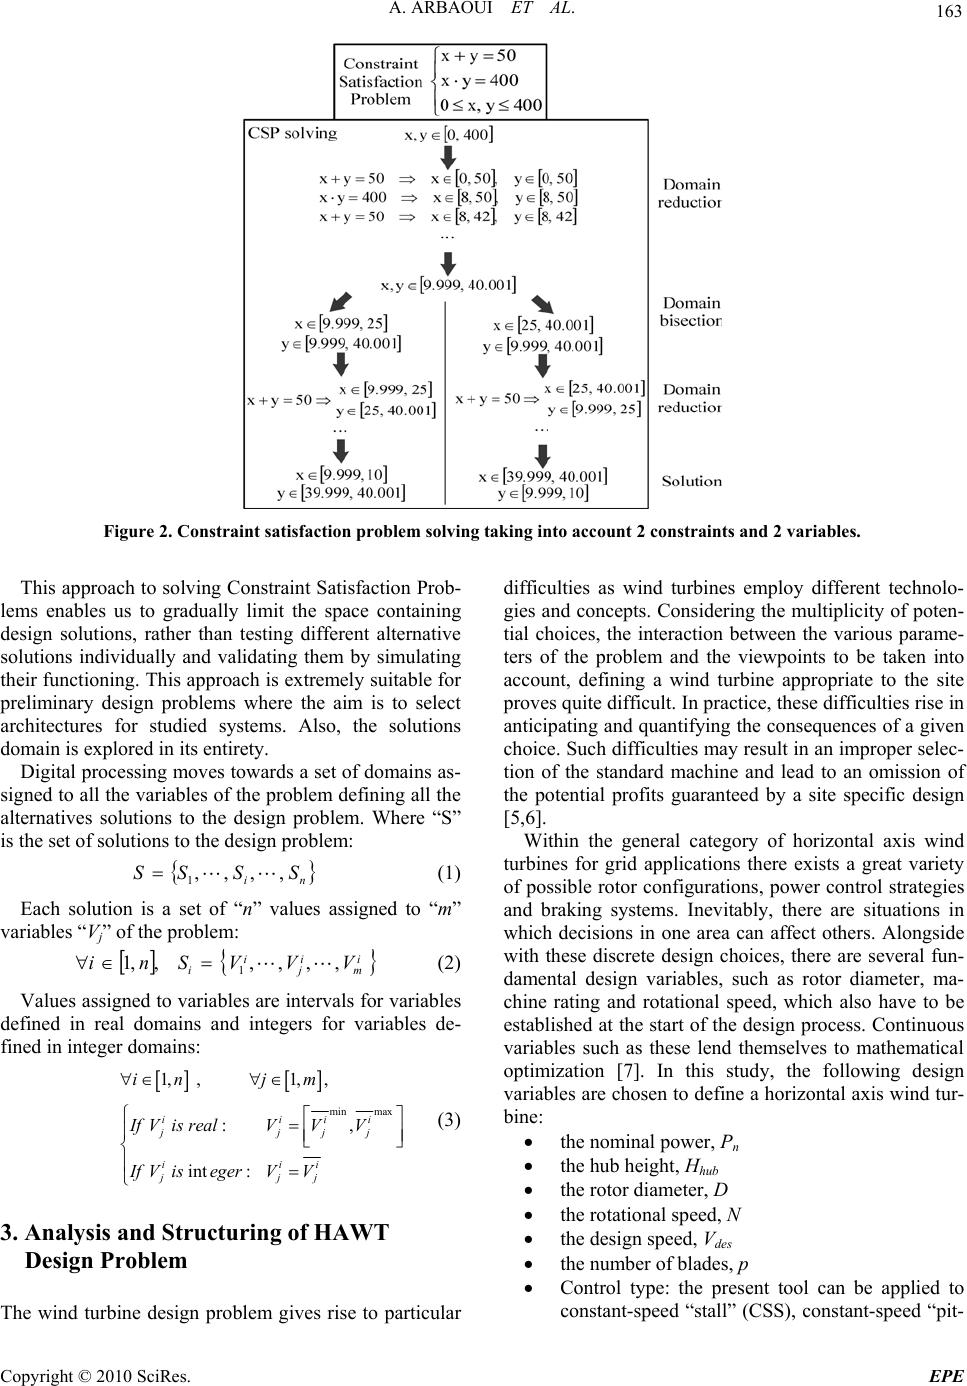 A. ARBAOUI ET AL. Copyright © 2010 SciRes. EPE 163 Figure 2. Constraint satisfaction problem solving taking into account 2 constraints and 2 variables. This approach to so lving Constraint Satisfaction Prob- lems enables us to gradually limit the space containing design solutions, rather than testing different alternative solutions individually and validating them by simulating their functioning. Th is approach is extremely suitable for preliminary design problems where the aim is to select architectures for studied systems. Also, the solutions domain is explored in its entirety. Digital processing moves towards a set of domains as- signed to all the variables of the problem defining all the alternatives solutions to the design problem. Where “S” is the set of solutions to the design problem: ni SSSS ,,,, 1 (1) Each solution is a set of “n” values assigned to “m” variables “Vj” of the problem: VVV S nii m i j i i,,,,,,1 1 (2) Values assigned to variables are intervals for variables defined in real domains and integers for variables de- fined in integer domains: min max 1, , 1,, :, int : iiii jjjj iii jjj in jm IfVis realVVV If VisegerVV (3) 3. Analysis and Structuring of HAWT Design Problem The wind turbine design problem gives rise to particular difficulties as wind turbines employ different technolo- gies and concep ts. Considering the multiplicity of po ten- tial choices, the interaction between the various parame- ters of the problem and the viewpoints to be taken into account, defining a wind turbine appropriate to the site proves quite difficult. In practice, these difficulties rise in anticipating and quantifying the consequences of a given choice. Such difficulties may result in an improper selec- tion of the standard machine and lead to an omission of the potential profits guaranteed by a site specific design [5,6]. Within the general category of horizontal axis wind turbines for grid applications there exists a great variety of possible rotor configurations, power control strategies and braking systems. Inevitably, there are situations in which decisions in one area can affect others. Alongside with these discrete design choices, there are several fun- damental design variables, such as rotor diameter, ma- chine rating and rotational speed, which also have to be established at the start of the design process. Continuous variables such as these lend themselves to mathematical optimization [7]. In this study, the following design variables are chosen to define a horizontal axis wind tur- bine: the nominal power, Pn the hub height, Hhub the rotor diameter, D the rotational speed, N the design speed, Vdes the number of blades, p Control type: the present tool can be applied to constant-speed “stall” (CSS), constant-speed “pit-  A. ARBAOUI ET AL. Copyright © 2010 SciRes. EPE 164 ch” (CSP), and variable-speed “pitch” (VSP) sys- tems. All of these design variables are often given in manu- facturers catalogues. The need related to the preliminary design of HAWT, consists in being able to characterize these configur ations of design the ones compared to the others. We use the quality index, which is the ratio of the electricity pro- duced on the total cost of th e wind turbine, to choose the best solution s. WT C E QI (4) To take safety problems into account, the distance between the tip of the blade and the ground should be equal to or more than 15 m: hub H D 15 2 (5) To limit aerodynamic noise from the rotor, blade tip linear speed cannot exceed 80 m/sec: 80 120 2 ND Vtip (6) At this stage of problem definition, generating the constraints related to the cost of wind turbine and those related to the amount of energy produced is sufficient to start the solving phase. 4. HAWT Cost Model The cost model of wind turbine encompasses the aspects related to the design and manufacture of such systems. It is the sum of cost models of the components of the wind turbine. A calibration factor FWT allows using real wind turbine costs [6]. 1.1, _ WT iicomponentWTWT F CFC (7) Flow char ts w ere us ed to id entify the models cost of all components, Figure 3 for example, shows the flowchart used for the rotor. The choice of level 2 in the flowchart of the rotor is justified to distinguish, firstly, the “pitch” and “stall” concept. In fact, the later encloses in his blade the tip braking mechanism, whereas the first contains the pitch mechanism in his hub. On the other hand, a two-blade rotor must contain the teeter mechanism to compensate his dynamic behavi or. The cost of some components is calculated from weight models developed using engineering estimation rules. These have been applied to the rotor, the transmis- sion system, the nacelle, and the tower. As for the cost of the generator and associated electrical equipment, it is correlated with power rating. All models are calibrated (specific costs) to match the costs market of the compo- nents [8,9]. 5. Annual Electricity Produced Model The amount of calculated electricity depends on the en- ergy available on the site, at the level of the tower, the speed and geometric characteristics of the rotor, the out- put of the power unit, and the start/stop wind speeds of the wind turbine. The wind in the site is defined as the following Wei- bull distribution: k c V k e c V V k Vf )( (8) Scale parameter c characterises wind average speed, whereas shape parameter k characterises wind distribu- tion which varies with height [10] : 02.003.0)( 0 ZkZk (9) where k0 is the shape parameter at wind-measurement height Z0. The vertical gradient of wind speed is considered by introducing the following power law: “Stall”“pi tch” “2 blade” Figure 3. Flowchart of the rotor.  A. ARBAOUI ET AL. Copyright © 2010 SciRes. EPE 165 00 Z Z c c (10) c and c0 are the scale parameters at heights Z and Z0 and is considered constant. The power recove re d by a wind turbi ne is: 3 2 1VACP e (11) The efficiency factor depends on both wind speed and system architecture [2]: 2 2 ln2 lnln exp)( s VV CVC des eme (12) In this expression, the system is characterised by its maximum efficiency Cem, its optimum operating speed Vdes (design speed), and its operating range s. The nomi- nal power of the wind turbine is given by: 2 19 exp ln 22 nemdes PCAV s (13) Cem is calculated from the performance of the power conversion unit: gmpem CC max (14) The maximum value of Cp is calculated using an ana- lytical relationship [11]: z x P C C p p p p C max 2 max 2 maxmax 67.0 67.0 max max 21 92.1 0025.004.048.1 593.0 (15) where des V ND 60 max (16) The efficiency of the gearbox is given by [9]: 4/311 P P n mm (17) with 012.0 89.0 nm P (19) The efficiency of the generato r is given by [9] : P 6 P P P m ng ng m gg 1511 2 (20) with 014.0 87.0 ng P , (21) and sgmnng FPP (22) In this last expression, Fs represents the service factor of the gearbox, which is defined by the following logical constraint: 25,1. 75,1. 2. s s s FVSPtypeControl FCSPtypeControl FCSStypeControl (23) Therefore, the annual electricity output in kWh/year of the wind turbine having a rotor with a surface area A, and the start/stop wind speeds (Vi and Vf), is the sum of the energies produced in one year (8,760 hours) which is reduced by the efficiency factor of the system )(VCe: VVVCVfAE f i V Veap 3 )()( 2 760.8 (24) 6. Preliminary Design of a Horizontal Wind Turbine The decision-making actors need the following data: The Criteria (Cr) are the total cost of the wind system and the quantity of annual electricity pro- duced. These two criteria allow the calculation of the quality index for a given configuration of wind turbine system. The design variables represent the parameters serving to define the architecture of the wind sys- tem (Pn, Hhub, D, N, Vdes, Control type and p). To define the relevance indicators of the solutions, the standard system VESTAS V39-500 is used. It corre- sponds to the ratio of the criteria values obtained by the total model on the values of criteria of the standard sys- tem. dards i iCr Cr RI tan (25) The principle objective of the decision makers is to control the influence of design variables on the criteria. They often seek a machine which has a largest quality index but also which maximizes the annual produced electricity. Furthermore, the search for solutions (satis- faction of all the constraints) is carried out by using the “Constraint Explorer®” solver. According to the need, this tool can modify the fields of the design variables values and the variables which characterize the site. In this study, a site whose characteristics are given in Table 1 has been chosen. To obtain a good judgement of total field of the solutions, we introduced the variation domain of the design variables gathered in Table 2.  A. ARBAOUI ET AL. Copyright © 2010 SciRes. EPE 166 Table 1. Characteristics of the investigated site. Table 2. Design variables and their domain of variation. Design variable Domain of variation D (m) [20,80] with a step of 10 m Pn (kW) [400,2000] with a step of 100 kW Vdes (m/s) [6,12] with a step of 2 m/s Hhub(m) [35,70] with a step of 10 m N (tr/mn) [15,50] with a step of 5 tr/mn Control type “PVC” or “SVC” or “PVV” P 2 or 3 Figure 4 shows the Pareto space of solutions obtained. It also shows some of the best solutions that we have chosen, in addition to standard system which appears as a solution of the problem, too. The best solutions chosen in Pareto front compared with the standard system are exhibited in Table 3. These results reveal that an increase of the rotor di- ameter causes a diminution of the quality index. Fur- thermore, the increase of this geometrical parameter is associated with an important nominal power output, a weaker rotational speed and a higher tower. These results are in agreement with those of the reference [7]. We notice that all the given solutions in the table 3 are two blades with pitch variable speed control. We will return to justify this predominance in the continuation of this paper. Indeed, every solution of this table has a qual- ity index clearly higher than that of the standard system for the studied site. Then, the relevance indicators asso- ciated with the four solutions are respectively: 142.8%, 133.2%, 131.6%, and 118%. This means that the stan- dard system is not adapted to the studied site and hence a redesign in adequacy with the site is necessary. To improve the performances of the standard machine, we propose to deal with 6 possible redesign scenarios with which we highlighted the influence of the design variables on the performances of the wind system: Scenario 1 (Modification of the rotor): The design variables concerned with this scenario are the ro- tor diameter D and the design speed Vdes. Scenario 2 (Modification of the gearbox and the generator): This scenario relates to the nominal power out put Pn and the rotational speed N. Scenario 3 (Modification of the number of blade p) Scenario 4 (Modification of control type of the rotor): The objective is to compare a stall system with a pitch system. Scenario 5 (Modification of control type of the generator): The objective is to compare a constant speed system with a variable speed system. Scenario 6 (Modification of the whole wind sys- tem) Figure 4. Field of solutions in the Pareto space. Table 3. Criteria and design variables of standard system and some best solutions in Pareto front. Criteria Design variable Wind Turbines QI E CWT DP n Vdes Hhub N Control type p Standard 3.61 1.37 0.38 39500 8 40.530 CSP 3 Solution 15.24 1.19 0.2330700 1 0 35 46.8VSP 2 Solution 24.89 2.21 0.4540120010 45 33.9VSP 2 Solution 34.83 3.36 0.6950170010 45 24 VSP 2 Solution 44.33 4.59 1.0660200010 55 20.9VSP 2 k0 c0 Z0 1.2 8 0.12 30  A. ARBAOUI ET AL. Copyright © 2010 SciRes. EPE 167 The optimal solutions (with respect to the quality in- dex) obtained for each scenario are given in Table 4. Thus, the optimal solution of the scenario 1 corre- sponds to the redu ction of rotor diameter (18.5 %) and an increase in the design speed which reaches 12.5%. As seen in Figure 5, there are also important opportunities to reduce the total cost of the wind system at the level of the nacelle, the tower and the foundation. These last op- portunities must be seized by the decision-makers to be able to improve the quality index of their machine (to reach 4.12 GWh/MEuro instead of 3.67 GWh/MEuro which is equivalent to an indicator of relevance equal to 112.3%). If we just reduce the rotor diameter the ob- tained quality index undergoes a lower reduction than that of the standard system (99%). The gains which must be carried out at the level of the other components will certainly compensate the shortfall of the produced energy by a smaller rotor (82.5% only). The retained solution of the scenario 2 provokes an increase of 60% in the nominal power and a weak reduc- tion of 1.6% in the rotational speed. Then, the augmenta- tion in the nominal power allows recovering more energy (126%) and renders the wind system more expensive (an increase of 116%). Figure 6 highlights that the rise of the wind system cost is not only due to the raised costs of the gearbox and the generator but also to the inevitable adaptation of the rotor and the nacelle. Indeed, the aug- mentation in the nominal power is accompanied by an increase in the weight supported by the nacelle and the tower and hence their costs. The rise of the hub and the flanges costs renders the rotor more expensive [9]. Table 4. Criteria and design variables of standard and best solutions for each scenario. Criteria Design variable Wind Turbines QI E CWT D Pn Vdes Hhub N Control type p Standard 3.61 1.37 0.3839 5008 40.530 CSP 3 Scenario 14.12 1.13 0.2731.85009 40.530 CSP 3 Scenario 24.02 1.73 0.4339 8008 40.529.5CSP 3 Scenario 33.88 1.36 0.3539 5008 40.530 CSP 2 Scenario 43.7 1.37 0.3739 5008 40.530 CSS 3 Scenario 53.91 1.37 0.3539 5008 40.530 VSP 3 Scenario 65.24 1.19 0.2330 7 0 010 35 46.8VSP 2 Figure 5. Cost reduction in scenario 1. Figure 6. Cost reduction in scenario 2.  A. ARBAOUI ET AL. Copyright © 2010 SciRes. EPE 168 Now, let us comment on scenarios 3, 4 and 5 concern- ing the discrete variables design. In fact, for the scenario 3, a two-blade rotor is less heavy and hence less expen- sive although his blade is broader and thicker and that the teeter mechanism is integrated to his hub. The reduc- tion of rotor weight leads to a weak reduction of the cost of the nacelle. The possibilities of reducing the cost of the two components are illustrated in Figure 7. Accord- ing to the Equation (15), we can see that the power coef- ficient of a two-blade rotor is worse than that of three- blade system. This latter recovers more energy than the first rotor system but its production gain does not com- pensate its higher cost; so the quality index obtained is slightly lower than that of a two-blade system. As for the scenario 4, a stall system seems to be the least expensive. This can be explained by the fact that its tip braking mechanism is less expensive than the pitch mechanism placed in the hub of the pitch system (see Figure 7). The use of a stall control raises the cost of the gearbox and generator. This is essentially due to the gearbox service factor which increases in the case of a stall system. On the other hand, the possible reduction in the rotor cost can not cover the rise in the gearbox and generator costs which gives a slightly higher quality in- dex for stall system [9]. The gearbox and the electric unit play also an impor- tant role in the scenario 5 which relates to the control type of the generator. By using a variable speed control a decrease in the rotor cost becomes realistic, but the greatest part of this reduction is offered by the gearbox. This fact is due once again to the service factor of the gearbox which decreases in the case of variable speed system [9]. The last scenario has been examined as a combination of the prev ious one s. Then the wind system is considered as a two-blade system with a variable speed (scenarios 3 and 5). Its nominal power is higher than that of the stan- dard system (scenario 2) whereas its rotor diameter is smaller (scenario 1). In Figure 8, the cost reduction of this case is exposed. In spite of the considerable increase in the electric unit cost, the possible gains on the level of the other components of the system allow to have a less expensive wind turbine. Furthermore, even if energy produced is reduced because of the reduction of the rotor diameter, the quality index is much improved. Finally, the Table 5 recapitulates the gains in the qual- ity index obtained for all the scenarios. These gains are more important for scenarios 1 and 2 (the design vari- ables concerned are: D, Vdes, Pn and N) with comparison to scenarios 3, 4 and 5 which relate to the discrete design variables (control type and the number of blade). The profit reaches its maximum value for the scenario 6, which represents a combination of the other scenarios. Figure 7. Cost reduction for scenarios 3, 4 and 5. Figure 8. Cost reduction for scenario 6.  A. ARBAOUI ET AL. Copyright © 2010 SciRes. EPE 169 Table 5. Profits in the quality index obtained for all the scenarios. Redesign Scenarios Gains Scenario 1: Modification of the rotor 14% Scenario 2: Modification of the gearbox and the generator 11% Scenario 3: Modification of the number of blade 7.5% Scenario 4: Modification of the control type of the rotor 2.5% Scénario 5: Modification of the control type of the generator 8% Scenario 6: Modification of the whole design variable 45% 7. Conclusions Decision support systems for the preliminary design of horizontal axis wind turbine is developed by taking into account the wind turbine components and site character- istics. The present tool is mainly based on the engineering knowledge and it combines a constraint-modelling tech- nique with a solving method derived from artificial intel- ligence (digital CSPs). In this way, it generates solutions and automatically performs the architecture selection and gives the cost of wind turbine components. The present study highlights the relevance of the site specific design in the decision making process. The im- provements achieved in terms of to the quality index are significant, this criteria is greatly affected by most of the design variables. When applied to redesign of standard wind turbine, our approach proved both its ability to im- plement constraint modelling and its usefulness to the various actors in conducting an appraisal. 8. References [1] J. F. Courtney, “Decision Making and Knowledge Man- agement in Inquiring Organization: Toward a New Deci- sion-Making Paradigm for DSS,” Decision Support Sys- tems, Vol. 31, No. 1, 2001, pp. 17-38. [2] C. T. Kiranoudis, N. G. Voros and Z. B. Maroulis, “Short-Cut Design of Wind Farms,” Energy Policy, Vol. 29, No. 7, 2001, pp. 567-578. [3] D. Scaravetti, J. Pailhès, J.-P. Nadeau and P. Sébastian, “Aided Decision-Making for an Embodiment Design Problem: Advances in Integrated Design and Manufac- turing in Mechanical Engineering,” Springer, Dordrecht, 2005. [4] F. Benhamou and W. Older, “Applying Interval Arithme- tic to Real, Integer and Boolean Constraints,” The Jour- nal of Logic Programming, Vol. 32, No. 1, 1997, pp. 1- 24. [5] P. Fuglsang, C. Bak, J. G. Schepers, T. T. Cockerill, P. Claiden, A. Olesen and R. Van Rossen, “Site-Specific Design Optimization of Wind Turbines,” Wind Energy, Vol. 5, No. 4, 2002, pp. 261-279. [6] T. Diveux, P. Sebastian, D. Bernard, J. R. Puiggali and J. Y. Grandidier, “Horizontal Axis Wind Turbine Systems: Optimization Using Genetic Algorithms,” Wind Energy, Vol. 4, No. 4, 2002, pp. 151-171. [7] T. Burton, D. Sharpe, N. Jenkins and E. Bossanyi, “Wind Energy Handbook,” John Wiley & Sons Ltd., London, 2001. [8] A. Arbaoui, “Aide à La décision pour la définition d’un système éolien, Adéquation au site et à un réseau faible,” PhD Thesis of the Ecole Nationale Supérieure d’Arts et Métiers de Bordeaux, 2006. [9] R. Harrison and G. Jenkins, “Cost Modelling of Horizon- tal Axis Wind Turbines (Phase 2),” ETSU W/34/00170/ REP, University of Sunderland, 1994. [10] I. Troen and E. L. Petersen, “European Wind Atlas,” RISO, Commission of the European Communities, Risø National Laboratory, Roskilde, 1989. [11] A. Spera, “Wind Turbine Technology,” The American Society of Mechanical E ng ineering, New York, 1998.  A. ARBAOUI ET AL. Copyright © 2010 SciRes. EPE 170 Notations A : rotor swept area (m2) c : Weibull distribution scale parameter (m/s) Ccomponent : cost of component Ce : system efficiency factor Cem : maximum system efficiency factor CP : rotor power coefficient Cpmax : max imu m pow e r c oef ficien t CX : blade profile drag coefficient CZ : blade profile lift coefficient CWT : total cost of wind turbine (MEuros) D : rotor diameter (m) E : annual electricity produced (GWh/year) Fs : service factor of gearbox FWT : cost calibration factor f : Weibull distribution probability density Hhub : hub height (m) k : Weibull distribution shape parameter N : rotor rotation speed (rev/min) p : blade number Pn : nominal power (kW) Png : generator power rating(kW) QI : quality index RI : indicator of relevance s : operating range V : wind speed (m/s) Vdes : design wind speed (m/s) Vf : network-disconnection speed (m/s) Vi : network-connection speed (m/s) Vtip : blade tip speed (m/s) Greek symbols : wind shear factor λmax : maximum tip speed ratio ρ : air density (kg/m3) ηm : gearbox efficiency ηg : generator efficiency πg : generator efficiency factor πm : gearbox efficiency factor |