Paper Menu >>
Journal Menu >>
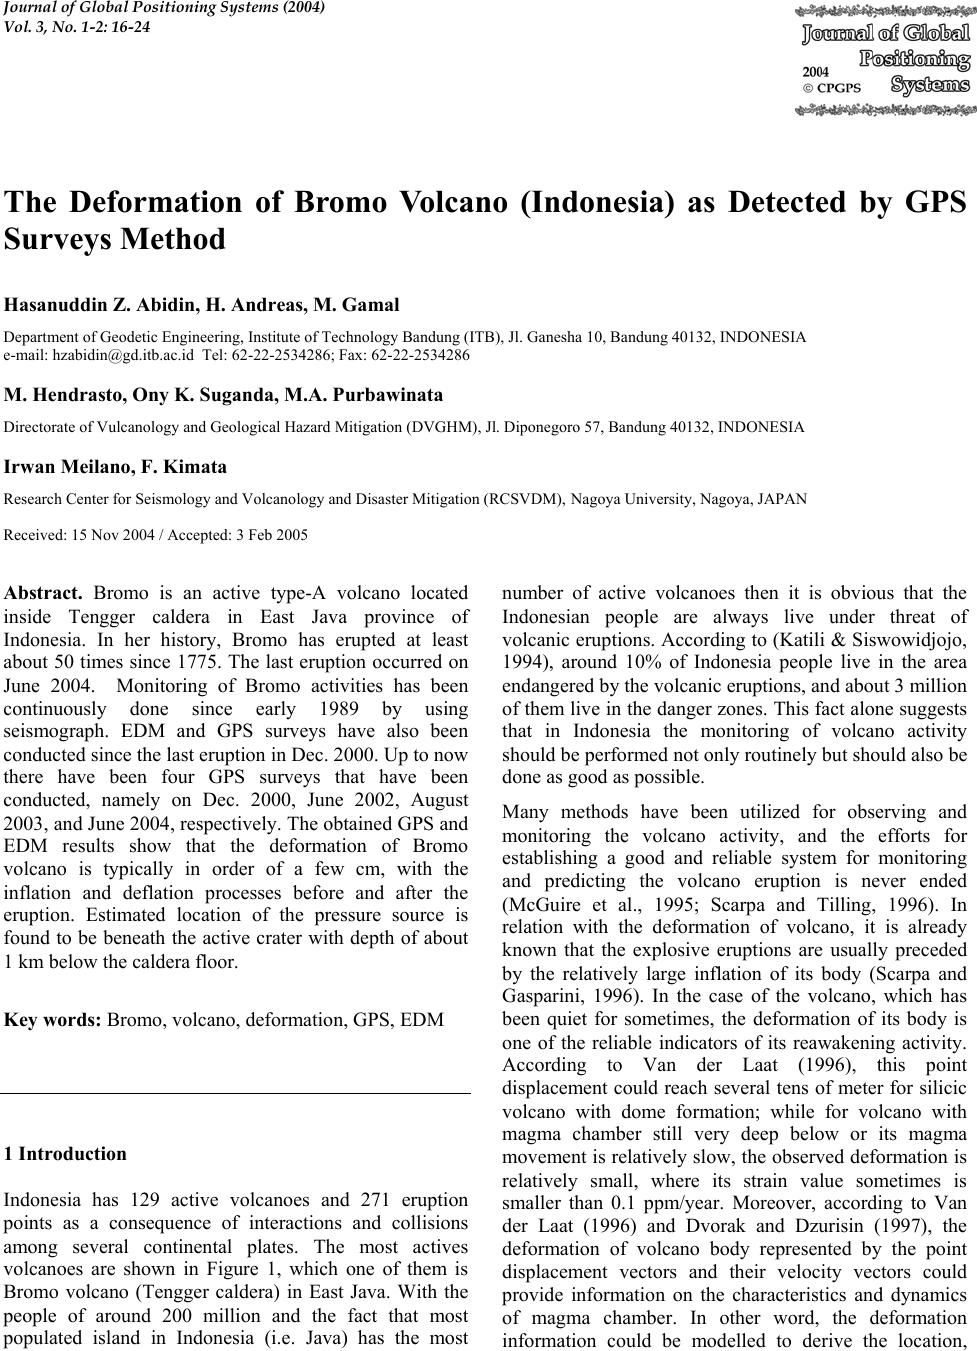 Journal of Global Positioning Systems (2004) Vol. 3, No. 1-2: 16-24 The Deformation of Bromo Volcano (Indonesia) as Detected by GPS Surveys Me t hod Hasanuddin Z. Abidin, H. And reas, M. Gamal Department of Geodetic Engineering, Institute of Technology Bandung (ITB), Jl. Ganesha 10, Bandung 40132, INDONESIA e-mail: hzabidin@gd.itb.ac.id Tel: 62-22-2534286; Fax: 62-22-2534286 M. Hendrasto , On y K . Suganda, M. A. Purbawina ta Directorate of Vulcanology and Geological Hazard Mitigation (DVGHM), Jl. Diponegoro 57, Bandung 40132, INDONESIA Irwan Meilano, F. Kimata Research Center for Seismology and Volcanology and Disaster Mitigation (RCSVDM), Nagoya University, Nagoya, JAPAN Received: 15 Nov 2004 / Accepted: 3 Feb 2005 Abstract. Bromo is an active type-A volcano located inside Tengger caldera in East Java province of Indonesia. In her history, Bromo has erupted at least about 50 times since 1775. The last eruption occurred on June 2004. Monitoring of Bromo activities has been continuously done since early 1989 by using seismograph. EDM and GPS surveys have also been conducted since the last eruption in Dec. 2000. Up to now there have been four GPS surveys that have been conducted, namely on Dec. 2000, June 2002, August 2003, and June 2004, respectively. The obtained GPS and EDM results show that the deformation of Bromo volcano is typically in order of a few cm, with the inflation and deflation processes before and after the eruption. Estimated location of the pressure source is found to be beneath the active crater with depth of about 1 km below the caldera floor. Key words: Bromo, volcano, deformation, GPS, EDM 1 Introduction Indonesia has 129 active volcanoes and 271 eruption points as a consequence of interactions and collisions among several continental plates. The most actives volcanoes are shown in Figure 1, which one of them is Bromo volcano (Tengger caldera) in East Java. With the people of around 200 million and the fact that most populated island in Indonesia (i.e. Java) has the most number of active volcanoes then it is obvious that the Indonesian people are always live under threat of volcanic eruptions. According to (Katili & Siswowidjojo, 1994), around 10% of Indonesia people live in the area endangered by the volcanic eruptions, and about 3 million of them live in the danger zones. This fact alone suggests that in Indonesia the monitoring of volcano activity should be performed not only routinely but should also be done as good as possible. Many methods have been utilized for observing and monitoring the volcano activity, and the efforts for establishing a good and reliable system for monitoring and predicting the volcano eruption is never ended (McGuire et al., 1995; Scarpa and Tilling, 1996). In relation with the deformation of volcano, it is already known that the explosive eruptions are usually preceded by the relatively large inflation of its body (Scarpa and Gasparini, 1996). In the case of the volcano, which has been quiet for sometimes, the deformation of its body is one of the reliable indicators of its reawakening activity. According to Van der Laat (1996), this point displacement could reach several tens of meter for silicic volcano with dome formation; while for volcano with magma chamber still very deep below or its magma movement is relatively slow, the observed deformation is relatively small, where its strain value sometimes is smaller than 0.1 ppm/year. Moreover, according to Van der Laat (1996) and Dvorak and Dzurisin (1997), the deformation of volcano body represented by the point displacement vectors and their velocity vectors could provide information on the characteristics and dynamics of magma chamber. In other word, the deformation information could be modelled to derive the location, 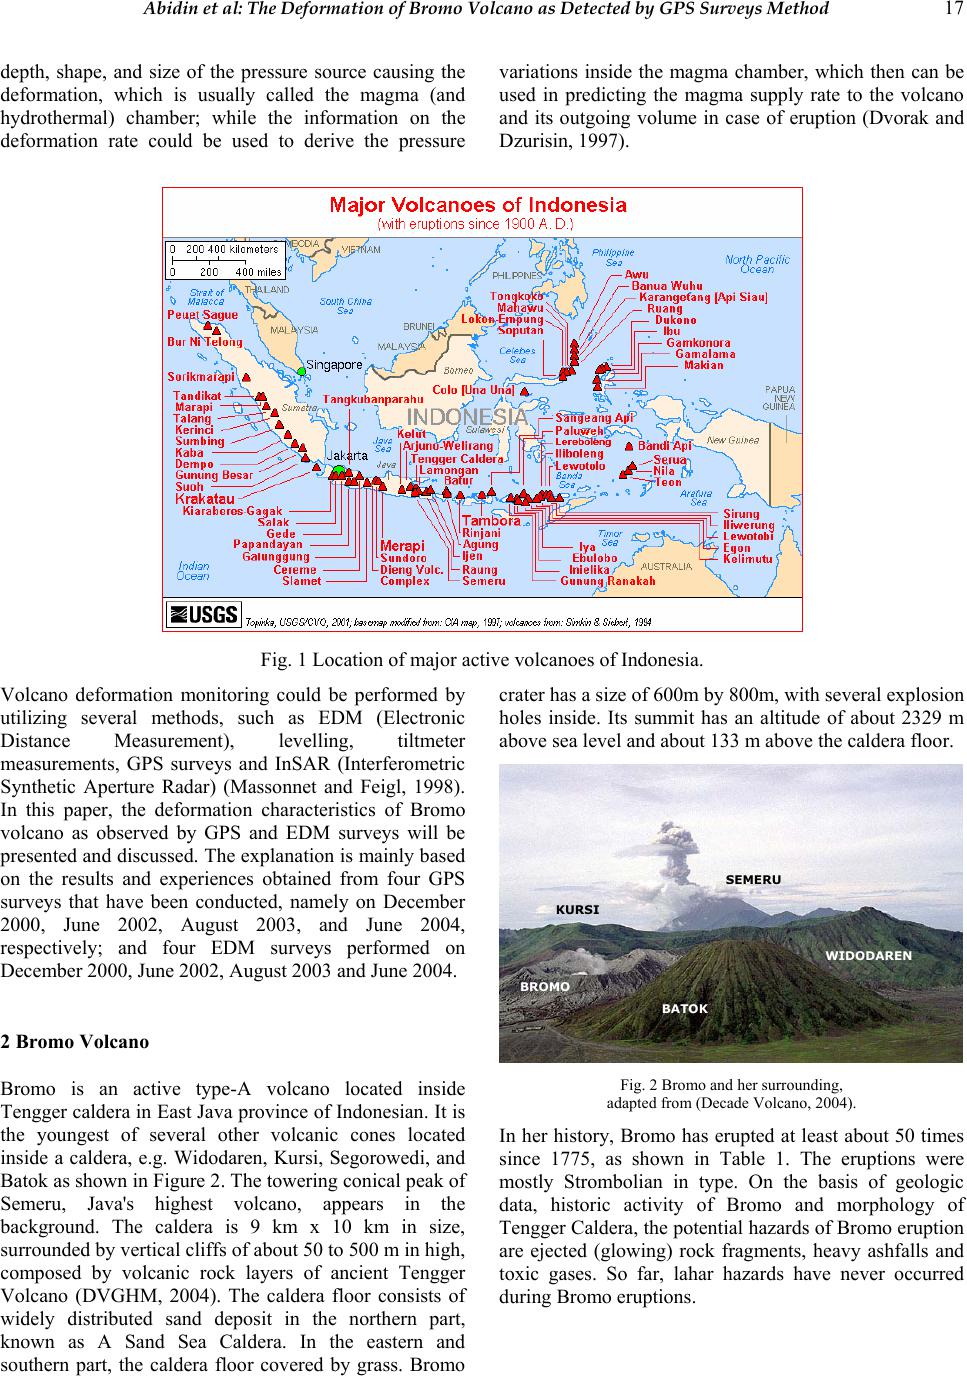 Abidin et al: The Deformation of Bromo Volcano as Detected by GPS Surveys Method 17 depth, shape, and size of the pressure source causing the deformation, which is usually called the magma (and hydrothermal) chamber; while the information on the deformation rate could be used to derive the pressure variations inside the magma chamber, which then can be used in predicting the magma supply rate to the volcano and its outgoing volume in case of eruption (Dvorak and Dzurisin, 1997). Fig. 1 Location of major active volcanoes of Indonesia. Volcano deformation monitoring could be performed by utilizing several methods, such as EDM (Electronic Distance Measurement), levelling, tiltmeter measurements, GPS surveys and InSAR (Interferometric Synthetic Aperture Radar) (Massonnet and Feigl, 1998). In this paper, the deformation characteristics of Bromo volcano as observed by GPS and EDM surveys will be presented and discussed. The explanation is mainly based on the results and experiences obtained from four GPS surveys that have been conducted, namely on December 2000, June 2002, August 2003, and June 2004, respectively; and four EDM surveys performed on December 2000, June 2002, August 2003 and June 2004. 2 Bromo Volcano Bromo is an active type-A volcano located inside Tengger caldera in East Java province of Indonesian. It is the youngest of several other volcanic cones located inside a caldera, e.g. Widodaren, Kursi, Segorowedi, and Batok as shown in Figure 2. The towering conical peak of Semeru, Java's highest volcano, appears in the background. The caldera is 9 km x 10 km in size, surrounded by vertical cliffs of about 50 to 500 m in high, composed by volcanic rock layers of ancient Tengger Volcano (DVGHM, 2004). The caldera floor consists of widely distributed sand deposit in the northern part, known as A Sand Sea Caldera. In the eastern and southern part, the caldera floor covered by grass. Bromo crater has a size of 600m by 800m, with several explosion holes inside. Its summit has an altitude of about 2329 m above sea level and about 133 m above the caldera floor. BATOK BROMO SEMERU WIDODAREN KURSI BATOK BROMO SEMERU WIDODAREN KURSI Fig. 2 Bromo and her surrounding, adapted from (Decade Volcano, 2004). In her history, Bromo has erupted at least about 50 times since 1775, as shown in Table 1. The eruptions were mostly Strombolian in type. On the basis of geologic data, historic activity of Bromo and morphology of Tengger Caldera, the potential hazards of Bromo eruption are ejected (glowing) rock fragments, heavy ashfalls and toxic gases. So far, lahar hazards have never occurred during Bromo eruptions. 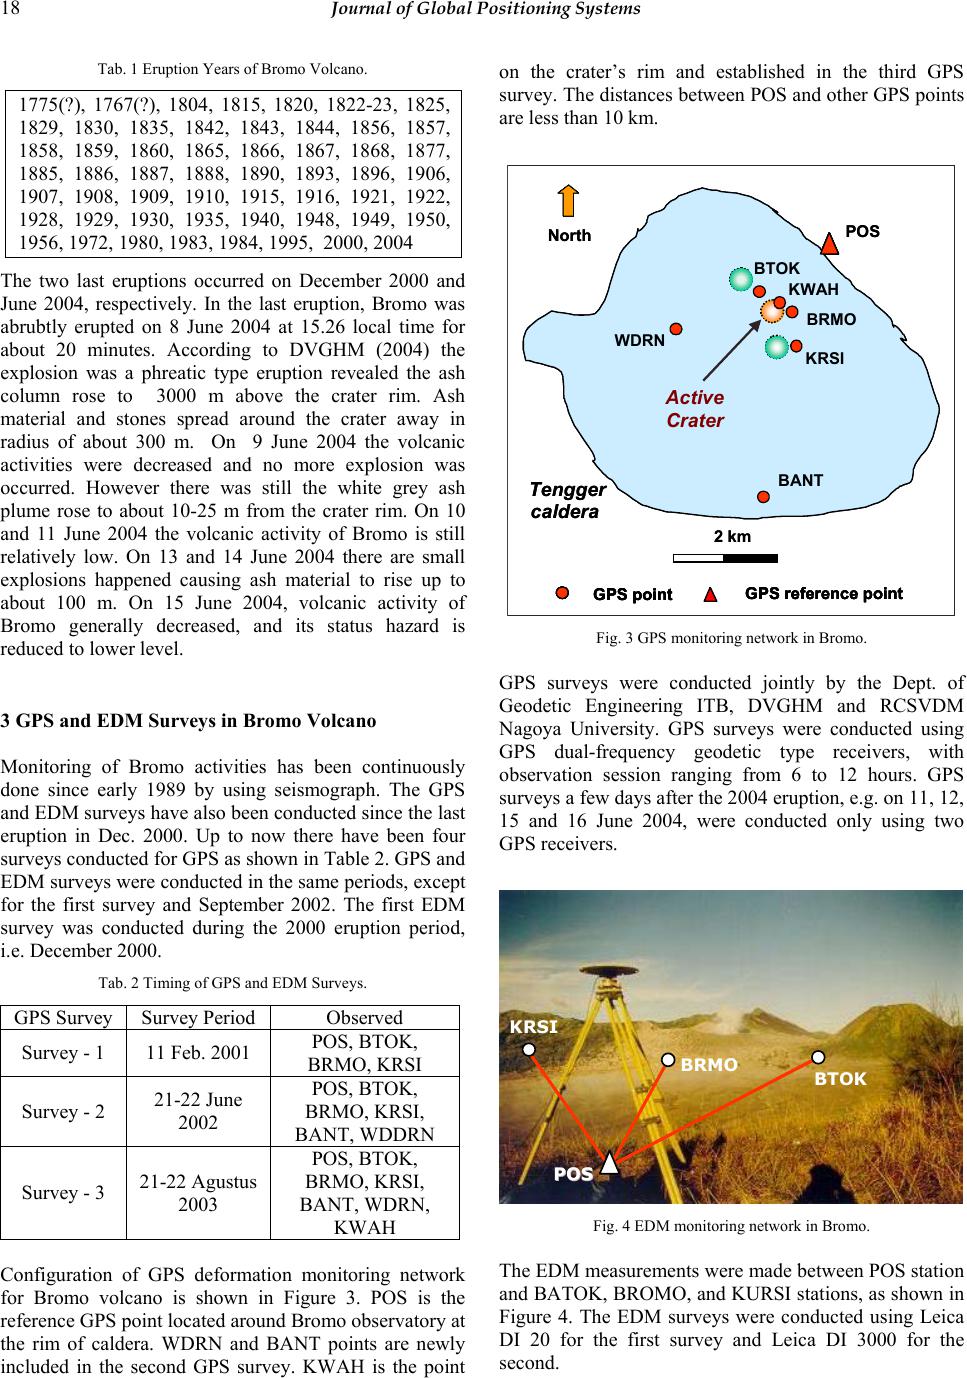 18 Journal of Global Positioning Systems Tab. 1 Eruption Years of Bromo Volcano. 1775(?), 1767(?), 1804, 1815, 1820, 1822-23, 1825, 1829, 1830, 1835, 1842, 1843, 1844, 1856, 1857, 1858, 1859, 1860, 1865, 1866, 1867, 1868, 1877, 1885, 1886, 1887, 1888, 1890, 1893, 1896, 1906, 1907, 1908, 1909, 1910, 1915, 1916, 1921, 1922, 1928, 1929, 1930, 1935, 1940, 1948, 1949, 1950, 1956, 1972, 1980, 1983, 1984, 1995, 2000, 2004 The two last eruptions occurred on December 2000 and June 2004, respectively. In the last eruption, Bromo was abrubtly erupted on 8 June 2004 at 15.26 local time for about 20 minutes. According to DVGHM (2004) the explosion was a phreatic type eruption revealed the ash column rose to 3000 m above the crater rim. Ash material and stones spread around the crater away in radius of about 300 m. On 9 June 2004 the volcanic activities were decreased and no more explosion was occurred. However there was still the white grey ash plume rose to about 10-25 m from the crater rim. On 10 and 11 June 2004 the volcanic activity of Bromo is still relatively low. On 13 and 14 June 2004 there are small explosions happened causing ash material to rise up to about 100 m. On 15 June 2004, volcanic activity of Bromo generally decreased, and its status hazard is reduced to lower level. 3 GPS and EDM Surveys in Bromo Volcano Monitoring of Bromo activities has been continuously done since early 1989 by using seismograph. The GPS and EDM surveys have also been conducted since the last eruption in Dec. 2000. Up to now there have been four surveys conducted for GPS as shown in Table 2. GPS and EDM surveys were conducted in the same periods, except for the first survey and September 2002. The first EDM survey was conducted during the 2000 eruption period, i.e. December 2000. Tab. 2 Timing of GPS and EDM Surveys. GPS Survey Survey Period Observed Survey - 1 11 Feb. 2001 POS, BTOK, BRMO, KRSI Survey - 2 21-22 June 2002 POS, BTOK, BRMO, KRSI, BANT, WDDRN Survey - 3 21-22 Agustus 2003 POS, BTOK, BRMO, KRSI, BANT, WDRN, KWAH Configuration of GPS deformation monitoring network for Bromo volcano is shown in Figure 3. POS is the reference GPS point located around Bromo observatory at the rim of caldera. WDRN and BANT points are newly included in the second GPS survey. KWAH is the point on the crater’s rim and established in the third GPS survey. The distances between POS and other GPS points are less than 10 km. GPS point POS GPS reference point North BTOK BRMO KRSI BANT WDRN Tengger caldera GPS point 2 km GPS reference point KWAH Active Crater GPS point POS GPS reference point North BTOK BRMO KRSI BANT WDRN Tengger caldera GPS point 2 km GPS reference point KWAH Active Crater Fig. 3 GPS monitoring network in Bromo. GPS surveys were conducted jointly by the Dept. of Geodetic Engineering ITB, DVGHM and RCSVDM Nagoya University. GPS surveys were conducted using GPS dual-frequency geodetic type receivers, with observation session ranging from 6 to 12 hours. GPS surveys a few days after the 2004 eruption, e.g. on 11, 12, 15 and 16 June 2004, were conducted only using two GPS receivers. POS POS BATOK BATOK BROMO BROMO KURSI KURSI POS POS BTOK BRMO KRSI POS POS BATOK BATOK BROMO BROMO KURSI KURSI POS POS BATOK BATOK BROMO BROMO KURSI KURSI POS POS BATOK BATOK BROMO BROMO KURSI KURSI POS POS BTOK BRMO KRSI Fig. 4 EDM monitoring network in Bromo. The EDM measurements were made between POS station and BATOK, BROMO, and KURSI stations, as shown in Figure 4. The EDM surveys were conducted using Leica DI 20 for the first survey and Leica DI 3000 for the second. 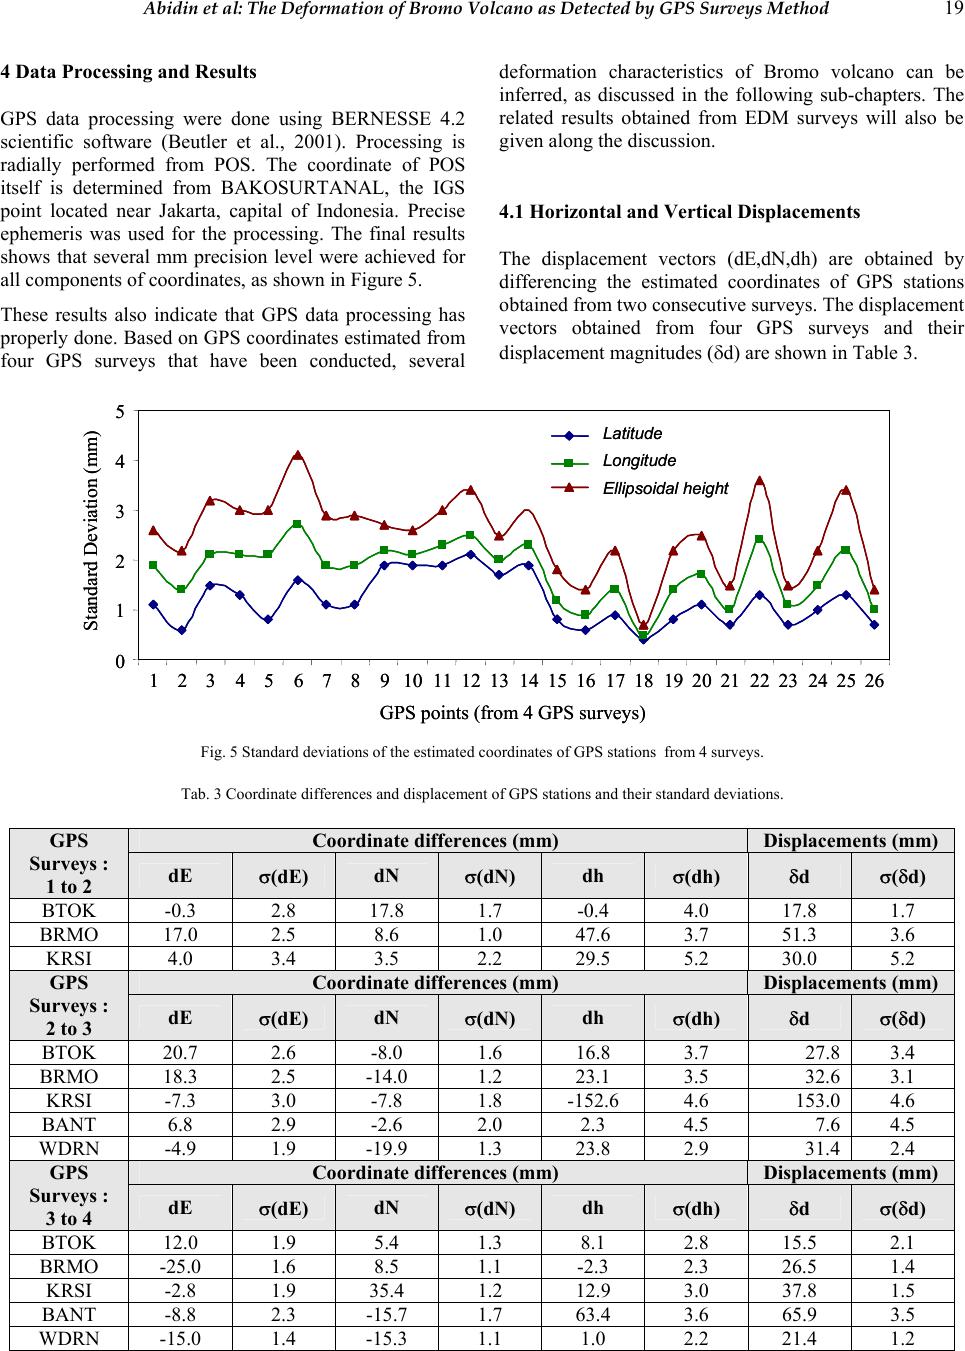 Abidin et al: The Deformation of Bromo Volcano as Detected by GPS Surveys Method 19 4 Data Processing and Results GPS data processing were done using BERNESSE 4.2 scientific software (Beutler et al., 2001). Processing is radially performed from POS. The coordinate of POS itself is determined from BAKOSURTANAL, the IGS point located near Jakarta, capital of Indonesia. Precise ephemeris was used for the processing. The final results shows that several mm precision level were achieved for all components of coordinates, as shown in Figure 5. These results also indicate that GPS data processing has properly done. Based on GPS coordinates estimated from four GPS surveys that have been conducted, several deformation characteristics of Bromo volcano can be inferred, as discussed in the following sub-chapters. The related results obtained from EDM surveys will also be given along the discussion. 4.1 Horizontal and Vertical Displacements The displacement vectors (dE,dN,dh) are obtained by differencing the estimated coordinates of GPS stations obtained from two consecutive surveys. The displacement vectors obtained from four GPS surveys and their displacement magnitudes (δd) are shown in Table 3. 0 1 2 3 4 5 1 2 34 56 7 891011121314151617181920212223242526 Latitude Longitude Ellipsoidal height Standard Deviation (mm) GPS points (from 4 GPS surveys) 0 1 2 3 4 5 1 2 34 56 7 891011121314151617181920212223242526 Latitude Longitude Ellipsoidal height Standard Deviation (mm) GPS points (from 4 GPS surveys) Fig. 5 Standard deviations of the estimated coordinates of GPS stations from 4 surveys. Tab. 3 Coordinate differences and displacement of GPS stations and their standard deviations. Coordinate differences (mm) Displacements (mm) GPS Surveys : 1 to 2 dE σ(dE) dN σ(dN) dh σ(dh) δd σ(δd) BTOK -0.3 2.8 17.8 1.7 -0.4 4.0 17.8 1.7 BRMO 17.0 2.5 8.6 1.0 47.6 3.7 51.3 3.6 KRSI 4.0 3.4 3.5 2.2 29.5 5.2 30.0 5.2 Coordinate differences (mm) Displacements (mm) GPS Surveys : 2 to 3 dE σ(dE) dN σ(dN) dh σ(dh) δd σ(δd) BTOK 20.7 2.6 -8.0 1.6 16.8 3.7 27.8 3.4 BRMO 18.3 2.5 -14.0 1.2 23.1 3.5 32.6 3.1 KRSI -7.3 3.0 -7.8 1.8 -152.6 4.6 153.0 4.6 BANT 6.8 2.9 -2.6 2.0 2.3 4.5 7.6 4.5 WDRN -4.9 1.9 -19.9 1.3 23.8 2.9 31.4 2.4 Coordinate differences (mm) Displacements (mm) GPS Surveys : 3 to 4 dE σ(dE) dN σ(dN) dh σ(dh) δd σ(δd) BTOK 12.0 1.9 5.4 1.3 8.1 2.8 15.5 2.1 BRMO -25.0 1.6 8.5 1.1 -2.3 2.3 26.5 1.4 KRSI -2.8 1.9 35.4 1.2 12.9 3.0 37.8 1.5 BANT -8.8 2.3 -15.7 1.7 63.4 3.6 65.9 3.5 WDRN -15.0 1.4 -15.3 1.1 1.0 2.2 21.4 1.2 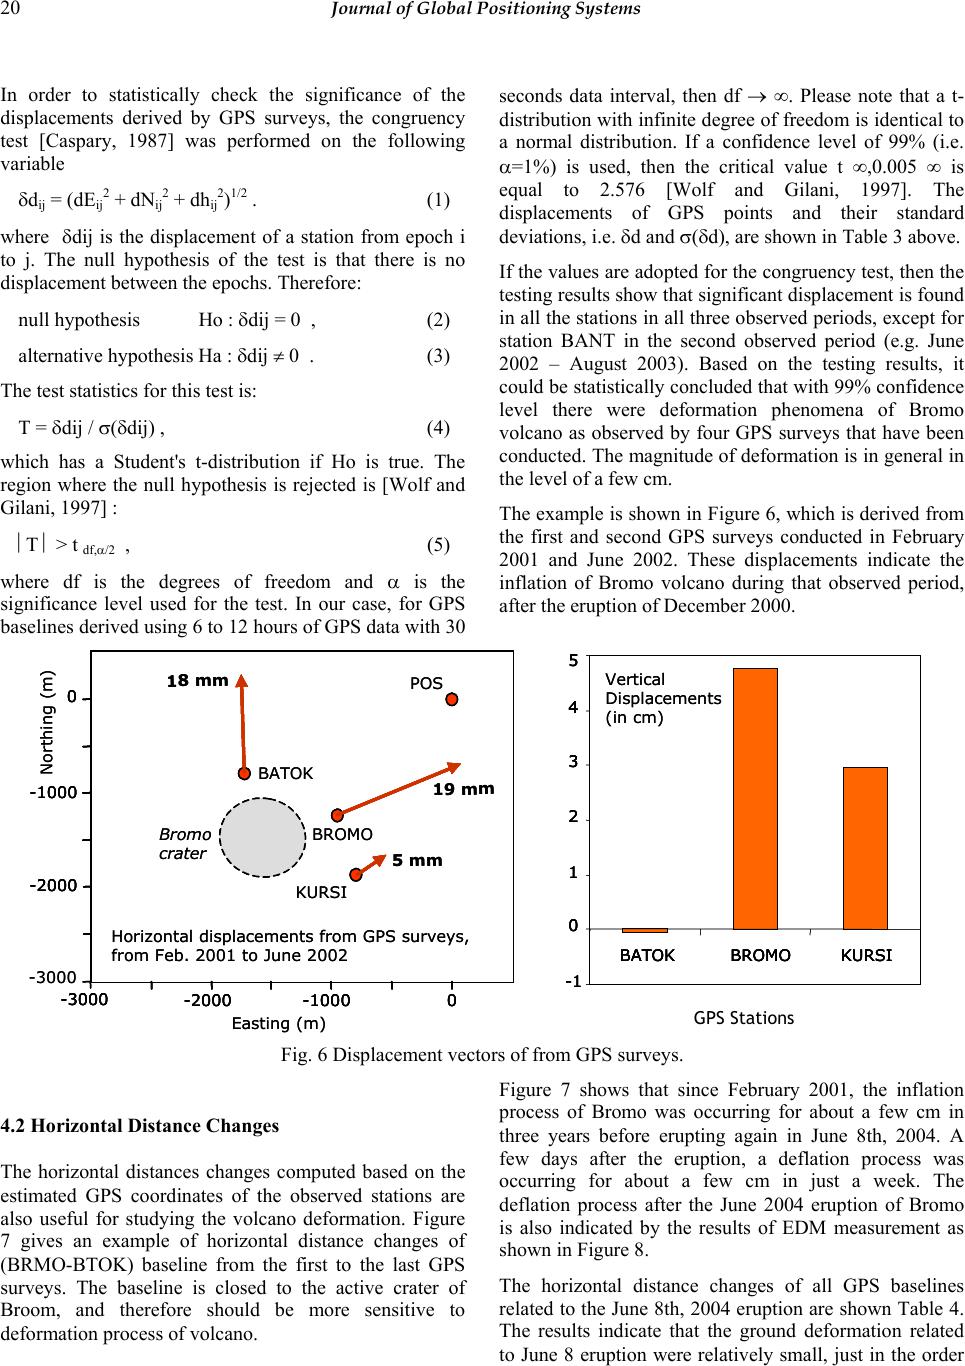 20 Journal of Global Positioning Systems In order to statistically check the significance of the displacements derived by GPS surveys, the congruency test [Caspary, 1987] was performed on the following variable δdij = (dEij 2 + dNij 2 + dhij 2)1/2 . (1) where δdij is the displacement of a station from epoch i to j. The null hypothesis of the test is that there is no displacement between the epochs. Therefore: null hypothesis Ho : δdij = 0 , (2) alternative hypothesis Ha : δdij ≠ 0 . (3) The test statistics for this test is: T = δdij / σ(δdij) , (4) which has a Student's t-distribution if Ho is true. The region where the null hypothesis is rejected is [Wolf and Gilani, 1997] : ⎢T ⎢ > t df,α/2 , (5) where df is the degrees of freedom and α is the significance level used for the test. In our case, for GPS baselines derived using 6 to 12 hours of GPS data with 30 seconds data interval, then df → ∞. Please note that a t- distribution with infinite degree of freedom is identical to a normal distribution. If a confidence level of 99% (i.e. α=1%) is used, then the critical value t ∞,0.005 ∞ is equal to 2.576 [Wolf and Gilani, 1997]. The displacements of GPS points and their standard deviations, i.e. δd and σ(δd), are shown in Table 3 above. If the values are adopted for the congruency test, then the testing results show that significant displacement is found in all the stations in all three observed periods, except for station BANT in the second observed period (e.g. June 2002 – August 2003). Based on the testing results, it could be statistically concluded that with 99% confidence level there were deformation phenomena of Bromo volcano as observed by four GPS surveys that have been conducted. The magnitude of deformation is in general in the level of a few cm. The example is shown in Figure 6, which is derived from the first and second GPS surveys conducted in February 2001 and June 2002. These displacements indicate the inflation of Bromo volcano during that observed period, after the eruption of December 2000. -2000 -10000 -300 0 -2000 -1000 0 -3000 POS BATOK BROMO KURSI Horiz o ntal di sp l acements from G P S su rveys, from Feb. 2001 to June 2002 Easting ( m ) Northing(m) 5 mm 19 mm 18 mm Bromo crater -2000 -10000 -300 0 -2000 -1000 0 -2000 -10000 -300 0 -2000 -1000 0 -3000 POS BATOK BROMO KURSI Horiz o ntal di sp l acements from G P S su rveys, from Feb. 2001 to June 2002 Easting ( m ) Northing(m) 5 mm 19 mm 18 mm Bromo crater -2000 -10000 -300 0 -2000 -1000 0 -1 0 1 2 3 4 5 BATOKBROMO KURSI Vertical Displacements (in cm) -1 0 1 2 3 4 5 BATOKBROMO KURSI -1 0 1 2 3 4 5 BATOKBROMO KURSI Vertical Displacements (in cm) -1 0 1 2 3 4 5 BATOKBROMO KURSI GPS Stations Fig. 6 Displacement vectors of from GPS surveys. 4.2 Horizontal Distance Changes The horizontal distances changes computed based on the estimated GPS coordinates of the observed stations are also useful for studying the volcano deformation. Figure 7 gives an example of horizontal distance changes of (BRMO-BTOK) baseline from the first to the last GPS surveys. The baseline is closed to the active crater of Broom, and therefore should be more sensitive to deformation process of volcano. Figure 7 shows that since February 2001, the inflation process of Bromo was occurring for about a few cm in three years before erupting again in June 8th, 2004. A few days after the eruption, a deflation process was occurring for about a few cm in just a week. The deflation process after the June 2004 eruption of Bromo is also indicated by the results of EDM measurement as shown in Figure 8. The horizontal distance changes of all GPS baselines related to the June 8th, 2004 eruption are shown Table 4. The results indicate that the ground deformation related to June 8 eruption were relatively small, just in the order 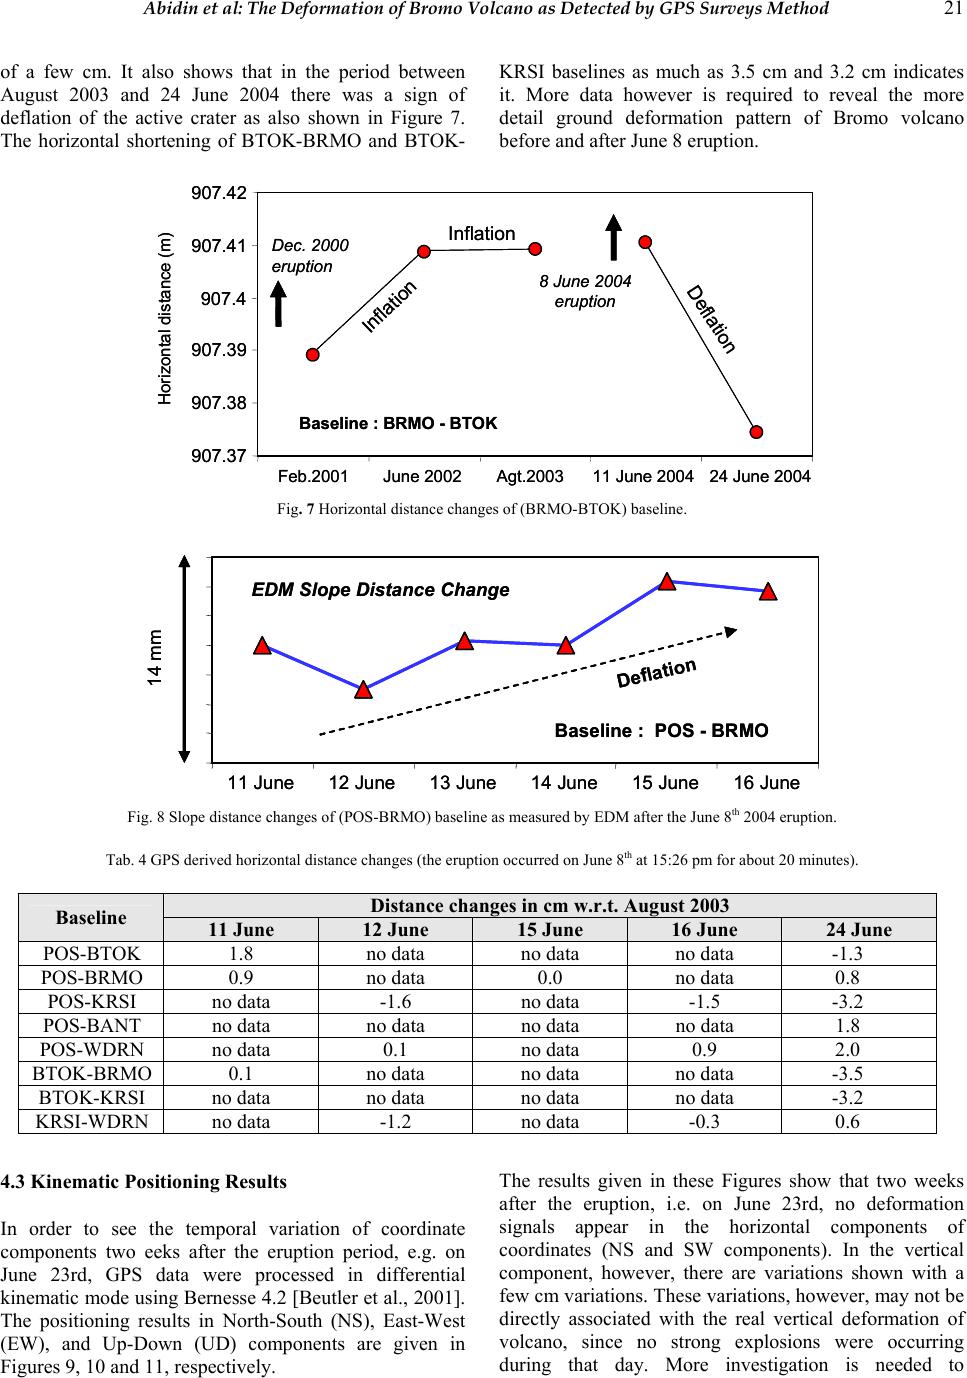 Abidin et al: The Deformation of Bromo Volcano as Detected by GPS Surveys Method 21 of a few cm. It also shows that in the period between August 2003 and 24 June 2004 there was a sign of deflation of the active crater as also shown in Figure 7. The horizontal shortening of BTOK-BRMO and BTOK- KRSI baselines as much as 3.5 cm and 3.2 cm indicates it. More data however is required to reveal the more detail ground deformation pattern of Bromo volcano before and after June 8 eruption. 907.37 907.38 907.39 907.4 907.41 907.42 Feb.2001June 2002Agt.200311 June 200424 June 2004 8 June 2004 eruption Inflation Deflation Baseline : BRMO -BTOK Horizontal distance (m) Dec. 2000 eruption Inflation 907.37 907.38 907.39 907.4 907.41 907.42 Feb.2001June 2002Agt.200311 June 200424 June 2004 8 June 2004 eruption Inflation Deflation Baseline : BRMO -BTOK Horizontal distance (m) Dec. 2000 eruption Inflation Fig. 7 Horizontal distance changes of (BRMO-BTOK) baseline. 11 June12 June13 June14 Ju ne15 June16 June 14 mm EDM Slope Dista nce Change Baseline : POS -BRMO Deflation 11 June12 June13 June14 Ju ne15 June16 June 14 mm EDM Slope Dista nce Change Baseline : POS -BRMO Deflation Fig. 8 Slope distance changes of (POS-BRMO) baseline as measured by EDM after the June 8th 2004 eruption. Tab. 4 GPS derived horizontal distance changes (the eruption occurred on June 8th at 15:26 pm for about 20 minutes). Distance changes in cm w.r.t . August 2003 Baseline 11 June 12 June 15 June 16 June 24 June POS-BTOK 1.8 no data no data no data -1.3 POS-BRMO 0.9 no data 0.0 no data 0.8 POS-KRSI no data -1.6 no data -1.5 -3.2 POS-BANT no data no data no data no data 1.8 POS-WDRN no data 0.1 no data 0.9 2.0 BTOK-BRMO 0.1 no data no data no data -3.5 BTOK-KRSI no data no data no data no data -3.2 KRSI-WDRN no data -1.2 no data -0.3 0.6 4.3 Kinematic Positioning Results In order to see the temporal variation of coordinate components two eeks after the eruption period, e.g. on June 23rd, GPS data were processed in differential kinematic mode using Bernesse 4.2 [Beutler et al., 2001]. The positioning results in North-South (NS), East-West (EW), and Up-Down (UD) components are given in Figures 9, 10 and 11, respectively. The results given in these Figures show that two weeks after the eruption, i.e. on June 23rd, no deformation signals appear in the horizontal components of coordinates (NS and SW components). In the vertical component, however, there are variations shown with a few cm variations. These variations, however, may not be directly associated with the real vertical deformation of volcano, since no strong explosions were occurring during that day. More investigation is needed to 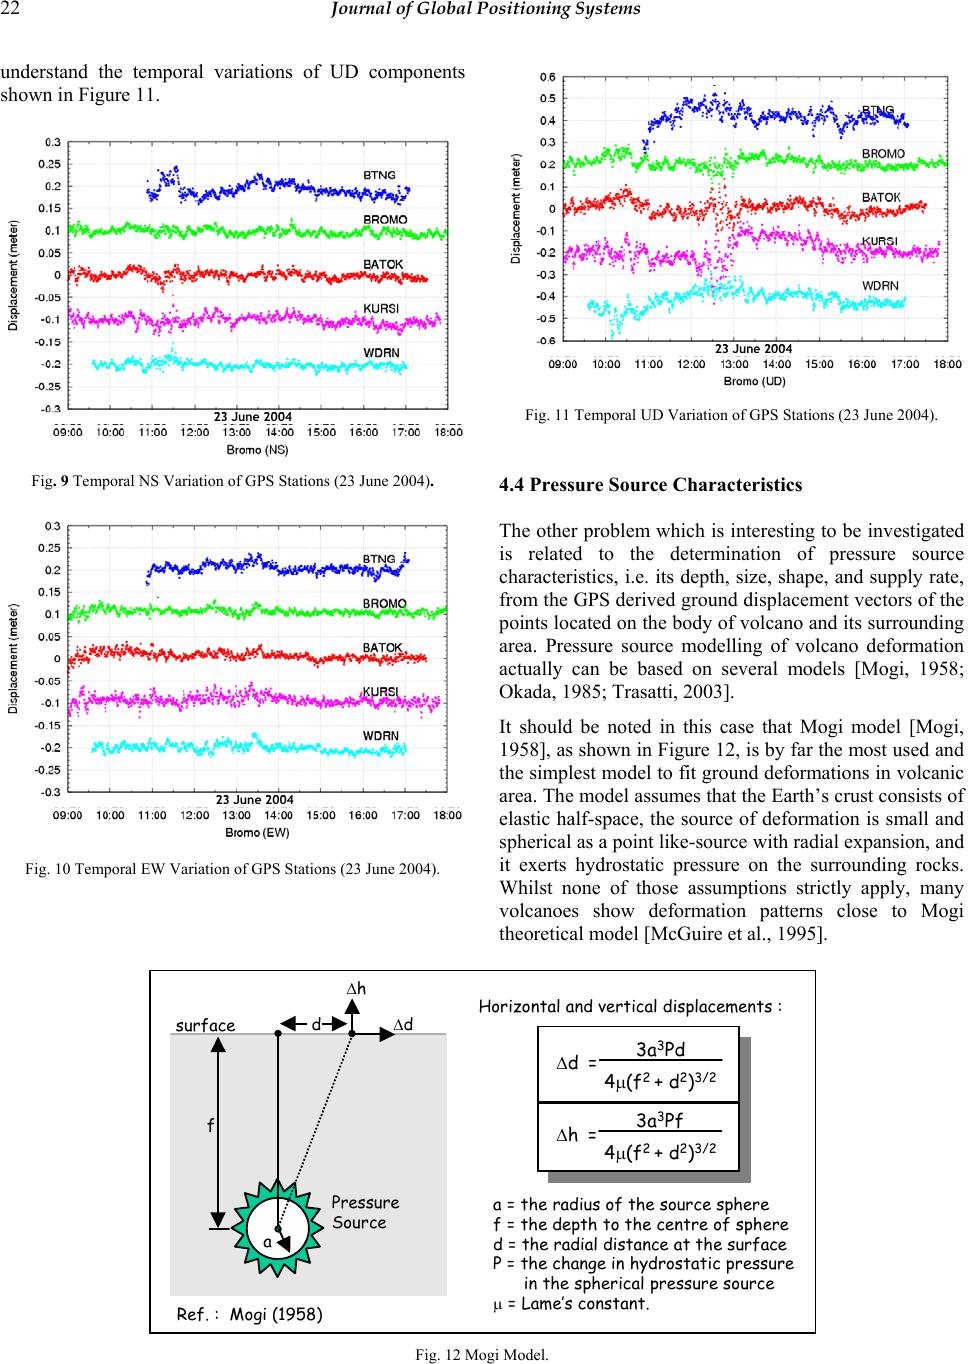 22 Journal of Global Positioning Systems understand the temporal variations of UD components shown in Figure 11. 23 June 200423 June 200423 June 2004 Fig. 9 Temporal NS Variation of GPS Stations (23 June 2004). 23 June 200423 June 200423 June 2004 Fig. 10 Temporal EW Variation of GPS Stations (23 June 2004). 23 June 200423 June 200423 June 2004 Fig. 11 Temporal UD Variation of GPS Stations (23 June 2004). 4.4 Pressure Source Characteristics The other problem which is interesting to be investigated is related to the determination of pressure source characteristics, i.e. its depth, size, shape, and supply rate, from the GPS derived ground displacement vectors of the points located on the body of volcano and its surrounding area. Pressure source modelling of volcano deformation actually can be based on several models [Mogi, 1958; Okada, 1985; Trasatti, 2003]. It should be noted in this case that Mogi model [Mogi, 1958], as shown in Figure 12, is by far the most used and the simplest model to fit ground deformations in volcanic area. The model assumes that the Earth’s crust consists of elastic half-space, the source of deformation is small and spherical as a point like-source with radial expansion, and it exerts hydrostatic pressure on the surrounding rocks. Whilst none of those assumptions strictly apply, many volcanoes show deformation patterns close to Mogi theoretical model [McGuire et al., 1995]. ∆d = 3a3Pd 4µ(f2 + d2)3/2 ∆h = 3a3Pf 4µ(f2 + d2)3/2 ∆h ∆d surface Pressure Source d f a a = the radius of the source sphere f = the depth to the centre of sphere d = the radial distance at the surface P = the change in hydrostatic pressure in the spherical pressure source µ = Lame’s constant. Horizontal and vertical displacements : Ref. : Mogi (1958) Fig. 12 Mogi Model. 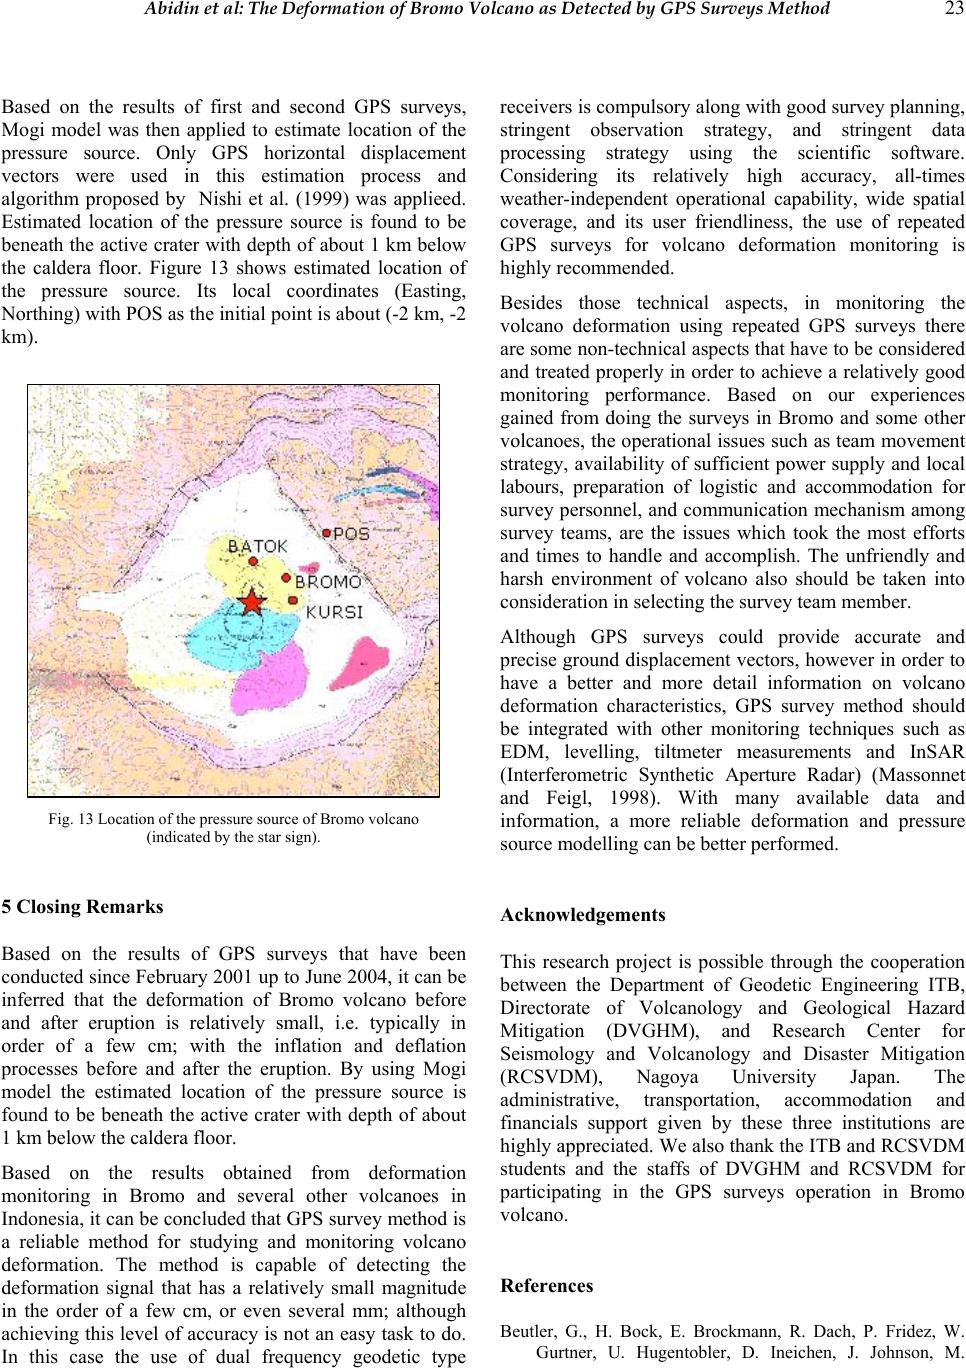 Abidin et al: The Deformation of Bromo Volcano as Detected by GPS Surveys Method 23 Based on the results of first and second GPS surveys, Mogi model was then applied to estimate location of the pressure source. Only GPS horizontal displacement vectors were used in this estimation process and algorithm proposed by Nishi et al. (1999) was applieed. Estimated location of the pressure source is found to be beneath the active crater with depth of about 1 km below the caldera floor. Figure 13 shows estimated location of the pressure source. Its local coordinates (Easting, Northing) with POS as the initial point is about (-2 km, -2 km). Fig. 13 Location of the pressure source of Bromo volcano (indicated by the star sign). 5 Closing Remarks Based on the results of GPS surveys that have been conducted since February 2001 up to June 2004, it can be inferred that the deformation of Bromo volcano before and after eruption is relatively small, i.e. typically in order of a few cm; with the inflation and deflation processes before and after the eruption. By using Mogi model the estimated location of the pressure source is found to be beneath the active crater with depth of about 1 km below the caldera floor. Based on the results obtained from deformation monitoring in Bromo and several other volcanoes in Indonesia, it can be concluded that GPS survey method is a reliable method for studying and monitoring volcano deformation. The method is capable of detecting the deformation signal that has a relatively small magnitude in the order of a few cm, or even several mm; although achieving this level of accuracy is not an easy task to do. In this case the use of dual frequency geodetic type receivers is compulsory along with good survey planning, stringent observation strategy, and stringent data processing strategy using the scientific software. Considering its relatively high accuracy, all-times weather-independent operational capability, wide spatial coverage, and its user friendliness, the use of repeated GPS surveys for volcano deformation monitoring is highly recommended. Besides those technical aspects, in monitoring the volcano deformation using repeated GPS surveys there are some non-technical aspects that have to be considered and treated properly in order to achieve a relatively good monitoring performance. Based on our experiences gained from doing the surveys in Bromo and some other volcanoes, the operational issues such as team movement strategy, availability of sufficient power supply and local labours, preparation of logistic and accommodation for survey personnel, and communication mechanism among survey teams, are the issues which took the most efforts and times to handle and accomplish. The unfriendly and harsh environment of volcano also should be taken into consideration in selecting the survey team member. Although GPS surveys could provide accurate and precise ground displacement vectors, however in order to have a better and more detail information on volcano deformation characteristics, GPS survey method should be integrated with other monitoring techniques such as EDM, levelling, tiltmeter measurements and InSAR (Interferometric Synthetic Aperture Radar) (Massonnet and Feigl, 1998). With many available data and information, a more reliable deformation and pressure source modelling can be better performed. Acknowledgements This research project is possible through the cooperation between the Department of Geodetic Engineering ITB, Directorate of Volcanology and Geological Hazard Mitigation (DVGHM), and Research Center for Seismology and Volcanology and Disaster Mitigation (RCSVDM), Nagoya University Japan. The administrative, transportation, accommodation and financials support given by these three institutions are highly appreciated. We also thank the ITB and RCSVDM students and the staffs of DVGHM and RCSVDM for participating in the GPS surveys operation in Bromo volcano. References Beutler, G., H. Bock, E. Brockmann, R. Dach, P. Fridez, W. Gurtner, U. Hugentobler, D. Ineichen, J. Johnson, M.  24 Journal of Global Positioning Systems Meindl, L. Mervant, M. Rothacher, S. Schaer, T. Springer, R. Weber (2001). Bernese GPS software version 4.2. U. Hugentobler, S. Schaer, P. Fridez (Eds.), Astronomical Institute, University of Berne, 515 pp. Caspary, W.F. (1987). Concepts of Network and Deformation Analysis. Monograph 11, School of Surveying, The University of New South Wales, Kensington, NSW, Australia, 183 pp. Decade Volcano (2004). Homepage of Decade Volcano. Address : http://www.decadevolcano.net/volcanoes/ indonesia/tengger_caldera/bromo.htm. Accessed date : 1 October 2004. DVGHM (2004). Homepage of Directorate of Volcanology and Geological Hazard Mitigation. Address : http://www.vsi.esdm.go.id/. Accessed months : September – October. Dvorak, J.J. and D. Dzurisin (1997). Volcano Geodesy : The Search for Magma Reservoirs and the Formation of Eruptive Vents. Review of Geophysics, Vol. 35, No. 3, August, pp. 343 - 384. Hofmann-Wellenhof, B., H. Lichtenegger, and J. Collins (1994). Global Positioning System, Theory and Practice. Third, Revised Edition, Springer Verlag, Wien. Katili. J.A. and S.S. Siswowidjojo (1994). Pemantauan Gunungapi di Filipina dan Indonesia. Ikatan Ahli Geologi Indonesia (IAGI). ISBN: 979-8126-05-6. 321 h + xii. Leick. A. (1995). GPS Satellite Surveying. John Wiley & Sons. Second edition. New York. ISBN 0-471-30626-6. 560 pp. Massonnet, D. and K.L. Feigl (1998). Radar Interferometry and its Application to Changes in the Earth's Surface. Reviews of Geophysics, Vol. 36, No. 4, November, pp. 441-500. McGuire, W.J. (1995). Monitoring active volcanoes – an introduction, In Monitoring Active Volcanoes by B. McGuire, C.R.J. Kilburn, and J. Murray (Eds), pp. 1-31, UCL Press Limited, London, 421 pp. McGuire B.. C.R.J. Kilburn. and J. Murray (Eds) (1995) Monitoring Active Volcanoes. UCL Press Limited. London. 421 pp. Mogi, K. (1958). Relation between the eruption of various volcanoes and the deformation of the ground surface around them. Bulletin of Earthquake Research Institute, Vol. 36, pp. 99-134. Nishi,K., H. Ono, H. Mori (1999). Global Positioning System measurements of ground deformation caused by magma intrusion and lava discharge: the 1990-1995 eruption at Unzendake volcano, Kyushu, Japan. Journal of Volcanology and Geothermal Research, Vol. 89, Nos. 1- 4, pp. 23-34. Okada, Y. (1985). Surface deformation due to shear and tensile faults in a half-space. Bulletin Seismological Society of America, Vol. 75, pp. 1135-1154. Scarpa, R. and P. Gasparini (1996) A Review of Volcano Geophysics and Volcano-Monitoring Methods. In Monitoring and Mitigation of Volcano Hazards by R. Scarpa and R.I. Tilling (Eds.), Springer Verlag, Berlin, pp. 3 - 22. Scarpa. R. and R.I. Tilling (Eds.) (1996). Monitoring and Mitigation of Volcano Hazards. Springer Verlag. Berlin. 841 pp. Trasatti, E., C. Giunchi, M. Bonafede (2003). Effects of topography and rheological layering on ground deformation in volcanic regions, Journal of Volcanology and Geothermal Research, Vol. 122, pp. 89-110. Van der Laat, R. (1996) Ground-Deformation Methods and Results. In Monitoring and Mitigation of Volcano Hazards by R. Scarpa and R.I. Tilling (Eds.), Springer Verlag, Berlin, pp. 147 - 168. Wolf, Paul R. and C.D. Ghilani (1997). Adjustment Computations, Statistics and Least Squares in Surveying and GIS. John Wiley & Sons, Inc., New York, 564 pp. |