Agricultural Sciences
Vol.4 No.12(2013), Article ID:41184,7 pages DOI:10.4236/as.2013.412106
Common beans (Phaseolus vulgaris L.) in the rations for cattle in feedlot
![]()
1Universidade Federal da Grande Dourados (UFGD), Faculdade de Ciências Agrárias, Dourados, Brasil; rafaelgoes@ufgd.edu.br
2Universidade Federal da Grande Dourados (UFGD), Faculdade de Engenharia, Dourados, Brasil
Copyright © 2013 Rafael Henrique de Tonissi e Buschinelli de Goes et al. This is an open access article distributed under the Creative Commons Attribution License, which permits unrestricted use, distribution, and reproduction in any medium, provided the original work is properly cited.
Received 25 October 2013; revised 27 November 2013; accepted 15 December 2013
Keywords: Average Daily Gain; Digestibility; Ruminal Parameters; Urea
ABSTRACT
To evaluate the inclusion of common beans in the diet of cattle in feedlot on characteristics of productive performance, nutrient digestibility and ruminal fermentation parameters, 15 bulls crossed were used in a completely randomized design. The animals were confined for 64 days, and 21 days of adaptation. We evaluated the inclusion common beans at levels of 0%, 13% and 26%. All diets were isocaloric and isonitrogenous with a 45:55 forage: concentrate ratio. The addition of beans in the diet did not affect animal performance, dry matter intake and feed efficiency. Inclusion bean changed the nutrient digestibility of DM, CP, EE, TC and OM, where the best digestibility was observed with the inclusion 13% and the lowest concentration of ruminal NH3-N. The general behavior of ruminal pH in relation to levels of inclusion of beans was 6.2. The inclusion of up to 13% of beans in the diet of feedlot cattle did not alter the apparent digestibility, ruminal and animal performance.
1. INTRODUCTION
With the evolution and greater competitiveness of Brazilian agricultural sector, the profit margins for the farmer got even tighter. Ahead of this, producers were seeking new technologies and strategies to accompany the competitive agricultural market.
The average inclusion of concentrated ration in feedlot of beef cattle corresponds on average to 79% of the dry matter intake of the diet [1]. Among the alternatives, the processing of agroindustrial products produces waste products that contribute to production system of ruminant animals, presenting itself as a promising alternative to reduce feed costs herd.
The common bean (Phaseolus vulgaris L.) shows considerable regional availability in crop in 2012/2013 presented an average yield of 3283,800 tons [2]. However, prior knowledge of their chemical composition and the acceptability by animals, is necessary so that we can incorporate it into feed for ruminants.
The common bean has a crude protein content of around 237.7 g/kg DM [3-5]. [6] characterized the common bean as a product of low acceptability and digestibility, with recommendations for inclusion of up to 15% in concentrates for fattening cattle. [7] already indicated the inclusion 20% and 10% in diets for dairy and beef cattle. [8] evaluated the inclusion of 0%, 13%, 26% and 39% in concentrates for lactating cows and found that the inclusion of beans resulted in the reduction of milk production of the animals.
The residue of beans processing has, in its composition, lectins which are proteins or glycoproteins of nonimmune origin, fixers carbohydrates, able to agglutinate and precipitate the glycoconjugates [9]. According to [10], the lectin present in legume grains is not degraded in the rumen and can be supplied at low levels of supply and for short periods without causing toxicity in cattle, but the [7] emphasizes that the lectin is denatured in the rumen.
According to [11], the lower digestibility submitted by beans is due to the presence of globulin and albumin, which represent on average 75% of bean proteins; the globulin G1, specifically represents 35% to 50% of total proteins. The globulin G1 is particularly resistant to proteolysis when non-denatured, which makes the bean protein digestibility lower than some leguminous and cereals [12].
The presence of tannins can interfere the protein digestibility possessing the ability to form complexes with the globulin G1, primarily through hydrophobic interactions, producing a significant reduction in the digestibility of this fraction, even at high concentrations of proteases [13]. The digestibility of the beans is reduced “in nature” conditions, but increases after heat treatment [14].
The uses of agroindustrial byproducts are alternatives to the production systems. The objective with this study was to evaluate the increasing levels of waste improvement of common bean (Phaseolus vulgaris L.) in concentrates for cattle maintained in a feedlot.
2. MATERIALS AND METHODS
The experiment was carried out at the Nutrition of Ruminants sector of, College Agricultural Sciences, Federal University of Dourados (MS) (22˚11'49.39"S; 54˚56'18.39"W). A total of 15 crossbred dairy cattle, 3 fitted with rumen cannula. The animals were housed individually in 8 m2 (4.0 × 2.0).
At the beginning of the experiment, the animals were weighed, identified and wormed with Ivermectin 1%, and randomly distributed among treatments. The animals were subjected to an adaptation period of 21 days to the experimental conditions. Was used corn silage as forage and concentrate mixture in a ratio 45:55 on the basis of dry matter (DM). The experimental period lasted 63 days between the months of October and December 2012.
The treatments were defined by the inclusion of 0%, 13% and 26% common bean (Tables 1 and 2). All diets were isocaloric and isonitrogenous and balanced according to recommendations of [15] for daily gains of 1.5 kg.
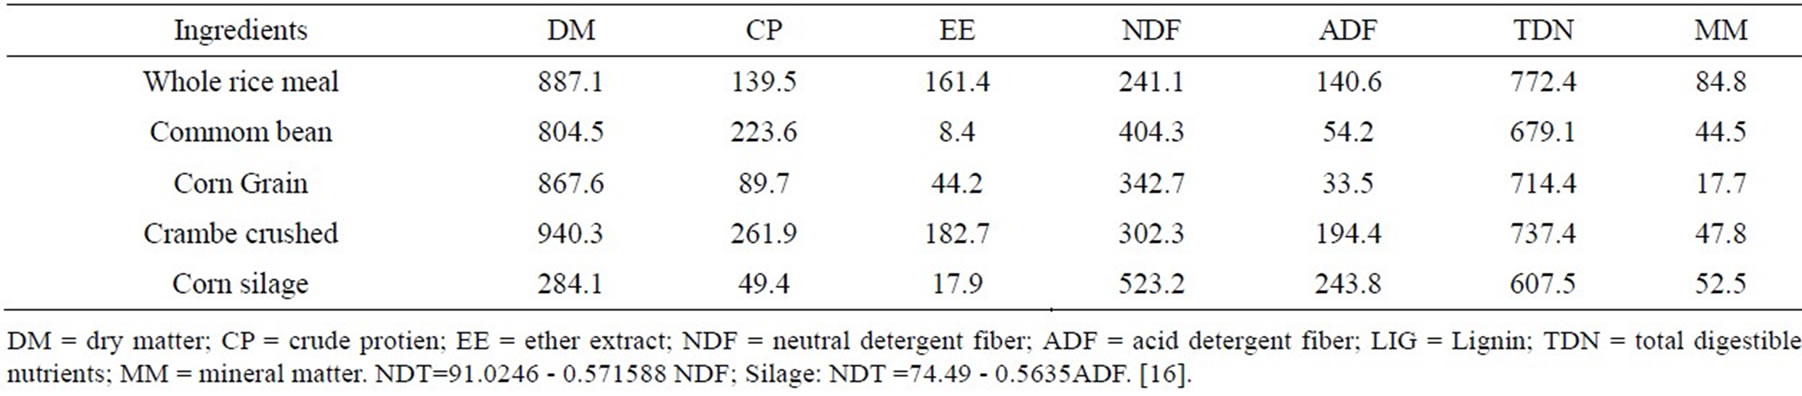
Table 1. Chemical composition of the ingredients used in the diets (g/kg DM).
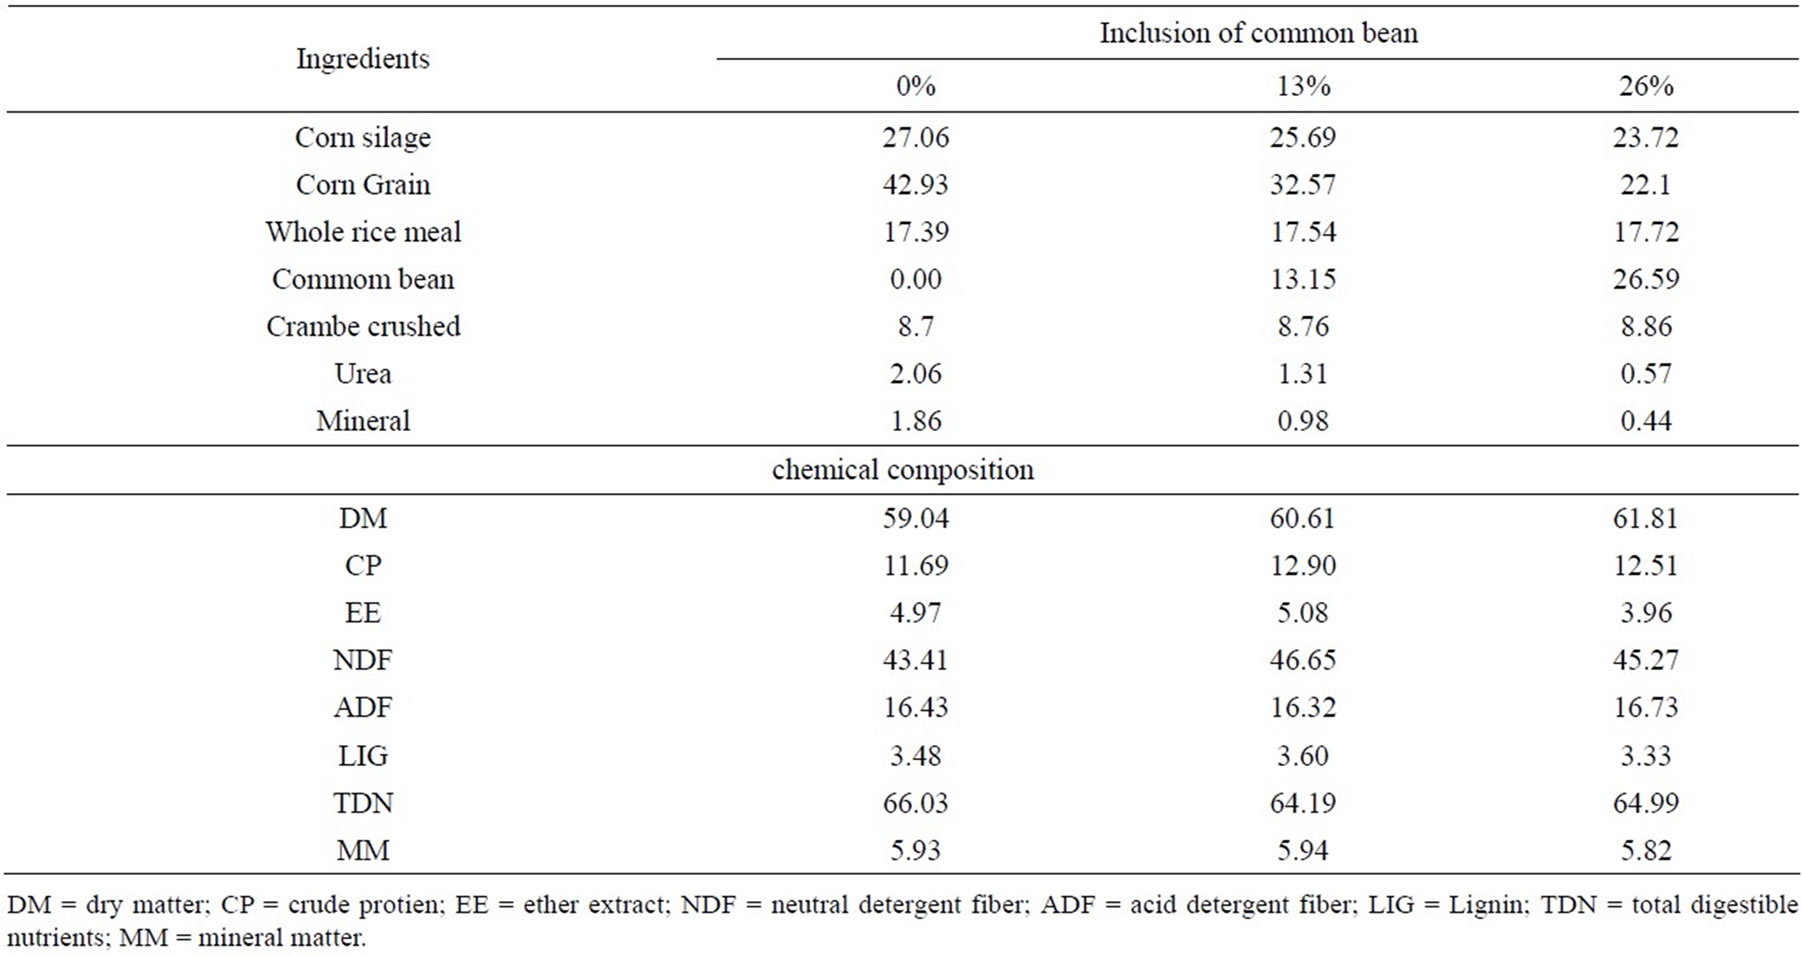
Table 2. Proportion of ingredients in diets (% DM) and chemical composition of diets (g/kg DM).
The animals received food in two daily treatments in order to provide remains around 10% of the amount provided. Intake of the animals was monitored daily and animal weight was performed every 21 days, after fasting for 16 hours. We evaluated to the Feed Conversion (FC) = dry matter intake (g)/average daily gain (g), Food Efficiency (FE) = average daily gain (g)/dry matter intake (g), and protein efficiency ratio (PER) = average daily gain (g)/protein intake (g).
Fecal samples were collected in two sequential periods. The collections were made in the 15th and 16th day of each experimental period. There were intermittent 6 sampling from the rectum of animals at intervals of 1 hour and 30 minutes [17]. At the end of each period the samples were pre-dried [18], forming a composite sample per animal and period.
The digestibility of dry matter and other nutrients was determined by using a indigestible acid detergent fiber (iADF) as internal marker, which was determined by in situ incubation over a period of 240 hours [19].
On the 20th day of each experimental period was collected blood sample from each animal. The data was collected by puncture of the jugular vein and were used heparin Vacutainer® tubes and transported to the Laboratory of Animal Nutrition UFGD, which were centrifuged at 3000 rpm for 15 minutes to remove the plasma. The plasma was stored in tubes “eppendorf” and frozen at −20˚C for analysis of plasma urea levels. Plasma urea was determined by colorimetry method by commercial kit (Gold Analisa®).
The collection of rumen fluid for the determination of pH and ammonia concentration was performed on day 21 of the experimental period. Three animals with cannula rumen were used and the samples were manually collected at the interface liquid/solid rumen in times: 0, 2, 4, 6, 8 and 10 hours after the feeding supply, and filtered through triple layer gauze.
The pH determination was performed immediately after collection, in 40 mL of ruminal fluid and measured with the use of portable digital peagameter. For the determination of ammonia nitrogen was collected 40 mL of ruminal fluid, which has been preserved with 1 mL of 1:1 HCl, to prevent fermentation and volatilization of ammonia, being frozen at −20˚C.
To determine the concentration of ruminal N-NH3, the ruminal fluid was thawed and centrifuged at 3000 rpm for 10 min. The supernatant was collected to quantify the concentration of ammonia nitrogen by the Micro-Kjedhal method, and distillation with KOH 2N, using a 2% boric acid and titulation with 0.005 N hydrochloric acid [20].
All samples were first grinded in knife mills with sieves of 3 mm for the determination of dry matter (DM), organic matter (OM), crude protein (CP), ether extract (EE) and ash (MM) according to the methods described by [18]. The determination of neutral (NDF) and acid (ADF) detergent fiber and lignin was performed by the sequential method [21].
The TDN of silage, concentrate and ingredients were estimated by equations proposed by [16]: TDN% = 74.49 − 0.5635*FDA (r2 = 0.82) and TDN% = 91.0246 − 0.571588*NDF).
The statistical analyzes were performed by a completely randomized design, and measures of ruminal pH and ammonia were determined in a plot arrangement. Analyses of variance and regression were performed by using the Statistical Package SAEG 9.1 [22] and averages compared by Tukey test at 5% probability.
3. RESULTS AND DISCUSSION
The levels of inclusion of beans showed no significant difference for the parameters of dry matter intake (DMI), crude protein intake (CPI), TDN intake (TDNI), carbohydrates intake (CHOTI), mineral matter intake (MMI), organic matter intake (OMI) and NDF intake (NDFI). We observed a significant difference and a quadratic response (y = −0.3863x2 + 7.4247x + 382, R2 = 0.80) for the intake of EE, and the inclusion of 26% of beans (Table 3) showed below the other treatments; with maximum point for inclusion was at 10.40%. The commons
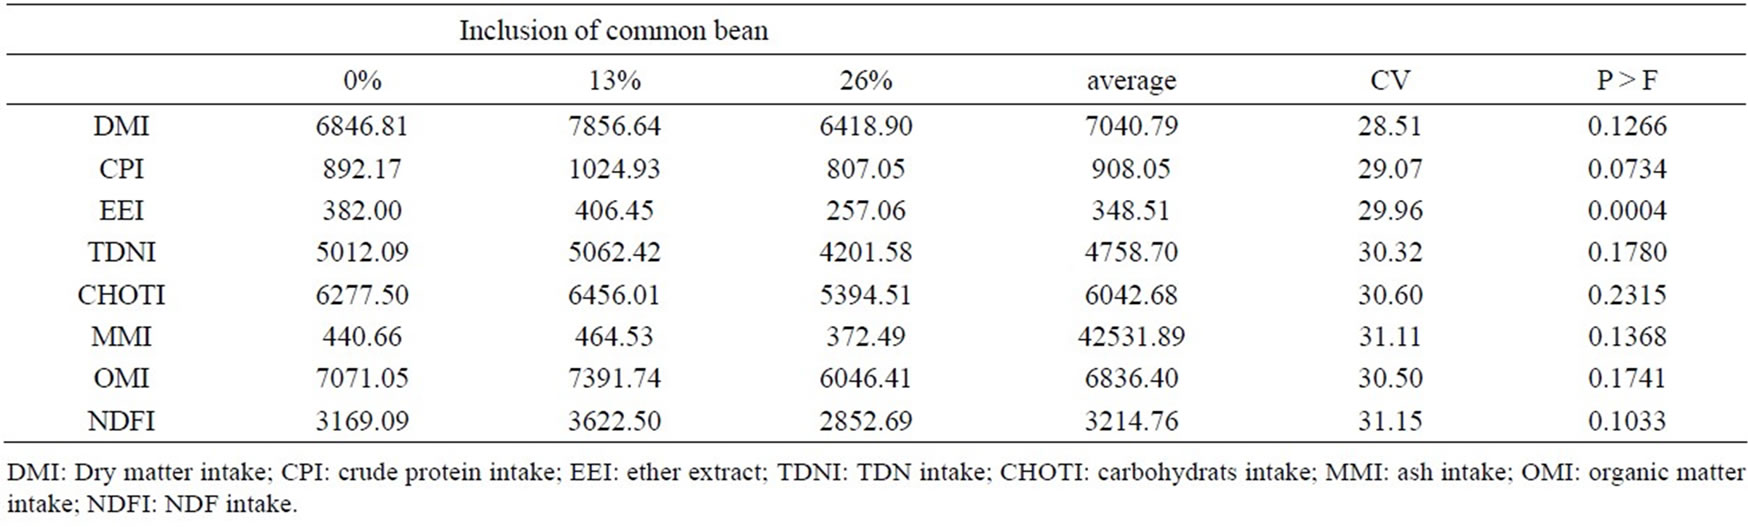
Table 3. Values of nutrient intake (g/day) and their coefficients of variation.
beans has low level of EE (8.4 g/kg DM), and conesquently the greater inclusion of this product reduces the lipid content of the diet. According to [8], the inclusion of 0%, 13%, 26% and 39% of beans for lactating cows decreased EE intake with increasing levels of inclusion studied, coinciding with the present work.
Reduction of the DM, OM, CP and TDN, was found for inclusion beans, possibly due to low palatability presented by beans due to the presence of tannins [8], increasing dustiness of concentrates with higher levels of included since it difficult to swallow food bolus with the formation of pasty material. This work has not been observed to reduce the consumption of DM animals. The beans was characterized in a product of low digestibility and acceptability with recommendations of adding up to 15% and from 20% to 25% concentrates intended for fattening cattle and sheep [6], respectively, however, was observed in this study good acceptance.
The consumption is negatively correlated with NDF diet, indicating that beans slows the degradation of NDF, expanding the rumen fill effect associated with the potentially degradable fraction of NDF [23]. This can be explained by repletion greater bean starch digestion in the rumen, increasing the lag time (lag time) of the fibrous portion [24]. However, reducing the consumption of NFC, associated with less involvement of starch as a constituent of these NFC makes this the unlikely event [8].
The inclusion of beans little band did not alter average daily gain, feed conversion, feed efficiency and protein efficiency rate of the animals (Table 4). Cattle feedlot feeding with beans compared to cottonseed meal, showed 20% superior to animals that received only cottonseed meal [25].
Beans, at low levels of supply and for short periods, may not cause symptoms of toxicity in cattle, although there may be a reduction in feed conversion as steers have lectins specific antibodies, indicating adverse effects of supply bean [10]. With increasing inclusion, CA remained very close between treatments in the present work, discarding the hypothesis that the residue used was responsible for a possible reduction of CA.
The feed conversion obtained can be considered satisactory, since lying within a normal range [26]. EA has not reduced according to the inclusion in the diet of beans little band in the present work, where the treatment means are within and above the normal range.
The inclusion of beans altered nutrient digestibility DM, OM, CP, EE, and TC (Table 5). We observed decreased digestibility coefficients for the inclusion of 26%, which may be associated with anti-nutritional factors (tannins, lectins, trypsin inhibitors). The bean has low acceptability and digestibility and recommendation for use between 15% to 20% of the concentrate for growing cattle; levels in which the lectin was denatured in the rumen [6,7]. However, the lectin present in legume grains is not degraded [10]. The lectins combined with the cells of the intestinal wall, reducing the absorption of nutrients [27].
The reduction in digestibility coefficients for CP are in
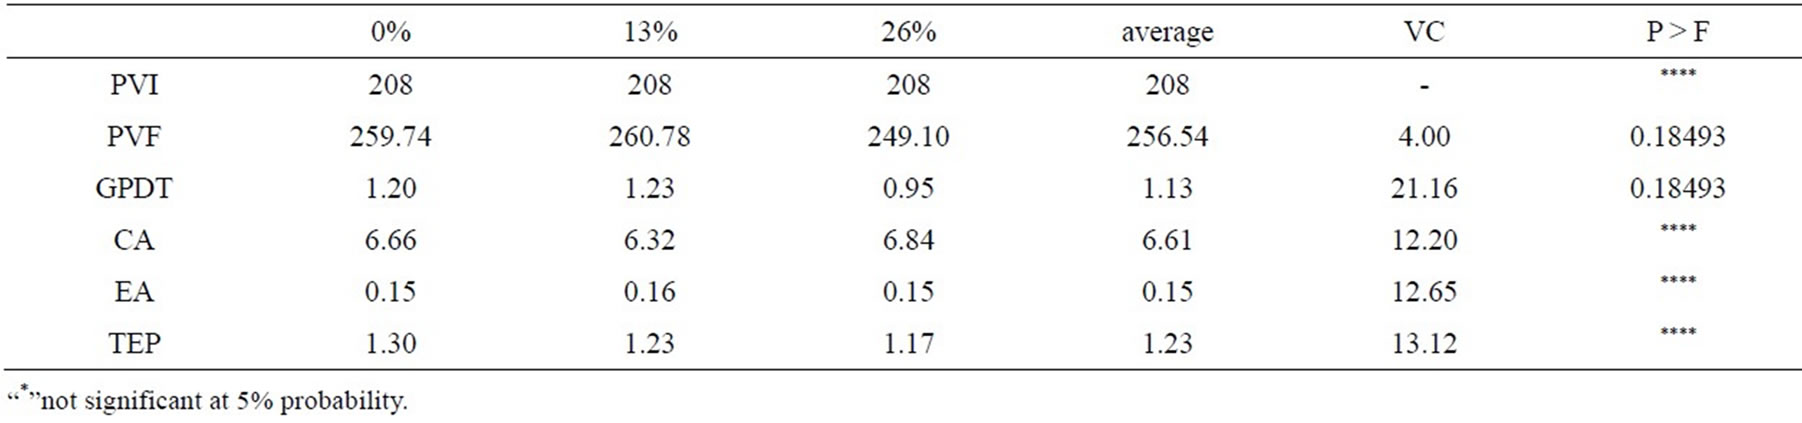
Table 4. Mean values of initial body weight (PVI), final (PVF), average daily gain (GPDT), feed conversion (FC), feed efficiency (FE) and protein efficiency rate (PER) of feedlot cattle fed beans

Table 5. Coefficients of digestibility of nutrients and their coefficients of variation.
agreement with data presented by [8], which gave a linear reduction in the replacement of soybean meal protein by protein bean, which resulted in higher ruminal repletion of potentially digestible NDF. This work was not replacing the protein source for the beans but rather an addition to the use of crambe crushed, which may have influenced the digestibility coefficients.
The reduction in digestibility could alter the animals’ performance, since it causes excessive fecal loss of protein secreted by the pancreas, pancreatic enzymes because they are rich in sulfur amino acids and non-endogenous this loss can be compensated by protein intake of legumes [28,29].
The low digestibility of protein is one of the major nutritional problems presented by Bean. Trypsin inhibitors affect the digestion of proteins, reducing the release of amino acids intestinal absorption [30]. The albumins and globulins present, represents, on average, 75% of bean proteins [13], and globulin G1 is specifically 35% to 50% of total proteins, and is resistant to proteolysis when undenatured what makes the present bean protein digestibility lower than some cereals and legumes [12].
Even after heat treatment, the digestibility would be limited due to the change of the primary structure of the protein and the retention of proteases inhibitors or polyphenolic interacting with digestive enzymes and/or proteins from beans, forming complexes and decreasing its level hydrolysis [31].
Another factor that would alter this nutrient digestibility and especially of the protein would be tannin that have the ability to form complexes with the globulin G1, basically hydrophobic interactions [13], and the bacteriostatic and bactericidal effects on ruminal microbiota [32]. The tannins have not been quantified but can observe their presence during the process of determining the FDA, which resulted in intense pink color of the detergent solution. The formation of groups is oxonios acid catalyzed, with red or pink solution indicative of the presence of condensed tannins [33].
The change in digestibility of NFC was due to the partial substitution of corn meal by Bean. Starch is the most NFC of maize, while the bean starch is about 60% of NFC [8], then occurring change in carbohydrate constituents of this fraction, since the inclusion of beans reduced the proportion of corn diet (Table 2). The highest observed in dustiness concentrated to higher levels bean increases the specific surface of the particles improves the hydration and subsequent degradation by rumen microorganisms.
The inclusion of bean residue in the diet did not affect ruminal pH (p > 0.05), but more the concentration of ruminal NH3-N, and plasma urea, which showed a quadratic effect (Figure 1).
The mean values for pH were 6.42, above the mini-

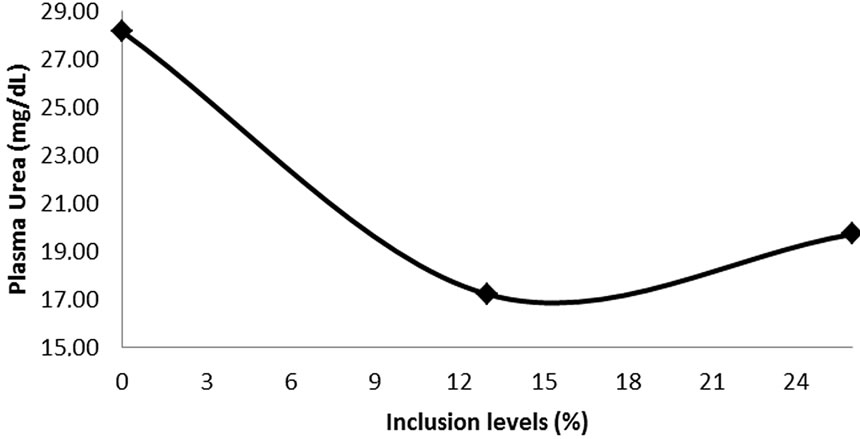
Figure 1. Ammonia and plasma urea in feedlot cattle receiving different levels of inclusion of beans. (NH3-N: Y = 0.0192x2 − 0.7623x + 15.866 r2 = 0.9; Urea plasma: Y = 0.0299x2 − 1.178x + 28.159, r2 = 0.9).
mum of 6.2 to affect ruminal microbiota [34]. Including over 10% in the diet could predispose to subclinical acidosis [7], which was not observed in this study with higher doses. The general behavior of ruminal pH in relation to levels of inclusion of beans remained constant.
Ammonia concentrations showed average of 9.52 mg/dL. The concentration of NH3-N ruminal of 5 mg/dL to support cellulolytic activity is recommender to [35], already [36], pointed out that for maximum microbial growth the minimum would be 10 mg/dL, next the values found in this work.
The concentration of plasma urea followed the behavior of the levels of ruminal ammonia. Normal values of plasma urea in cattle are between 17 - 45 mg/dL [37]; already [38], proposed that concentrations of plasma urea in cattle less than 11 mg/dL, indicated a PDR deficiency in the rations provided, which probably does not occur in this study, because the values were higher than that reported by this author. The average plasma urea was 21.40 mg/dL, below the limits above which would N losses occurring dietary that the second [39] is above 24 to 25 mg/dL blood.
4. CONCLUSION
The inclusion of beans in the diet for feedlot did not affect animal performance, interfering in fermentation patterns and nutrient digestibility.
5. ACKNOWLEDGEMENTS
The Conselho Nacional de Desenvolvimento Científico e Tecnológico (CNPq) and Universidade Federal da Grande Dourados (UFGD) for financially supporting this work, the Universidade Federal da Grande Dourados (UFGD and CNPq by scholarships granted. To Debora Hoff Brait, for help in blood analises.
REFERENCES
- Oliveira, C.A. and Millen, D.D. (2011) Lifting on nutriational recommendations and management practices adopted by feedlot nutritionists in Brazil. 3rd International Symposium on Nutrition Ruminants, Botucatu-SP.
- Companhia Nacional de Abastecimento (2013) Monitoring of the Brazilian grain crops 2012/13. Sixth Lifting, CONAB, 26.
- Antunes, P.L., Bilhalva, A.B., Elias, M.C. and Soares, G.J.D. (1995) Nutritional value of beans (Phaseolus vulgaris L.), variety rico 23, carioca, piratã-1 e rosinha-G2. Revista Brasileira de Agrociência, 1, 12-18.
- Patussi, R.A., Goes, R.H.T.B., Cardoso, T.J.L., Gressler, M.G.M., Oliveira, E.R. and Brabes, K.C.S. (2011) Chemical composition and in situ ruminal degradability of bean by-products in beef cattle feeding. 48th Annual Meeting of the Brazilian Society of Animal Science, Belém, BELEM-PA 2011.
- Valadares Filho, S.C., Magalhães, K.A., Rocha Júnior, V.R. and Cappelle, E.R. (2006) Brazilian tables of food composition for cattle: CQBAL 2.0. 2nd Edition, UFV/ DZO, Viçosa, 329.
- Nunes, I.J. (1998) Calculation and evaluation of diets and supplements. FEP-MVZ, Belo Horizonte, 185.
- Department of Primary Industries and Fisheries (2003) Navy beans for stock feed. DPI. http://www.dpi.qld.gov.au
- Magalhães, A.L.R., Zorzi, K., Queiroz, A.C., Mello, R., Detmann, E. and Pereira, J.C. (2008) Residue from common bean (Phaseolus vulgaris L.) processing in the rations for milking cows: Intake, digestibility, milk production and composition and feeding efficiency. Revista Brasileira de Zootecnia, 37, 529-537. http://dx.doi.org/10.1590/S1516-35982008000300019
- Goldstein, I.J. (1980) What should be called lectin. Nature, 285, 66-68. http://dx.doi.org/10.1038/285066b0
- MOSS, R. (2005) Can legume grains be used for dairy cows? www.dpi.qld.gov.au
- Mendonça, C.V.C.E., Abreu, C.M.P., Corrêa, A.D., Santos, C.D. and Morais, A.R. (2003) Polyphenol quantification and protein digestibility in common bean lineages. Ciência e Agrotecnologia, 27, 858-864. http://dx.doi.org/10.1590/S1413-70542003000400018
- Sgarbieri, V.C. (1996) Proteins in food protein: Properties, degradations, modifications. Livraria Varela, São Paulo, 517.
- Lajolo, F.M., Genovese, M.I. and Menezes, E.W. (1996) Nutritional quality. In: ARAÚJO, R.S., RAVA, C.A., Stone, J.F., et al., Eds., Common Bean Crops in Brazil, POTAFÓS, Piracicaba, 23-56.
- Soltelo, A., Flores, F. and Hernandez, M. (1987) Chemical composition and nutritional value of Mexican varieties of chickpea (Cicer arietinum L.). Plant Food and Human Nutrition, 37, 299-306.
- National Research Council (2001) Nutrient requirements of dairy cattle. 7th Edition, NRC, Washington DC, 381.
- Cappelle, E.R., Valadares Filho, S.C., Silva, J.F.C. and Cecon, P.R. (2001) Estimates of the energy value from chemical characteristics of the feedstuffs. Revista Brasileira de ZootecniaRevista Brasileira de Zootecnia, 30, 1837-1856. http://dx.doi.org/10.1590/S1516-35982001000700022
- Barros, E.E.L., Fontes, C.A.A., Detmann, E., Vieira, R.A.M., Henriques, L.T. and Fernandes, A.M. (2009) Biases in fecal excretion estimation by using internal markers and chromic oxide in digestion trials with ruminants. Revista Brasileira de Zootecnia, 38, 2015-2020. http://dx.doi.org/10.1590/S1516-35982009001000023
- Association of Official Analytic Chemists (2006) Official methods of analysis. 18 Edition, AOAC International, Arlington, 1422.
- Casali, A.O., Detmann, E., Valadares Filho, S.C., Pereira, J.C., Henriques, L.T., Freitas, S.G. and Paulino, M.F. (2008) Influence of incubation time and particles size on indigestible compounds contents in cattle feeds and feces obtained by in situ procedures. Revista Brasileira de Zootecnia, 37, 335-342. http://dx.doi.org/10.1590/S1516-35982008000200021
- Campos, F.P., Nussio, C.M.B. and Nussio, L.G. (2004) Methods of analysis of food. FEALQ, 135.
- Van Soest, P.J., Robertson, J.B. and Lewis, B.A. (1991) Methods for dietary fiber, neutral detergent, and nonstarch polysaccharides in relation to animal nutrition. Journal of Dairy Science, 74, 3583-3597. http://dx.doi.org/10.3168/jds.S0022-0302(91)78551-2
- Universidade Federal de Viçosa (2007) SAEG–System of statistical analysis and genetic. Versão 9.1, UFV, Viçosa, 142.
- Mertens, D.R. (1994) Regulation of forage intake. In: Fahey Jr., G.C., Ed., Forage Quality, Evaluation, and Utilization, American Society of Agronomy, Madison 450-493.
- Mertens, D.R. and Loften, J.R. (1980) The effect of starch on forage fiber digestion kinetics in vitro. Journal of Dairy Science, 63, 1437-1446. http://dx.doi.org/10.3168/jds.S0022-0302(80)83101-8
- Neves, J.D., Caldas, G.C. and Araújo, P.E.S. (2005) Cowpea grain for cattle feed in confinement. Anais da Academia Pernambucana de Ciência Agronômica, 2, 157-165.
- Hutjens, M.F. (2002) Using dairy efficiency. www.traill.uiuc.edu
- Jaffé, W.G. (1968) Fatores tóxicos em leguminosas. Archivos Latinoamericanos de Nutrición, 18, 205.
- Rackis, J.J. and Gumbmann, M.R. (1982) Protease inhibitors: Physiological properties and nutritional significance. In: Ory, R.L., Ed., Antinutritional and Natural Toxicants in Foods, Food & Nutrition Press, Westport, 203-237.
- Silva. M.R. and Silva, M.A.A.P. (2000) Antinutritional factors: Protease inhibitors and lectins. Revista de Nutrição, 13, 3-9.
- Butolo, J.E. (2002) Quality of ingredients in animal feed. Agros Comunicações, Campinas, 430.
- Bonett, L.P., Baumgartner, M.S.T., Klein, A.C. and Silva, L.I. (2007) Nutritional compounds and antinutritional aspects of commom beans (Phaseolus Vulgaris L.). Arquivos de Ciências da Saúde da UNIPAR, 11, 235-246.
- Henis, Y., Tagari, H. and Volcani, R. (1964) Effect of water extract of carob pods tannic acid and their derivaties on the morphology and growth of micro-organisms. Applied Microbiology, 12, 204-211.
- Van Soest, P.J. (1994) Nutritional ecology of the ruminant. 2nd Edition, Cornell University Press, Ithaca, 476.
- Russel, J.B. and Wilson, D.B. (1996) Why are ruminal cellulolitic bacteria unable to digest cellulose at low pH? Journal of Dairy Science, 79, 1503-1509. http://dx.doi.org/10.3168/jds.S0022-0302(96)76510-4
- Satter, L.D. and Slyter, L.L. (1974) Effect of ammonia concentration of rumen microbial protein production in vitro. British Journal of Nutrition, 69, 2755-2766. http://dx.doi.org/10.1079/BJN19740023
- Detmann, E., Cecon, P.R., Paulino, M.P., Valadares Filho, S.C., Henriques, L.T. and Detmann, K.S.C. (2007) Rumen variables evaluated through continuum mathematical functions. Pesquisa Agropecuária Brasileira, 42, 1651- 1657. http://dx.doi.org/10.1590/S0100-204X2007001100018
- Kaneko, J.J., Marvey, J.W. and Bruss, N.L. (1997) Clinical biochemistry of domestic animals. 5th Edition, Academic Press, New York.
- Broderick, G.A., Craig, W.M. and Ricker, D.B. (1993) Urea versus true protein as supplement for lactating dairy cows fed grains plus mixtures of alfafa and corn silages. Journal of Dairy Science, 76, 2266-2274. http://dx.doi.org/10.3168/jds.S0022-0302(93)77563-3
- Oliveira, A.S., Valadares, R.F.D., Valadares Filho, S.C., Cecon, P.R., Renno, L.N., Queiroz, A.C. and Chizotti, M.L. (2001) Microbial protein production, purine derivatives and urea excretion estimate in lactating dairy cows fed isoprotein diets with different non protein nitrogen compounds levels. Revista Brasileira de Zootecnia, 30, 1621-1629. http://dx.doi.org/10.1590/S1516-35982001000600032