Theoretical Economics Letters
Vol.07 No.05(2017), Article ID:78351,10 pages
10.4236/tel.2017.75095
Competition Strategy and Geographical Proximity of Contract Research Organizations
Tannista Banerjee1*, Arnab Nayak2
1Department of Economics, Auburn University, Auburn, AL, USA
2Department of Economics, Mercer University, Atlanta, GA, USA

Copyright © 2017 by authors and Scientific Research Publishing Inc.
This work is licensed under the Creative Commons Attribution International License (CC BY 4.0).
http://creativecommons.org/licenses/by/4.0/


Received: June 16, 2017; Accepted: August 8, 2017; Published: August 11, 2017
ABSTRACT
We investigate the evidence for geographical proximity of contract research organizations (CROs) in the United States. We examine whether CROs locate near each other for knowledge spillover motivation, or whether they avoid each other as a competition strategy. If they are not located near to each other, then they are not likely to cooperate, or source knowledge from each other. We use a spatial pattern approach and find that CROs are located spatially in the United States. CROs do not consistently access localized knowledge from other CROs, rather they avoid each other and establish in isolated locations to capture the entire market.
Keywords:
Contract Research Organizations, Pharmaceutical, R & D, Outsourcing

1. Introduction
The contract research organizations (CROs) provide outsourced research support to pharmaceutical, biotechnology and medical device industries. CROs are independent research firms performing research for pharmaceutical companies. CROs perform research and create knowledge. CROs provide support for drug discovery, preclinical research, clinical trials involving complex human subjects, etc. As the pharmaceutical and biotechnology industries evolve over time, CRO industry is also expanding over time. Pharmaceutical market is growing rapidly worldwide and the U.S. has the fastest-growing CRO market. The CRO industry is dependent on the pharmaceutical industry, but it is a separate industry and it is an interesting industry because of the growing nature, prevalence of different kinds of contracts, high competition, and sizeable revenue of the CRO industry. One interesting aspect of the CRO industry is the geographical pattern of CROs.
Pharmaceutical industry shows increase in R & D expenses in the last few decades [1] . Increase in R & D expenses is due to high patent costs and FDA regulatory pressures. Both the complex patent process and drug approval process require detailed study reports and data before the approval of new drug applications [NDA]. Frost and Sullivan [2] explains that late stage drug research, clinical trials have become more expensive than early stage pre-clinical trials. The growth rate of phase III (late stages of human trial) was 0.8% between 1995 and 2005, whereas the growth rate for phase I (first stage of human trial) was 1.0% during the same period (please see [1] for a detailed description of drug development process). This indicates that failure rates for drug candidates have been more in later phases and suggests that the complexity of the later phase is greater than the pre-clinical and phase I studies. Contract research organizations reduce the cost of R & D with their expertise and reduce the time-to-market for drug candidates by enhancing the speed and accuracy of the later phases of trials. CROs also provide efficient data managements to their clients [2] . These advantages of CROs give the bio-pharmaceutical firms an edge over its competitors.
CROs specialize in clinical research for drugs, treating many high demand diseases. CROs perform research with greater cost effectiveness and faster speed of completion. The toxicology services of CROs have also increased rapidly. Previously, pharmaceutical and biotechnology companies used to do the early stages of the development within their own laboratories, but with increased demand for new drugs, demand for toxicology services are also rising. Given the limited capacity of pharmaceutical firms, demand for CROs is increasing for non-clini- cal and toxicology services, along with phase II-IV services. Therefore, CROs are continuously adding to their capacity.
Researchers in the past studied R & D intensive industries and the existence of knowledge spillover in R & D firms [3] [4] [5] [6] [7] . Since knowledge spillover decreases with distance, research firms gain from other nearby firms, hence lead to economic agglomerations. The empirical literature identifies the clustering patterns of industrial research laboratories [8] , but there is no study that examines the spatial patterns of contract research organizations for the bio-pharmaceutical industry. In this paper, we investigate the geographical agglomeration of CROs as a competitive strategy of CROs.
Literature [8] and [9] study the clustering of economic activities without considering the forces behind it. On the other hand, [3] , [11] and [12] consider the driving forces behind this agglomeration and find that knowledge spillover has a positive effect on clustering.
Ellison and Glaeser [9] argue that the clustering of an industry occurs only when locational advantages are important for profits, as measured by an industry’s employment share being above the average manufacturing employment for a given region. Ellison and Glaeser [9] propose an index of concentration that corrects for the pre-existing distribution of economic activity surrounding a region. Using data from the U.S. 1987 Census of Manufacturers on industry employment, and looking at areas surrounding industrial laboratories, [9] computes the index of concentration of all four-digit SIC category industries. The result shows that all U.S. manufacturing industries are concentrated, but textile, tobacco and leather industries are more concentrated than others. Again measuring the extent of `backward and forward’ linkages between the industries (two-digit category) the authors find that textile, tobacco and lumber are the most co-agglomerated industries. Following Ellison and Glaeser’s [9] results, Dumais et al. [10] prove that there is a dynamic of economic agglomeration.
Given that agglomeration exists in U.S. manufacturing, researchers explain the forces behind agglomeration. Glaeser [13] argues that the development of industrial inputs and the availability of specialized labor contribute to reduced transport costs for goods, people and ideas. Applod [8] investigates “urbanization economies” and access to specialized knowledge using a dataset consisting of information on the location of laboratories from the 1985 edition of the Industrial Research Laboratories of the United State. Applod [8] uses data on county characteristics from the County and City Data Book and information on universities from the Assessment of Research Ph.D Department (National Academy of Science Publication). The results show that more urbanized a county is, the more laboratories it will have and more agglomerated they will be.
D’Aspremont and Jacquemin [6] show that firms’ production and innovation decisions are influenced by knowledge spillover from rival firms. D’Aspremont and Jacquemin [6] consider a Cournot model with two firms and two stages of production in the presence of R & D externalities (such as spillover). D’Aspre- mont and Jacquemin (1988) show that welfare effects depend on the values of knowledge spillover.
KMZ [7] considers the same cases as [6] , but the spillover is through R & D expenditures of the rival firm. KMZ [7] theoretically proves that under R & D spillover, total surplus is greater when firms cooperate in R & D decisions only. Unlike [6] ’s results, KMZ [7] finds that increase in input spillover decreases R & D productivity, irrespective of the value of spillover.
These models define how, under knowledge spillover, R & D cooperation decisions affect equilibrium output, R & D effort and welfare. Hence, R & D is affected by the presence of spillover effects. Jaffe et al. [14] uses patents and patent citation data and Audresch and Feldman [11] uses new product introduction as a measure of innovative activities. Jaffe et al. [14] shows that a patent gets cited more frequently within the state in which it is registered than in other states. Similarly, Audresch and Feldman [11] show that industries for which new economic knowledge is important tend to cluster their innovative activities. Audresch and Feldman [11] include production concentration in the innovation equation to control for the effect of the concentration of economic activities (like [14] ). This implies that the concentration of innovative activity (the Gini coefficient) is explained only from the variation in knowledge variables that is independent of the concentration of production. After estimating two agglomeration equations (production and innovation) separately and also simultaneously, Audresch and Feldman [11] find positive and significant coefficients for all the variables of knowledge spillover. This result suggests that even after controlling for the degree of industrial concentration, spillover is an important factor in the clustering of innovative activities. Both of these papers provide evidence of knowledge spillover as a reason for agglomeration.
Audretsch and Stephan [12] provide support for the above conclusions by measuring the role of face-to-face interactions, between university personnel and laboratories, in the clustering of companies. Using a dataset for small biotechnology companies, the authors estimate a Probit model of scientist-company locational matching. The result shows that after controlling for regional effects and firm density, the location of founders and/or chairs of scientific boards significantly increase the likelihood of geographical proximity when it is important for the company to have direct knowledge transfer from scientists.
Following this trend, Furman et al. [15] use the geographical distribution of research activities of pharmaceutical firms to investigate the extent of knowledge spillover from private and public institutions. Furman et al. [15] substantially improves previous knowledge, as it analyzes spillover at the product-class level and uses world data rather than data from a particular country. This paper also distinguishes between privately and publicly generated spillover, which is new for this kind of analysis.
The above discussion shows that economic activities (including innovative activities) illustrate geographical concentration and that knowledge spillover and the presence of similar units are the forces behind this clustering phenomenon.
The CRO industry is a relatively new but growing industry, and the geographical pattern of this industry is still unexplored. The location of other firms signals that a particular research environment is favorable or that human subjects and other facilities are relatively accessible (as [16] and [17] show with geographical clustering for biotechnology firms). On the other hand, there is a possibility that companies avoid one another to reduce competition for staff and/or to maximize access to scarce resources. If some CROs are present in a county, then an entering firm expects that existing firms are already using the resources and services, thus leading to a decision to choose an alternative location. Therefore, locational patterns should be regular but not clustered ( [8] ). This paper, analyzes the geographical clustering of CRO industry and investigates the competitive strategies of the industry. The empirical analysis describes important strategic decision of the industry. Though the analysis concentrates on the CRO industry but the analysis is applicable for other industries’ geographical clustering analysis as well.
The paper is organized in the following way. Section 2, presents an overview of the CRO market. Section 3, describes the competitive strategy of CROs. We analyze the geographical agglomeration of CROs in Section 4 and Section 5 presents the conclusion.
2. Market Overview: The Contract Research Organization Industry
Pharmaceutical and biotechnology companies have incentives to outsource their research activities to CROs. CROs perform the job 30% more quickly [2] , because CROs specialize in Pre-clinical and clinical studies by employing specialized scientists and laboratory equipments. In addition, CROs enjoy economies of scale and scope because they perform Pre-clinical and clinical R & D services for different firms. The same job in the sponsor company’s in-house laboratory would require greater time and cost, as the firm sometime lack adequate in- house expertise. CROs are familiar with diverse regulations of different countries and can perform jobs in a different country with lower costs; this results in finishing clinical trials more quickly. Also, to improve an existing drug, it is better to outsource the job to an R & D firm who specializes in that particular drug category research. These advantages of CROs save pharmaceutical companies three to five months’ time and generate $120 to $150 million more revenue.
In 2016, outsourcing of clinical trials, including spending on discovery, pre- clinical and clinical services, is estimated to be $41 billion in the U.S., which is 8.6% of global pharmaceutical and biotechnology R & D spending. There has been a sharp rise in CRO’s market size in the U.S. over the last few years. The revenue of the CRO market has increased from $5 billion dollars to about $34 billion dollars in the last ten years [2] [21] . This is a very sharp increase in revenue for a supportive industry. The comprehensive annual growth rate of the CRO industry is around 9.8% as estimated and presented in industry reports [21] . Growing at this rate the predicted CRO revenue in 2020 will reach more than $59 billion [21] from its current revenue of $34 billion.
Both pharmaceutical and biotechnology companies do outsourcing to CROs, but the share of biotechnology firms is smaller than for the pharmaceuticals. But biotechnology firms’ share is increasing and is expected to increase in the future. The demand for CROs is increasing in all phases of drug development research. Small biotechnology and niche pharmaceutical companies are beginning to outsource all of their research projects (pre-clinical and Phases I-IV) to CROs, and they are becoming strategic partners for these companies. Large pharmaceuticals are continuing their outsourcing of various phases, and especially the later phases, to remain competitive and to meet stringent FDA regulations. CROs account for about 20% of pharmaceutical and biotechnology companies’ R & D budgets, and the world-wide spending on CROs services is also rising, as shown in Figure 1.
3. CRO’s Characteristics and Competitive Strategy
In the last eight years, the CRO market has become very competitive, resulting in a price war and lowered profit. The U.S. drug discovery CRO market has over 800 CROs. These include all kinds of CROs. Some provide Pre-clinical and clinical research services, some provide consultancy and data management services, and some specialize in clinical trial monitoring and management and patient
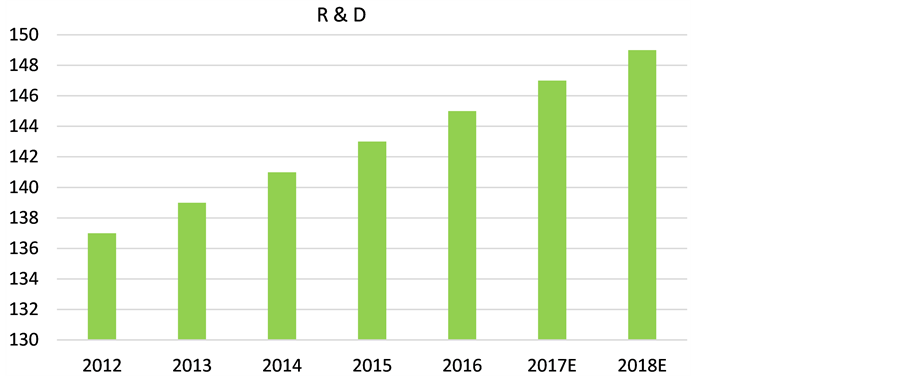
Figure 1. Increase in global pharmaceutical R & D [12] .
recruitment services. Some CROs offer combined clinical research and management services.
Depending on the market share, the CRO market can be divided into two segments, the top 11 firms with a share of 78% in 2016, and small-to-medium firms, with 22% in 2016. Though the share of large firms is decreasing due to high competition, they still dominate the field. According to their revenue and the size of their operations, we could also divide the market into three segments, large, small, and medium CROs. Firms operating in similar platforms are major competitors, and sponsor companies can switch between CROs within segments for current and future contracts. The competition fragmented CRO slows because of mergers and acquisition in the industry. Large CROs are the one-stop- shop for non-clinical, Pre-clinical testing, and Phase I-III/IV services with global reach. Midsize CROs offer multiple services with limited geographic reach, and small CROs tend to perform more specialized services. Graphical representation of three tiers makes this division clearer, as shown in Figure 2.
The trade-offs between tiers are that larger CROs offer full services from Phase I-IV plus Pre-clinical and clinical testing, but sometimes delay in services and provide less personalized services. Small CROs are not the one-stop-shops but provide greater personalized services.
3.1. Competitive Strategy
The CRO market faces restraints due to rising regulatory restrictions and ongoing mergers of pharmaceutical firms resulting project delays or cancellations that limits growth. The most important competitive factor in the CRO market is the reputation and research quality (for all three tiers). Other important factors are the speed of project completion, global capabilities and patient and staff recruiting capabilities. CROs are continuously expanding their research capacities and concentrating more on core strengths and specialized services. They utilize high level of communication technologies, improve software for data transfer and superior telecommunication techniques to maintain good communication [2] .
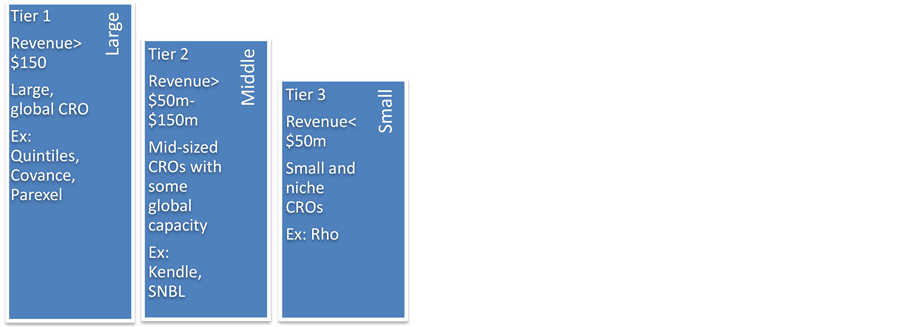
Figure 2. Three tiers of CRO [2] .
Pricing strategy of CROs affects their profitability and helps them maintain good relationship with their clients. If they charge fixed fees, they cannot overrun costs, or else they face losses. On the other hand, if they charge on the basis of time and resource spending, then client firms cannot verify actual effort and costs incurred.
3.2. Pricing Strategy
Smaller CROs tend to quote flat fees, while larger firms charge hourly rates varying from $70 to $300, thereby avoiding losses from extended project time [2] . They also build reputation from each contract, which is an incentive to complete projects on time. There are four types of contracts (Edward et al. [18] , p. 699, Table 53.7). Four types of contracts are fixed price, fee for service, fixed unit price-based, fixed unit price milestone based contracts. Fixed price contracts are contracts where fixed prices are paid for completion of the project. Price and scope of work are clearly defined up front. Sponsors prefer fixed price contract because final price is known and they pay only for the result. CROs sometime underbid and stay under pressure to deliver. CROs sometime prefer fixed fee contract because of convenience of documentation and prediction of cash flow and for budgeting efficiency. But for CROs the price quoted must be accurate in order to realize any profit. Second type of contract is the fee for service contract. Fee for service contract is an open-ended contract where the sponsor pays the bill according to hours spent on the project. This type of contract is trust and experience based and used for consultancy projects. Fee for service contracts are beneficial for CROs. In fixed unit price-based contracts, sponsor and CROs agree on definition and dimensions of task beforehand (e.g. monitoring visits, database design) and allocate price to task units. Sponsor pays according to task completion. This type of contract is easy to follow but not necessarily encourages any efficiency. Last type of contract encourages CROs to achieve pre-negotiated milestones and sponsor pays when milestones are achieved. The first, second and fourth types of contracts are more prominent for the drug discovery market. The third type of contract is more appropriate for data design and monitoring services.
The U.S. is the largest market for the pharmaceutical industry, and therefore it is expected that the CROs market is also large compared to the rest of the world. Therefore, we concentrate on the U.S. CRO markets. A study of the U.S. market helps draw conclusions about important characteristics of the CRO market.
3.3. Spatial Pattern of Contract Research Organizations
We collected data for CROs’ locations from the web directories of contract research organizations [19] [20] . We collected data for their location, age and expertise. Some firms started as producers of reagents or medical devices and later transformed into CROs. We defined their age from the time they became CROs. Many CROs perform services in addition to direct research and development. For example, some firms provide contract assistance, FDA regulatory requirements checks, auditing, managing of the CRO-pharma relationship, trial management, data management and monitoring services (project management). These firms are also listed in the directory as CROs. We select only those CROs that directly work for Pre-clinical, Phase I-IV or drug development services and not those that merely provide consulting services. CROs that only perform testing of the safety of medical instruments and/or supply raw materials to pharmaceutical companies are also eliminated from the data set. CROs working only as research firms are being selected for this analysis. This paper focuses in the research outsourcing of pharmaceutical companies. Only CROs in the U.S. have been selected. In future studies, it would be interesting to incorporate non-North American firms. In Figure 31, CROs are plotted according to their level of concentration in U.S. counties.
It is clear from Figure 3 that most counties have only one CRO. It is also interesting to note that some larger counties have only one CRO. This suggests that CROs are avoiding each other. The analysis can be repeated by considering all CROs. In Figure 4, CROs are plotted according to their zip codes to see the
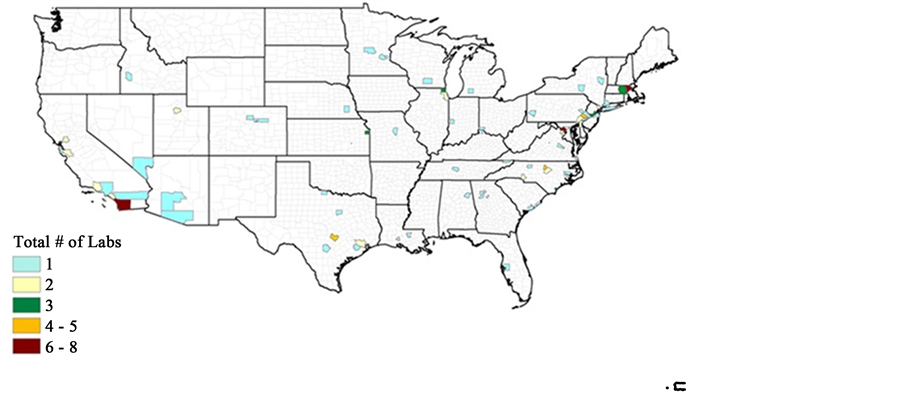
Figure 3. CRO concentration by county.
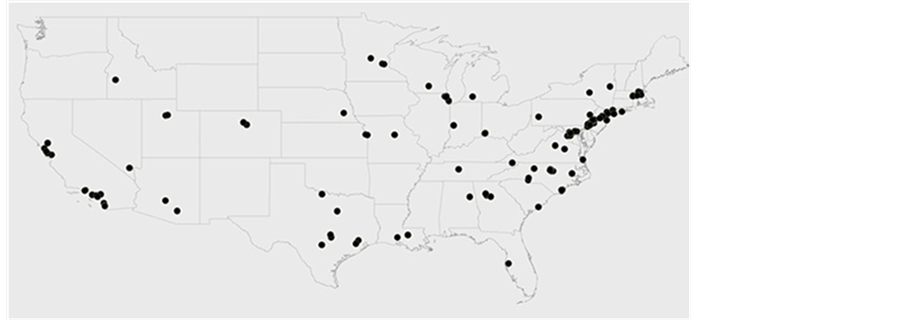
Figure 4. Clustering of CROs
clustering pattern. Figure 4 shows that CROs do not depict much clustering, except in California and the Boston areas.
4. Conclusions
CROs play an important role in the R & D of pharmaceutical industry. This paper provides an overview of the CRO industry in the U.S. and the competitive strategy of the CRO industry in terms of their geographical location selection. We provide evidence that CROs avoid geographic proximity in their location selection. We investigate the geographical proximity of CROs within U.S. counties and find that CROs are not located within the vicinity of other CROs. We find that CROs do not source knowledge from each other.
Our results suggest that the competitive strategy of U.S. CRO industry is to capture the pharmaceutical R & D market and avoid competition. Also incumbent firms block the entry of new firms and establish themselves in their current localized market. However, this is a specialized industry study and a more detailed study is needed to generalize this competitive strategy.
Cite this paper
Banerjee, T. and Nayak, A. (2017) Competition Strategy and Geographical Proximity of Contract Research Organizations. Theoretical Economics Letters, 7, 1413-1422. https://doi.org/10.4236/tel.2017.75095
References
- 1. Banerjee, T. and Siebert, R. (2017) The Impact of R & D Cooperations and Mergers in Pharmaceuticals on Research Activities and Drugs Offered on the Market. Southern Economic Journal, 84, 202-228.
https://doi.org/10.1002/soej.12221 - 2. Frost and Sullivan (2006) U.S. Drug Discovery Contract Research Organization Market.
http://www.frost.com - 3. Jaffe, A.B. (1989) Real Effects of Academic Research. American Economic Review, 79, 957-970.
- 4. Feldman, M.P. (1994) Knowledge Complementarity and Innovation. Small Business Economics, 6, 363-372.
https://doi.org/10.1007/BF01065139 - 5. Feldman, M.P. (1994) The Geography of Innovation. Kluwer Academic Publishers, Boston.
https://doi.org/10.1007/978-94-017-3333-5 - 6. D’Aspremont, C. and Jacquemin, A. (1988) Cooperative and Noncooperative R & D in Duopoly with Spillovers. American Economic Review, 78, 1133-1137.
- 7. Kamien, M., Muller, E. and Zang, I. (1992) Research Joint Ventures and R & D Cartels. American Economic Review, 82, 1293-1306.
- 8. Appold, S.J. (1991) The Location Process of Industrial Research Laboratories. The Annals of Regional Science, 25, 131-144.
https://doi.org/10.1007/BF01581891 - 9. Ellison, G. and Glaeser, E. (1997) Geographic Concentration in U.S. Manufacturing Industries: A Dartboard Approach. Journal of Political Economy, 105, 889-927.
https://doi.org/10.1086/262098 - 10. Dumais, G., Ellison, G. and Glaeser, E. (2002) Geographic Concentration as a Dynamic Process. Review of Economics and Statistics, 84, 193-204.
https://doi.org/10.1162/003465302317411479 - 11. Audretsch, D. and Feldman, M. (1996) R & D Spillovers and the Geography of Innovation and Production. American Economic Review, 86, 630-640.
- 12. Audretsch, D. and Stephen, P. (1996) Company-Scientists Locational Links: The Case of Biotechnologies. American Economic Review, 86, 641-652.
- 13. Glaeser, E. (1998) Are Cities Dying? Journal of Economic Perspectives, 12, 139-160.
https://doi.org/10.1257/jep.12.2.139 - 14. Jaffe, A., Trajtenberg, M. and Henderson, R. (1993) Geographic Localization of Knowledge Spillovers as Evidenced by Patent Citations. Quarterly Journal of Economics, 108, 577-598.
https://doi.org/10.2307/2118401 - 15. Furman, J.L., Margaret, K.K., Cockburn, I. and Henderson, R. (2006) Use Geographical Distribution of Research Activities of Pharmaceutical Firms to Investigate the Extent of Knowledge Spillover from Private and Public Institutions. Annales d’économie et de Statistique, 79-80, 165-188.
- 16. Prevenzer, M. (1997) The Dynamics of Industrial Clustering in Biotechnology. Small Business Economics, 9, 255-271.
https://doi.org/10.1023/A:1017995006003 - 17. Zucker, L., Darby, M. and Armstrong, J. (1994) Intellectual Capital and the Firm: The Technology of Geographically Localized Knowledge Spillovers. Working Paper No. 94.
https://doi.org/10.3386/w4946 - 18. Edward, D., Lionel, F.J., Andrew, F., Anthony, W. and Stonier, D.P. (2007) Principles and Practice of Pharmaceutical Medicine. 2nd Edition, John Wiley and Sons, Ltd.
https://doi.org/10.1002/9780470093153 - 19.http://biocomcro.org/cro/
- 20. http://www.drugdevelopment-technology.com/contractors/contract_research/
- 21. Zion Market Research (2005) Contract Research Organization (CRO) Market for Early-Stage Development Services and Last-Stage Development Services: Global Industry Perspective, Comprehensive Analysis and Forecast 2014-2020.
http://www.marketresearchstore.com/report/contract-research-organization-market-for-early-stage-development-services-36074 - 22. (2013) Overview of the CRO Industry.
http://www.brocair.com/pdfs/CRO_Industry_Report_8_12_2013.pdf
NOTES