 Journal of Information Security, 2012, 3, 281-294 http://dx.doi.org/10.4236/jis.2012.34035 Published Online October 2012 (http://www.SciRP.org/journal/jis) MAMNID: A Load Balance Network Diagn osi s M ode l Based on Mobile Agents Thomas Djotio Ndié1, Claude Tangha2, Guy Bertrand Fopak1 1Lirima/Masecness, University of Yaounde 1, Yaounde, Cameroon 2Lirima/Aloco, University of Yaounde 1, Yaounde, Cameroon Email: tdjotio@gmail.com, ctangha@gmail.com, fopakgb@gmail.com Received May 14, 2012; revised June 29, 2012; accepted July 16, 2012 ABSTRACT In this paper, we propose MAMNID, a mobile agent-based model for networks incidents diagnosis. It is a load-balance and resistance to attack model, based on mobile agents to mitigate the weaknesses of centralized systems like that pro- posed by Mohamed Eid which consists in gathering data to diagnose from their collecting point and sending them back to the main station for analysis. The attack of the main station stops the system and the increase of the amount of infor- mation can equally be at the origin of bottlenecks or DDoS in the network. Our model is composed of m diagnostiquors, n sniffers and a multi-agent system (MAS) of diagnosis management of which the manager is elected in a cluster. It has enabled us not only to reduce the response time and the global system load by 1/m, but also make the system more tol- erant to attacks targeting the diagnosis system. Keywords: Diagnosis; Incident; Intrusion; MAMNID; MAS 1. Introduction The popularization of new strategies of systems attacks mobilizes more researchers for the development of ade- quate defense strategies. That is how we assist today to an explosion of incident diagnosis methods in computer systems generally group into two main classes [1,2]: the behavioral-based approach and the scenario-based ap- proach. Among these methods, others are based on mo- bile agents. The first is based on the research of known intrusion signature in audit data trail. The second hy- potheses that normal activity of the system can be model- ed after its observation during a sufficient period of time or according to the instructions of the adopted security policy, and that computer attacks generate abnormal ac- tivities that are different from known normal activities. These methods give satisfaction but the increasingly high volume of information, as well as unceasingly crescent network bandwidth puts in badly these last which cannot any more give efficient result at relatively reasonable time. These reports resulted in thinking that a good or- ganization of data to be diagnosed could reduce this time. Mohamad Eid proposed a mobile agents-based distri- buted diagnosis model [3]. It consists in deploying the diagnosis system in a central point of the network. This model integrates a manager agent whose role is to create mobiles agents which are going to collect data at the local level (a network node where a sniffer captures net- work traffic) and send them to a central point for diagno- sis purpose. By analyzing this model, we wonder about the availability and response time of the central diagnosis system. Indeed, if the central system is attacked, the whole system disappears. Moreover, the increase of the number of sniffers considerably augments the load of the system and therefore its response time. That can lead to two problems: the scalability and the denial of service (DoS). Considering the importance of diagnosis system in the information availability, integrity and confidentiality, we are interested in the implementation of a network size and bandwidth independent, highly available and fast diagnosis system. Our aim in this paper is to present a load-balance diagnosis model based on mobile agents which consists of several diagnostiquors and a balance manager elected in a cluster. The rest of the paper is structured in 4 sections. In Section 2 we make a brief overview of related agent- based works in incident/intrusion diagnosis systems. Sec- tion 3 is dedicated to the presentation of our load-bal- ance diagnostic model based on mobile agents. The ana- lysis of our model is presented in Section 4 by focusing on its advantages compared to the one proposed by Mo- hamad Eid in [3]. Before concluding, we proposed in Section 5 a prototype built using Snort open source IDS and JADE (Java Agent Development Framework), to show the operational of our model. C opyright © 2012 SciRes. JIS 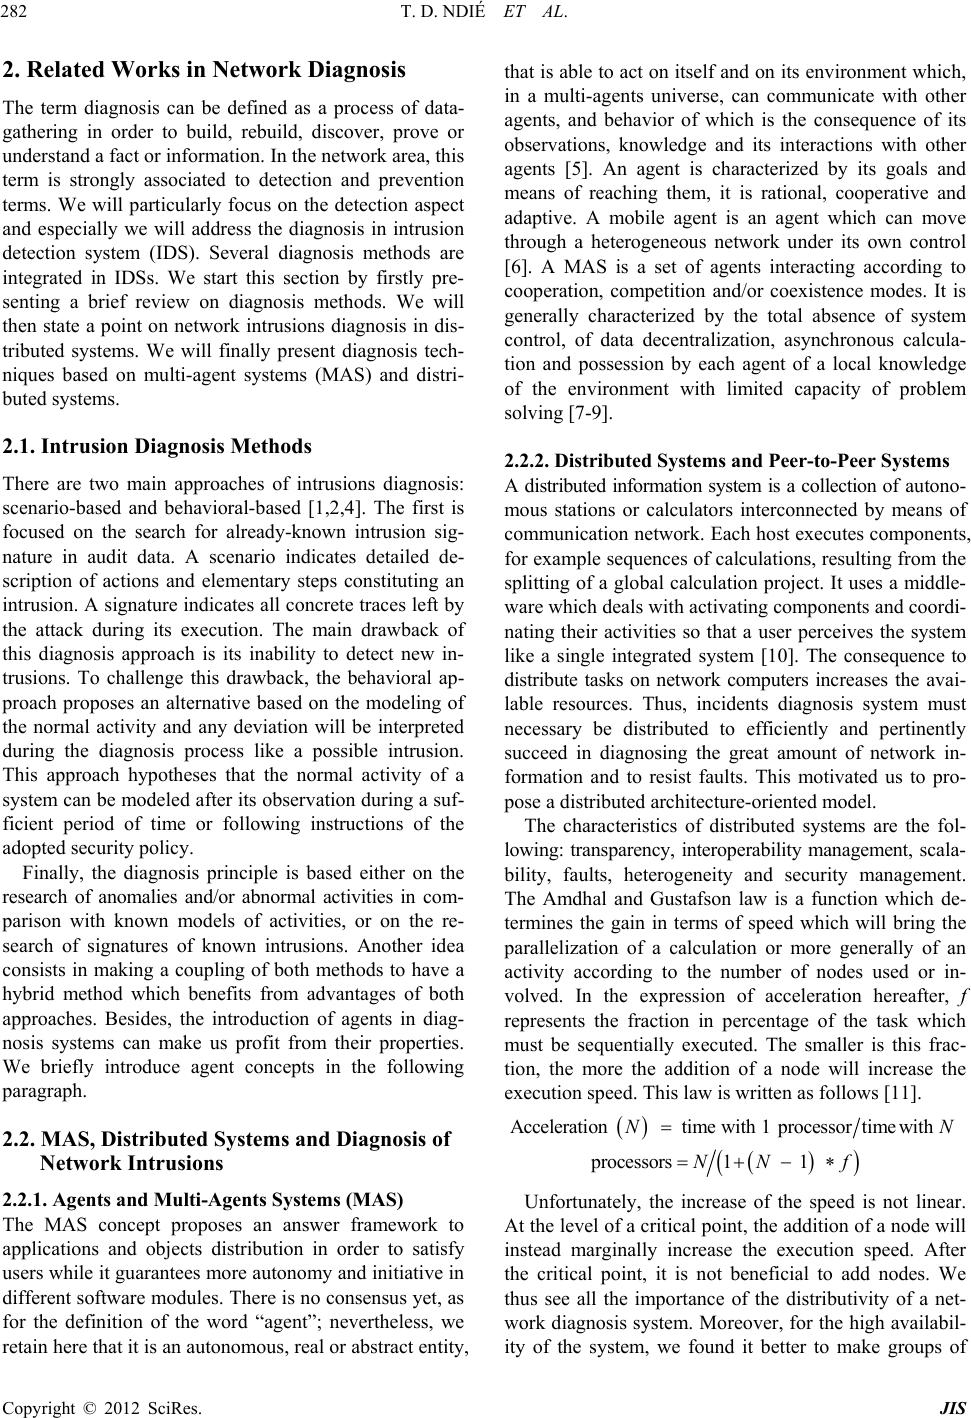 T. D. NDIÉ ET AL. 282 2. Related Works in Network Diagnosis The term diagnosis can be defined as a process of data- gathering in order to build, rebuild, discover, prove or understand a fact or information. In the network area, this term is strongly associated to detection and prevention terms. We will particularly focus on the detection aspect and especially we will address the diagnosis in intrusion detection system (IDS). Several diagnosis methods are integrated in IDSs. We start this section by firstly pre- senting a brief review on diagnosis methods. We will then state a point on network intrusions diagnosis in dis- tributed systems. We will finally present diagnosis tech- niques based on multi-agent systems (MAS) and distri- buted systems. 2.1. Intrusion Diagnosis Methods There are two main approaches of intrusions diagnosis: scenario-based and behavioral-based [1,2,4]. The first is focused on the search for already-known intrusion sig- nature in audit data. A scenario indicates detailed de- scription of actions and elementary steps constituting an intrusion. A signature indicates all concrete traces left by the attack during its execution. The main drawback of this diagnosis approach is its inability to detect new in- trusions. To challenge this drawback, the behavioral ap- proach proposes an alternative based on the modeling of the normal activity and any deviation will be interpreted during the diagnosis process like a possible intrusion. This approach hypotheses that the normal activity of a system can be modeled after its observation during a suf- ficient period of time or following instructions of the adopted security policy. Finally, the diagnosis principle is based either on the research of anomalies and/or abnormal activities in com- parison with known models of activities, or on the re- search of signatures of known intrusions. Another idea consists in making a coupling of both methods to have a hybrid method which benefits from advantages of both approaches. Besides, the introduction of agents in diag- nosis systems can make us profit from their properties. We briefly introduce agent concepts in the following paragraph. 2.2. MAS, Distributed Systems and Diagnosis of Network Intrusions 2.2.1. Agents and M u lti-Agents S ystems (MAS ) The MAS concept proposes an answer framework to applications and objects distribution in order to satisfy users while it guarantees more autonomy and initiative in different software modules. There is no consensus yet, as for the definition of the word “agent”; nevertheless, we retain here that it is an autonomous, real or abstract entity, that is able to act on itself and on its environment which, in a multi-agents universe, can communicate with other agents, and behavior of which is the consequence of its observations, knowledge and its interactions with other agents [5]. An agent is characterized by its goals and means of reaching them, it is rational, cooperative and adaptive. A mobile agent is an agent which can move through a heterogeneous network under its own control [6]. A MAS is a set of agents interacting according to cooperation, competition and/or coexistence modes. It is generally characterized by the total absence of system control, of data decentralization, asynchronous calcula- tion and possession by each agent of a local knowledge of the environment with limited capacity of problem solving [7-9]. 2.2.2. Distributed Systems and Peer-to-Peer Systems A distributed information system is a collection of autono- mous stations or calculators interconnected by means of communication network. Each host executes components, for example sequences of calculations, resulting from the splitting of a global calculation project. It uses a middle- ware which deals with activating components and coordi- nating their activities so that a user perceives the system like a single integrated system [10]. The consequence to distribute tasks on network computers increases the avai- lable resources. Thus, incidents diagnosis system must necessary be distributed to efficiently and pertinently succeed in diagnosing the great amount of network in- formation and to resist faults. This motivated us to pro- pose a distributed architecture-oriented model. The characteristics of distributed systems are the fol- lowing: transparency, interoperability management, scala- bility, faults, heterogeneity and security management. The Amdhal and Gustafson law is a function which de- termines the gain in terms of speed which will bring the parallelization of a calculation or more generally of an activity according to the number of nodes used or in- volved. In the expression of acceleration hereafter, f represents the fraction in percentage of the task which must be sequentially executed. The smaller is this frac- tion, the more the addition of a node will increase the execution speed. This law is written as follows [11]. Acceleration time with 1 processortimewith processors1 1 NN NN f Unfortunately, the increase of the speed is not linear. At the level of a critical point, the addition of a node will instead marginally increase the execution speed. After the critical point, it is not beneficial to add nodes. We thus see all the importance of the distributivity of a net- work diagnosis system. Moreover, for the high availabil- ity of the system, we found it better to make groups of Copyright © 2012 SciRes. JIS 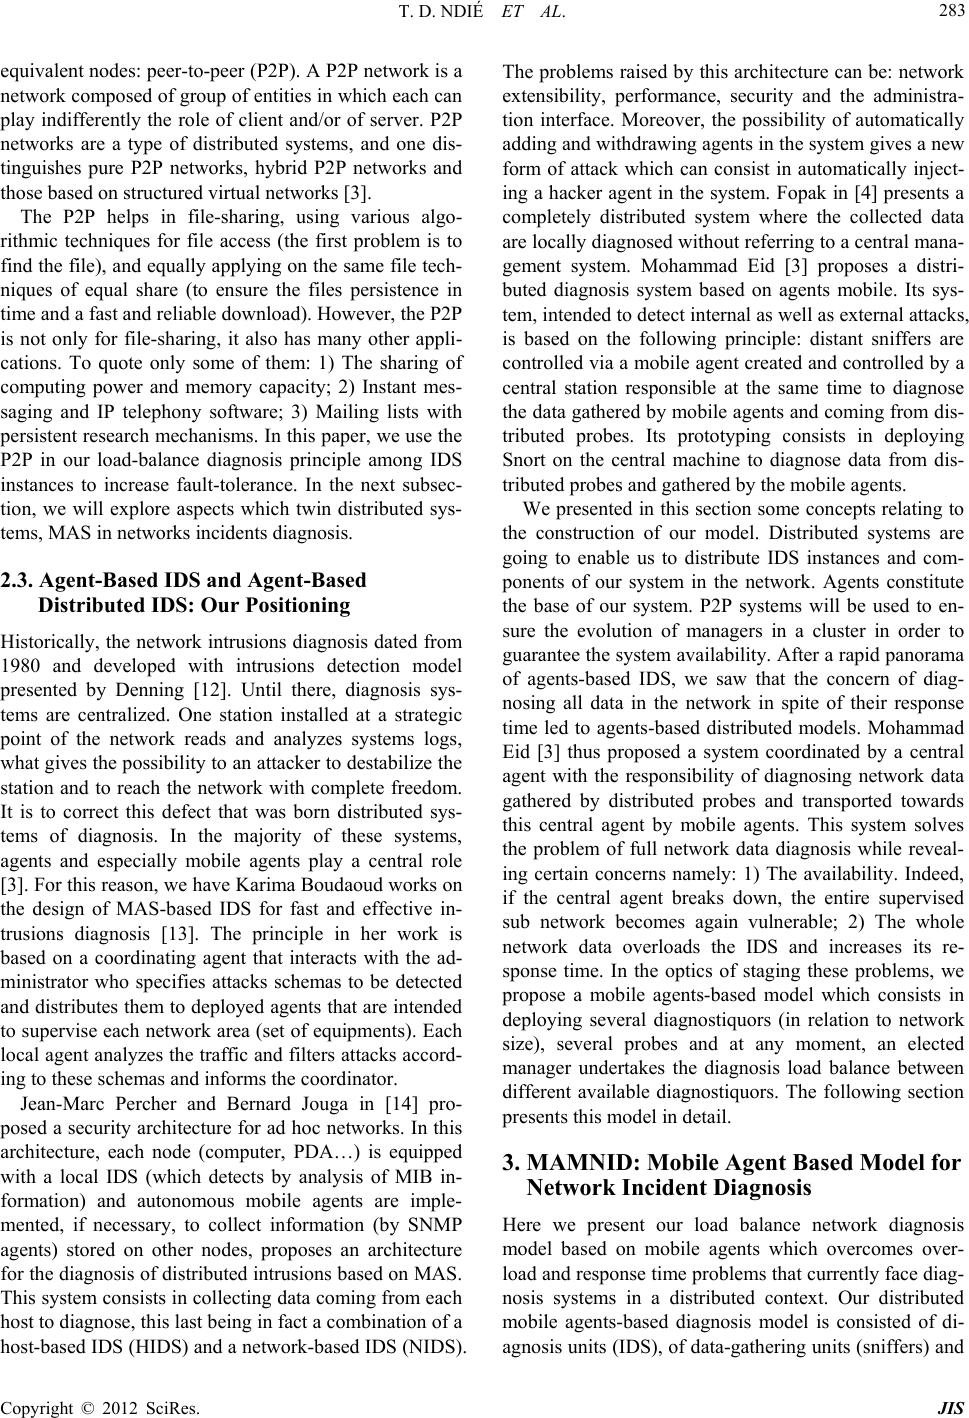 T. D. NDIÉ ET AL. 283 equivalent nodes: peer-to-peer (P2P). A P2P network is a network composed of group of entities in which each can play indifferently the role of client and/or of server. P2P networks are a type of distributed systems, and one dis- tinguishes pure P2P networks, hybrid P2P networks and those based on structured virtual networks [3]. The P2P helps in file-sharing, using various algo- rithmic techniques for file access (the first problem is to find the file), and equally applying on the same file tech- niques of equal share (to ensure the files persistence in time and a fast and reliable download). However, the P2P is not only for file-sharing, it also has many other appli- cations. To quote only some of them: 1) The sharing of computing power and memory capacity; 2) Instant mes- saging and IP telephony software; 3) Mailing lists with persistent research mechanisms. In this paper, we use the P2P in our load-balance diagnosis principle among IDS instances to increase fault-tolerance. In the next subsec- tion, we will explore aspects which twin distributed sys- tems, MAS in networks incidents diagnosis. 2.3. Agent-Based IDS and Agent-Based Distributed IDS: Our Positioning Historically, the network intrusions diagnosis dated from 1980 and developed with intrusions detection model presented by Denning [12]. Until there, diagnosis sys- tems are centralized. One station installed at a strategic point of the network reads and analyzes systems logs, what gives the possibility to an attacker to destabilize the station and to reach the network with complete freedom. It is to correct this defect that was born distributed sys- tems of diagnosis. In the majority of these systems, agents and especially mobile agents play a central role [3]. For this reason, we have Karima Boudaoud works on the design of MAS-based IDS for fast and effective in- trusions diagnosis [13]. The principle in her work is based on a coordinating agent that interacts with the ad- ministrator who specifies attacks schemas to be detected and distributes them to deployed agents that are intended to supervise each network area (set of equipments). Each local agent analyzes the traffic and filters attacks accord- ing to these schemas and informs the coordinator. Jean-Marc Percher and Bernard Jouga in [14] pro- posed a security architecture for ad hoc networks. In this architecture, each node (computer, PDA…) is equipped with a local IDS (which detects by analysis of MIB in- formation) and autonomous mobile agents are imple- mented, if necessary, to collect information (by SNMP agents) stored on other nodes, proposes an architecture for the diagnosis of distributed intrusions based on MAS. This system consists in collecting data coming from each host to diagnose, this last being in fact a combination of a host-based IDS (HIDS) and a network-based IDS (NIDS). The problems raised by this architecture can be: network extensibility, performance, security and the administra- tion interface. Moreover, the possibility of automatically adding and withdrawing agents in the system gives a new form of attack which can consist in automatically inject- ing a hacker agent in the system. Fopak in [4] presents a completely distributed system where the collected data are locally diagnosed without referring to a central mana- gement system. Mohammad Eid [3] proposes a distri- buted diagnosis system based on agents mobile. Its sys- tem, intended to detect internal as well as external attacks, is based on the following principle: distant sniffers are controlled via a mobile agent created and controlled by a central station responsible at the same time to diagnose the data gathered by mobile agents and coming from dis- tributed probes. Its prototyping consists in deploying Snort on the central machine to diagnose data from dis- tributed probes and gathered by the mobile agents. We presented in this section some concepts relating to the construction of our model. Distributed systems are going to enable us to distribute IDS instances and com- ponents of our system in the network. Agents constitute the base of our system. P2P systems will be used to en- sure the evolution of managers in a cluster in order to guarantee the system availability. After a rapid panorama of agents-based IDS, we saw that the concern of diag- nosing all data in the network in spite of their response time led to agents-based distributed models. Mohammad Eid [3] thus proposed a system coordinated by a central agent with the responsibility of diagnosing network data gathered by distributed probes and transported towards this central agent by mobile agents. This system solves the problem of full network data diagnosis while reveal- ing certain concerns namely: 1) The availability. Indeed, if the central agent breaks down, the entire supervised sub network becomes again vulnerable; 2) The whole network data overloads the IDS and increases its re- sponse time. In the optics of staging these problems, we propose a mobile agents-based model which consists in deploying several diagnostiquors (in relation to network size), several probes and at any moment, an elected manager undertakes the diagnosis load balance between different available diagnostiquors. The following section presents this model in detail. 3. MAMNID: Mobile Agent Based Model for Network Incident Diagnosis Here we present our load balance network diagnosis model based on mobile agents which overcomes over- load and response time problems that currently face diag- nosis systems in a distributed context. Our distributed mobile agents-based diagnosis model is consisted of di- agnosis units (IDS), of data-gathering units (sniffers) and Copyright © 2012 SciRes. JIS  T. D. NDIÉ ET AL. 284 a MAS for data transfer towards diagnostiquors (sen- sors). 3.1. Model Elements 3.1.1. Diagnosis Unit (DU) In our model, a diagnosis unit diagnoses the flow of data in the network. This diagnosis consists in data analysis coming from sniffers to look for attacks signatures. In case of detection, all diagnostiquors log intrusions traces in the same database in order to facilitate the administra- tion task. Let us mention that the system can have several diagnostiquors according to the network size and band- width, and of a desired response time. The DU will be for us an instance of IDS. 3.1.2. Data- G athering Unit (DGU) A data-gathering unit (DGU) is mainly made up of a sniffer whose role is to collect the traffic at its installed point to send it to the diagnosis manager (an agent) which cares of redirecting the data gathered towards the most available diagnostiquor that we will thereafter qualify. This action is ensured by a mobile agent. As for DUs, the system can have several sniffers according to the net- work size. 3.1.3. A M ultiagen t System for Data Transfer (MAS-DT) A MAS is consisted of a the MAS platform and agents in the following manner: Each participating station to the system hosts an agent platform. They are machines equipped with sniffers, diagnostiquors and machines hosting manager agents; Each machine hosting a sniffer has a sniffer agent to create a mobile agent for each data unit; The traffic manager has of a redirection agent of a mobile agent and an election agent of the manager. Let us recall that for needs for the manager security, a set of eligible agents for this role (manager) existing in a cluster; Each machine equipped with a DU has a diagnostiquor agent which gets, kills the mobile agent, and transfers received data to the UD in this case Snort IDS. 3.2. Genaral Architecture of the Model This diagram (Figure 1) shows how the information cir- culating in the network is collected and introduced into the model thanks to the sniffer (a) and how results are logged if positive match (e). The diagram equally shows how the sniffer send data to be analyzed to load balance SMA (b) and how the SMA passes data to IDS (c). The MAS is mainly made up of four agents (sniffer agent, manager agent, diagnostiquor agent and mobile agent) that are going to be described more in detail in the fol- Figure 1. Data gathering process. lowing sections. 3.2.1. De s c ription M odel Agents Here we describe agents of our MAS. Sniffer agent: this agent is in charge of requesting the load-balancer agent to get parameters of the most available diagnostiquor agent. It has a queue of data units to diagnose. After the reception of parameters of the most available diagnostiquor agent, it creates a mobile agent to convey the data unit. Characteristics of the sniffer agent are the following: its state (pa- rameter for requesting the load-balancer (IP, DNS…), a queue of data units.); its behavior (to transform the data flow sent by the sniffer into data units, to receive parameters of load-balancer agent, to request load- balancer agent for parameters of the diagnostiquor agent, to create mobile agents, to launch the mobile agent); Note: here we define the data unit as a complete in- formation bloc for a diagnostiquor (an instance of IDS); Mobile agent: this agent’s role is to transport a data unit to the most available diagnostiquor. It has the data unit ontology in its state and in its behavior; it has the possibility of initiating communication with the diagnostiquor agent to transfer to him the data unit it carries; Load-balancer agent: this agent is in charge of diag- nosis load balancing. Its characteristics include 1) Its state constituted of its parameters (IP, DNS…), active load balancer parameters (IP…), and balance man- agement queue. It is a queue (of size of diagnos- Copyright © 2012 SciRes. JIS 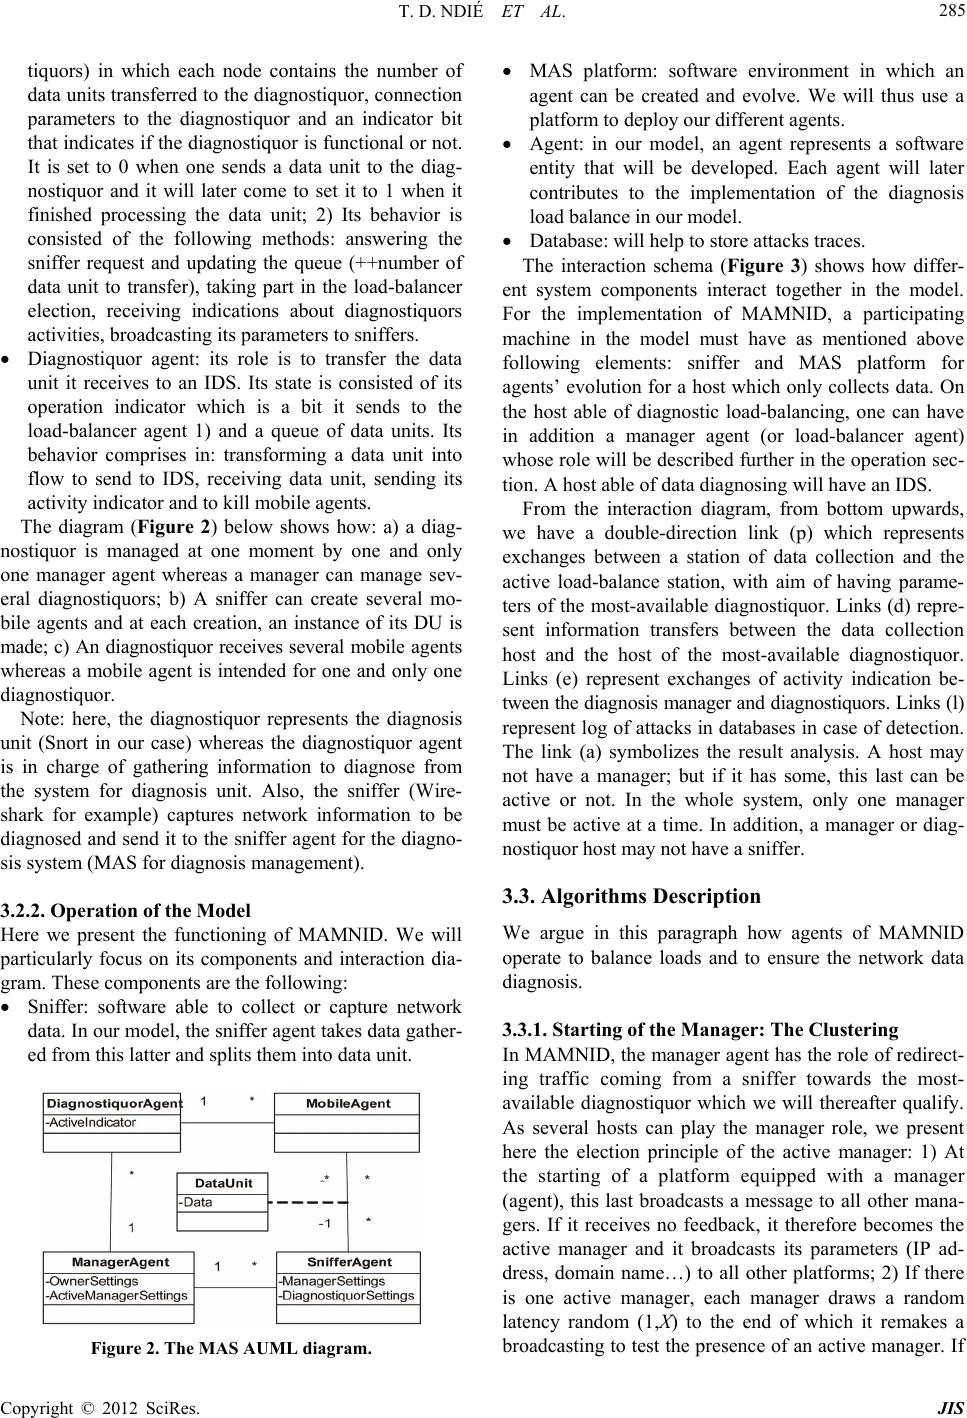 T. D. NDIÉ ET AL. 285 tiquors) in which each node contains the number of data units transferred to the diagnostiquor, connection parameters to the diagnostiquor and an indicator bit that indicates if the diagnostiquor is functional or not. It is set to 0 when one sends a data unit to the diag- nostiquor and it will later come to set it to 1 when it finished processing the data unit; 2) Its behavior is consisted of the following methods: answering the sniffer request and updating the queue (++number of data unit to transfer), taking part in the load-balancer election, receiving indications about diagnostiquors activities, broadcasting its parameters to sniffers. Diagnostiquor agent: its role is to transfer the data unit it receives to an IDS. Its state is consisted of its operation indicator which is a bit it sends to the load-balancer agent 1) and a queue of data units. Its behavior comprises in: transforming a data unit into flow to send to IDS, receiving data unit, sending its activity indicator and to kill mobile agents. The diagram (Figure 2) below shows how: a) a diag- nostiquor is managed at one moment by one and only one manager agent whereas a manager can manage sev- eral diagnostiquors; b) A sniffer can create several mo- bile agents and at each creation, an instance of its DU is made; c) An diagnostiquor receives several mobile agents whereas a mobile agent is intended for one and only one diagnostiquor. Note: here, the diagnostiquor represents the diagnosis unit (Snort in our case) whereas the diagnostiquor agent is in charge of gathering information to diagnose from the system for diagnosis unit. Also, the sniffer (Wire- shark for example) captures network information to be diagnosed and send it to the sniffer agent for the diagno- sis system (MAS for diagnosis management). 3.2.2. Ope ration of t h e Model Here we present the functioning of MAMNID. We will particularly focus on its components and interaction dia- gram. These components are the following: Sniffer: software able to collect or capture network data. In our model, the sniffer agent takes data gather- ed from this latter and splits them into data unit. Figure 2. The MAS AUML diagram. MAS platform: software environment in which an agent can be created and evolve. We will thus use a platform to deploy our different agents. Agent: in our model, an agent represents a software entity that will be developed. Each agent will later contributes to the implementation of the diagnosis load balance in our model. Database: will help to store attacks traces. The interaction schema (Figure 3) shows how differ- ent system components interact together in the model. For the implementation of MAMNID, a participating machine in the model must have as mentioned above following elements: sniffer and MAS platform for agents’ evolution for a host which only collects data. On the host able of diagnostic load-balancing, one can have in addition a manager agent (or load-balancer agent) whose role will be described further in the operation sec- tion. A host able of data diagnosing will have an IDS. From the interaction diagram, from bottom upwards, we have a double-direction link (p) which represents exchanges between a station of data collection and the active load-balance station, with aim of having parame- ters of the most-available diagnostiquor. Links (d) repre- sent information transfers between the data collection host and the host of the most-available diagnostiquor. Links (e) represent exchanges of activity indication be- tween the diagnosis manager and diagnostiquors. Links (l) represent log of attacks in databases in case of detection. The link (a) symbolizes the result analysis. A host may not have a manager; but if it has some, this last can be active or not. In the whole system, only one manager must be active at a time. In addition, a manager or diag- nostiquor host may not have a sniffer. 3.3. Algorithms Description We argue in this paragraph how agents of MAMNID operate to balance loads and to ensure the network data diagnosis. 3.3.1. Starting of the Manager: The Clustering In MAMNID, the manager agent has the role of redirect- ing traffic coming from a sniffer towards the most- available diagnostiquor which we will thereafter qualify. As several hosts can play the manager role, we present here the election principle of the active manager: 1) At the starting of a platform equipped with a manager (agent), this last broadcasts a message to all other mana- gers. If it receives no feedback, it therefore becomes the active manager and it broadcasts its parameters (IP ad- dress, domain name…) to all other platforms; 2) If there is one active manager, each manager draws a random latency random (1,X) to the end of which it remakes a broadcasting to test the presence of an active manager. If Copyright © 2012 SciRes. JIS 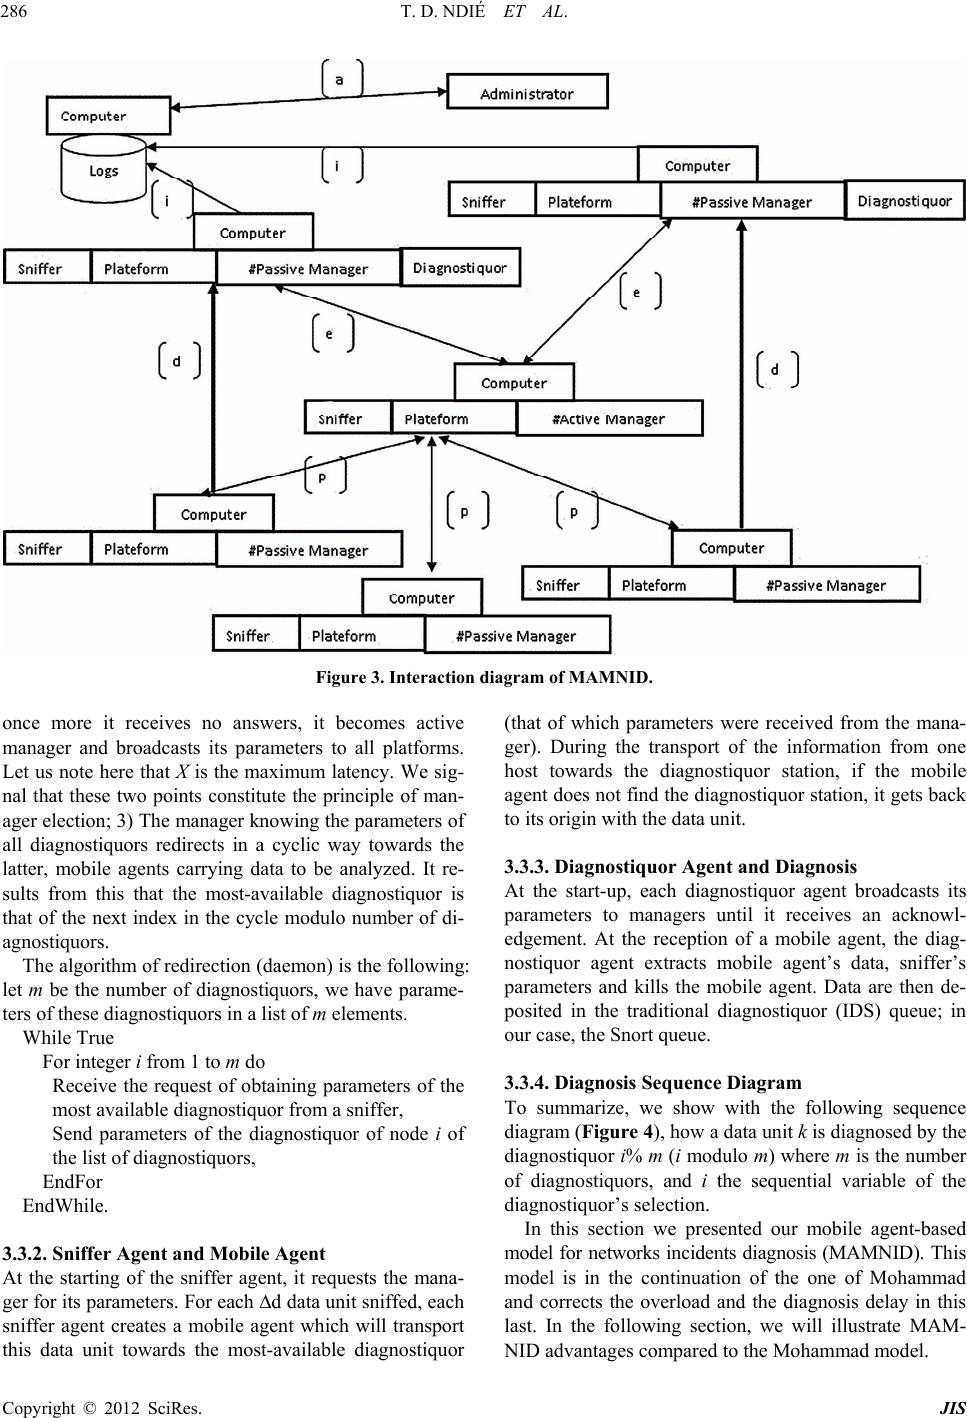 T. D. NDIÉ ET AL. Copyright © 2012 SciRes. JIS 286 Figure 3. Interaction diagram of MAMNID. once more it receives no answers, it becomes active manager and broadcasts its parameters to all platforms. Let us note here that X is the maximum latency. We sig- nal that these two points constitute the principle of man- ager election; 3) The manager knowing the parameters of all diagnostiquors redirects in a cyclic way towards the latter, mobile agents carrying data to be analyzed. It re- sults from this that the most-available diagnostiquor is that of the next index in the cycle modulo number of di- agnostiquors. The algorithm of redirection (daemon) is the following: let m be the number of diagnostiquors, we have parame- ters of these diagnostiquors in a list of m elements. While True For integer i from 1 to m do Receive the request of obtaining parameters of the most available diagnostiquor from a sniffer, Send parameters of the diagnostiquor of node i of the list of diagnostiquors, EndFor EndWhile. 3.3.2. Sni ffer Agent a nd Mobile Agent At the starting of the sniffer agent, it requests the mana- ger for its parameters. For each ∆d data unit sniffed, each sniffer agent creates a mobile agent which will transport this data unit towards the most-available diagnostiquor (that of which parameters were received from the mana- ger). During the transport of the information from one host towards the diagnostiquor station, if the mobile agent does not find the diagnostiquor station, it gets back to its origin with the data unit. 3.3.3. Diagn ostiquor Agent and Di ag nosi s At the start-up, each diagnostiquor agent broadcasts its parameters to managers until it receives an acknowl- edgement. At the reception of a mobile agent, the diag- nostiquor agent extracts mobile agent’s data, sniffer’s parameters and kills the mobile agent. Data are then de- posited in the traditional diagnostiquor (IDS) queue; in our case, the Snort queue. 3.3.4. Diagnosis Sequence Diagram To summarize, we show with the following sequence diagram (Figure 4), how a data unit k is diagnosed by the diagnostiquor i% m (i modulo m) where m is the number of diagnostiquors, and i the sequential variable of the diagnostiquor’s selection. In this section we presented our mobile agent-based model for networks incidents diagnosis (MAMNID). This model is in the continuation of the one of Mohammad and corrects the overload and the diagnosis delay in this last. In the following section, we will illustrate MAM- NID advantages compared to the Mohammad model. 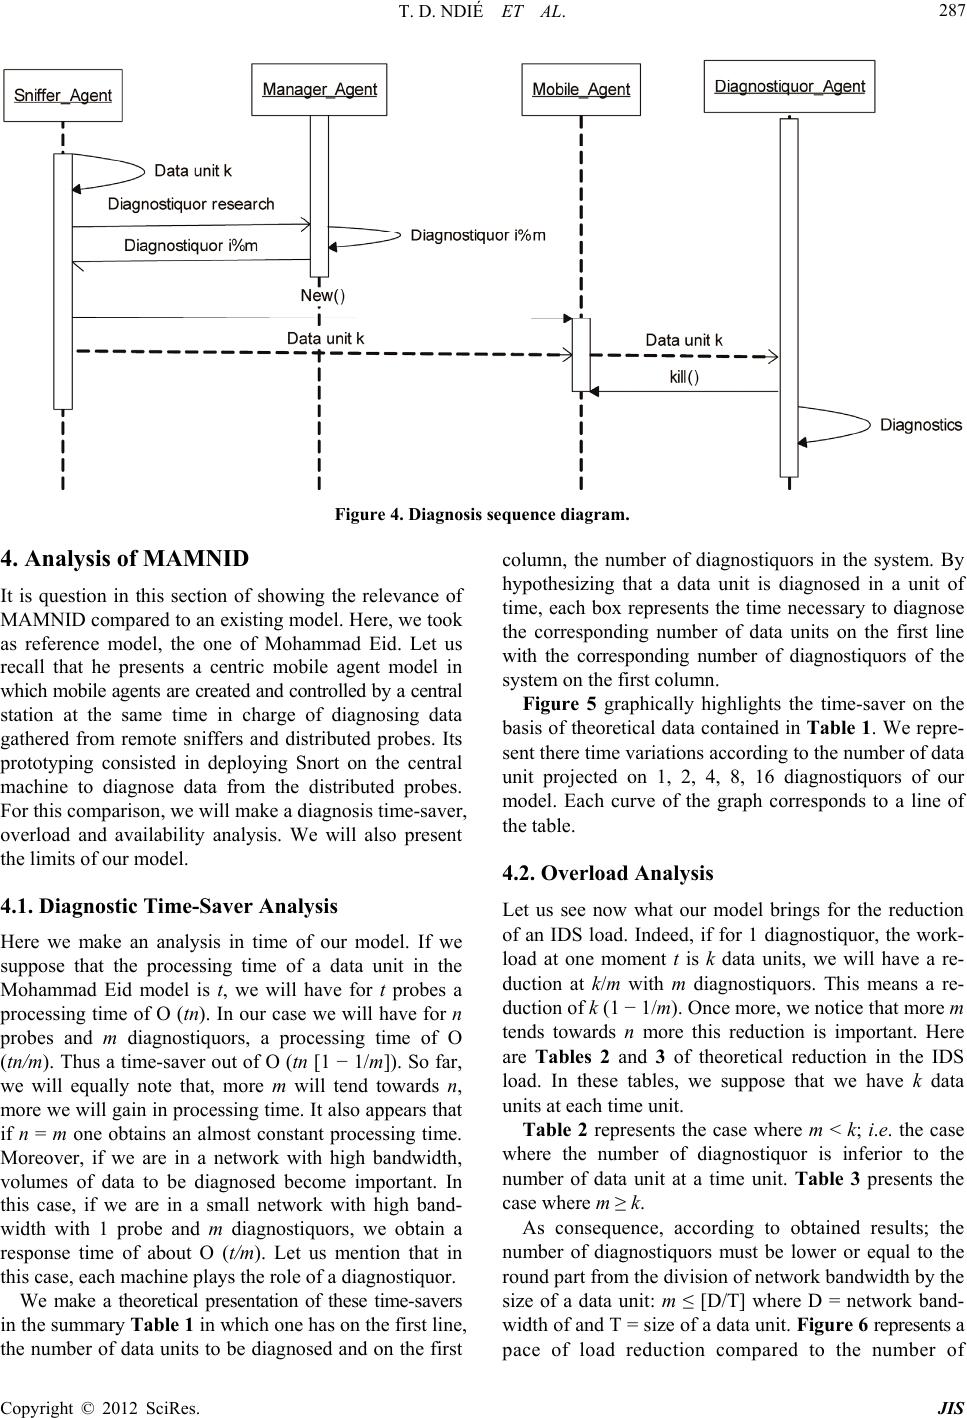 T. D. NDIÉ ET AL. 287 Figure 4. Diagnosis sequence diagram. 4. Analysis of MAMNID It is question in this section of showing the relevance of MAMNID compared to an existing model. Here, we took as reference model, the one of Mohammad Eid. Let us recall that he presents a centric mobile agent model in which mobile agents are created and controlled by a central station at the same time in charge of diagnosing data gathered from remote sniffers and distributed probes. Its prototyping consisted in deploying Snort on the central machine to diagnose data from the distributed probes. For this comparison, we will make a diagnosis time-saver, overload and availability analysis. We will also present the limits of our model. 4.1. Diagnostic Time-Saver Analysis Here we make an analysis in time of our model. If we suppose that the processing time of a data unit in the Mohammad Eid model is t, we will have for t probes a processing time of O (tn). In our case we will have for n probes and m diagnostiquors, a processing time of O (tn/m). Thus a time-saver out of O (tn [1 − 1/m]). So far, we will equally note that, more m will tend towards n, more we will gain in processing time. It also appears that if n = m one obtains an almost constant processing time. Moreover, if we are in a network with high bandwidth, volumes of data to be diagnosed become important. In this case, if we are in a small network with high band- width with 1 probe and m diagnostiquors, we obtain a response time of about O (t/m). Let us mention that in this case, each machine plays the role of a diagnostiquor. We make a theoretical presentation of these time-savers in the summary Table 1 in which one has on the first line, the number of data units to be diagnosed and on the first column, the number of diagnostiquors in the system. By hypothesizing that a data unit is diagnosed in a unit of time, each box represents the time necessary to diagnose the corresponding number of data units on the first line with the corresponding number of diagnostiquors of the system on the first column. Figure 5 graphically highlights the time-saver on the basis of theoretical data contained in Table 1. We repre- sent there time variations according to the number of data unit projected on 1, 2, 4, 8, 16 diagnostiquors of our model. Each curve of the graph corresponds to a line of the table. 4.2. Overload Analysis Let us see now what our model brings for the reduction of an IDS load. Indeed, if for 1 diagnostiquor, the work- load at one moment t is k data units, we will have a re- duction at k/m with m diagnostiquors. This means a re- duction of k (1 − 1/m). Once more, we notice that more m tends towards n more this reduction is important. Here are Tables 2 and 3 of theoretical reduction in the IDS load. In these tables, we suppose that we have k data units at each time unit. Table 2 represents the case where m < k; i.e. the case where the number of diagnostiquor is inferior to the number of data unit at a time unit. Table 3 presents the case where m ≥ k. As consequence, according to obtained results; the number of diagnostiquors must be lower or equal to the round part from the division of network bandwidth by the size of a data unit: m ≤ [D/T] where D = network band- width of and T = size of a data unit. Figure 6 represents a pace of load reduction compared to the number of Copyright © 2012 SciRes. JIS 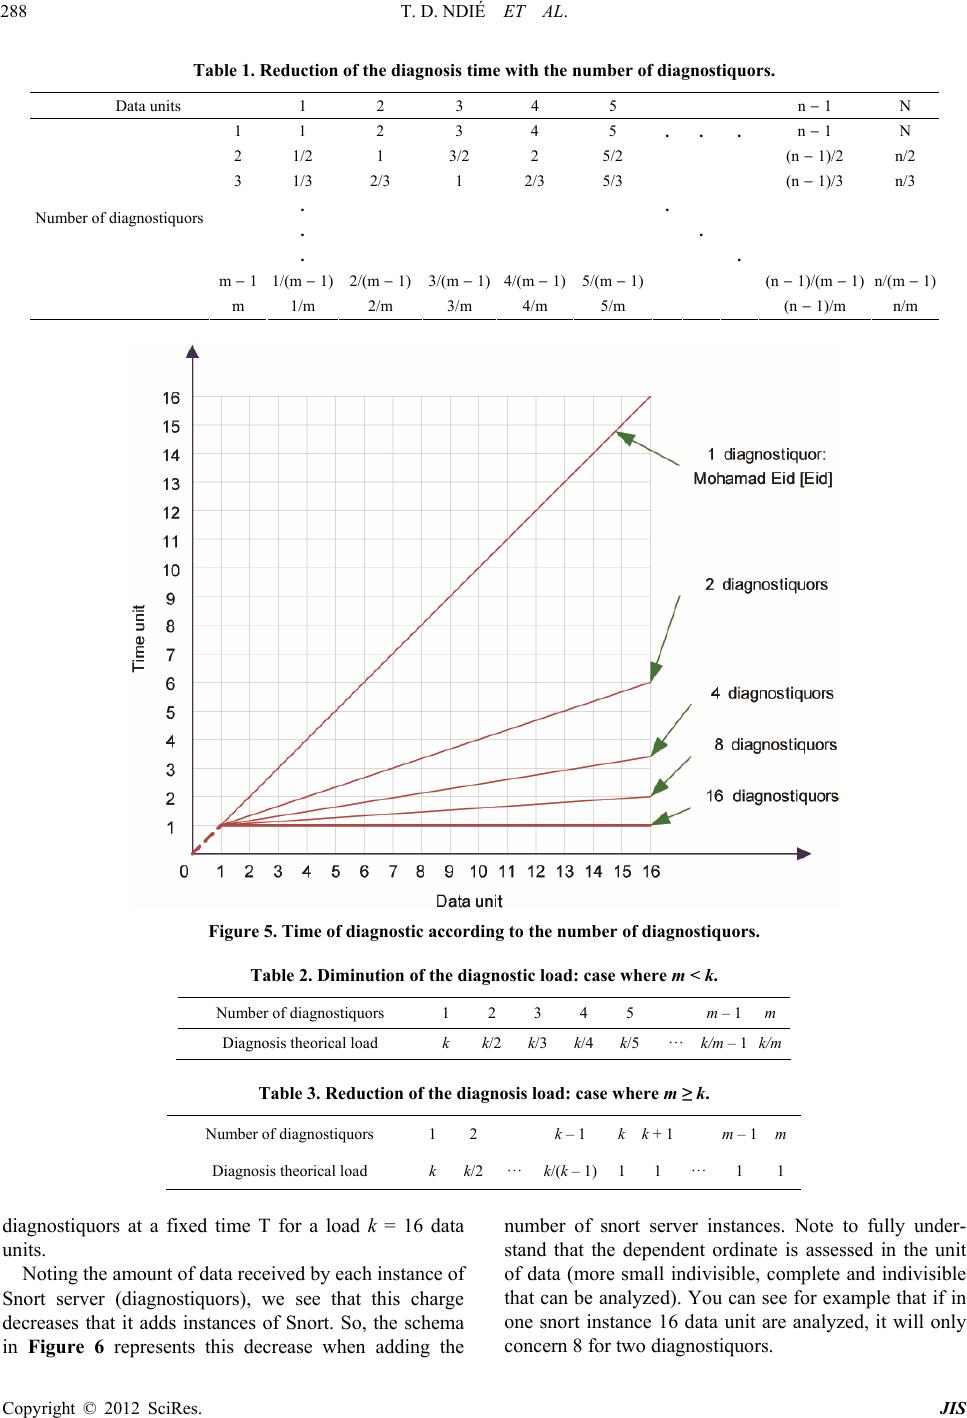 T. D. NDIÉ ET AL. 288 Table 1. Reduction of the diagnosis time with the number of diagnostiquors. Data units 1 2 3 4 5 n – 1 N 1 1 2 3 4 5 .. . n – 1 N 2 1/2 1 3/2 2 5/2 (n – 1)/2 n/2 3 1/3 2/3 1 2/3 5/3 (n – 1)/3 n/3 . . . . . . m – 1 1/(m – 1) 2/(m – 1) 3/(m – 1) 4/(m – 1) 5/(m – 1) (n – 1)/(m – 1) n/(m – 1) Number of diagnostiquors m 1/m 2/m 3/m 4/m 5/m (n – 1)/m n/m Figure 5. Time of diagnostic according to the number of diagnostiquors. Table 2. Diminution of the diagnostic load: case where m < k. Number of diagnostiquors 1 2 3 4 5 m – 1 m Diagnosis theorical load k k/2 k/3 k/4 k/5··· k/m – 1 k/m Table 3. Reduction of the diagnosis load: case where m ≥ k. Number of diagnostiquors 1 2 k – 1 kk + 1 m – 1 m Diagnosis theorical load k k/2··· k/(k – 1)11 ···1 1 diagnostiquors at a fixed time T for a load k = 16 data units. Noting the amount of data received by each instance of Snort server (diagnostiquors), we see that this charge decreases that it adds instances of Snort. So, the schema in Figure 6 represents this decrease when adding the number of snort server instances. Note to fully under- stand that the dependent ordinate is assessed in the unit of data (more small indivisible, complete and indivisible that can be analyzed). You can see for example that if in one snort instance 16 data unit are analyzed, it will only concern 8 for two diagnostiquors. Copyright © 2012 SciRes. JIS 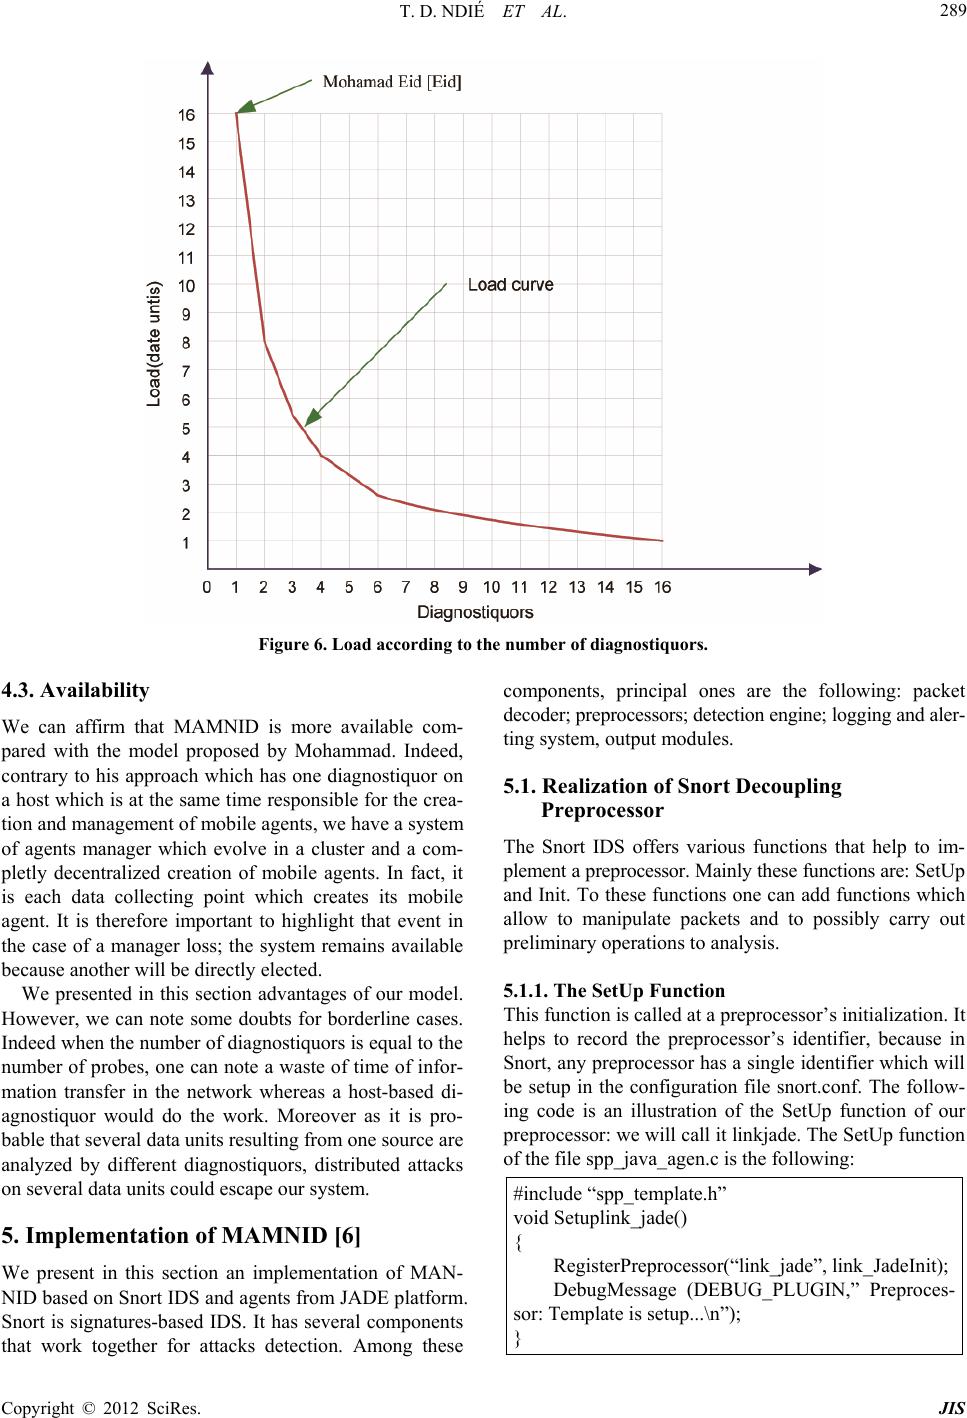 T. D. NDIÉ ET AL. 289 Figure 6. Load according to the number of diagnostiquors. 4.3. Availability We can affirm that MAMNID is more available com- pared with the model proposed by Mohammad. Indeed, contrary to his approach which has one diagnostiquor on a host which is at the same time responsible for the crea- tion and management of mobile agents, we have a system of agents manager which evolve in a cluster and a com- pletly decentralized creation of mobile agents. In fact, it is each data collecting point which creates its mobile agent. It is therefore important to highlight that event in the case of a manager loss; the system remains available because another will be directly elected. We presented in this section advantages of our model. However, we can note some doubts for borderline cases. Indeed when the number of diagnostiquors is equal to the number of probes, one can note a waste of time of infor- mation transfer in the network whereas a host-based di- agnostiquor would do the work. Moreover as it is pro- bable that several data units resulting from one source are analyzed by different diagnostiquors, distributed attacks on several data units could escape our system. 5. Implementation of MAMNID [6] We present in this section an implementation of MAN- NID based on Snort IDS and agents from JADE platform. Snort is signatures-based IDS. It has several components that work together for attacks detection. Among these components, principal ones are the following: packet decoder; preprocessors; detection engine; logging and aler- ting system, output modules. 5.1. Realization of Snort Decoupling Preprocessor The Snort IDS offers various functions that help to im- plement a preprocessor. Mainly these functions are: SetUp and Init. To these functions one can add functions which allow to manipulate packets and to possibly carry out preliminary operations to analysis. 5.1.1. The SetUp Function This function is called at a preprocessor’s initialization. It helps to record the preprocessor’s identifier, because in Snort, any preprocessor has a single identifier which will be setup in the configuration file snort.conf. The follow- ing code is an illustration of the SetUp function of our preprocessor: we will call it linkjade. The SetUp function of the file spp_java_agen.c is the following: #include “spp_template.h” void Setuplink_jade() { RegisterPreprocessor(“link_jade”, link_JadeInit); DebugMessage (DEBUG_PLUGIN,” Preproces- sor: Template is setup...\n”); } Copyright © 2012 SciRes. JIS 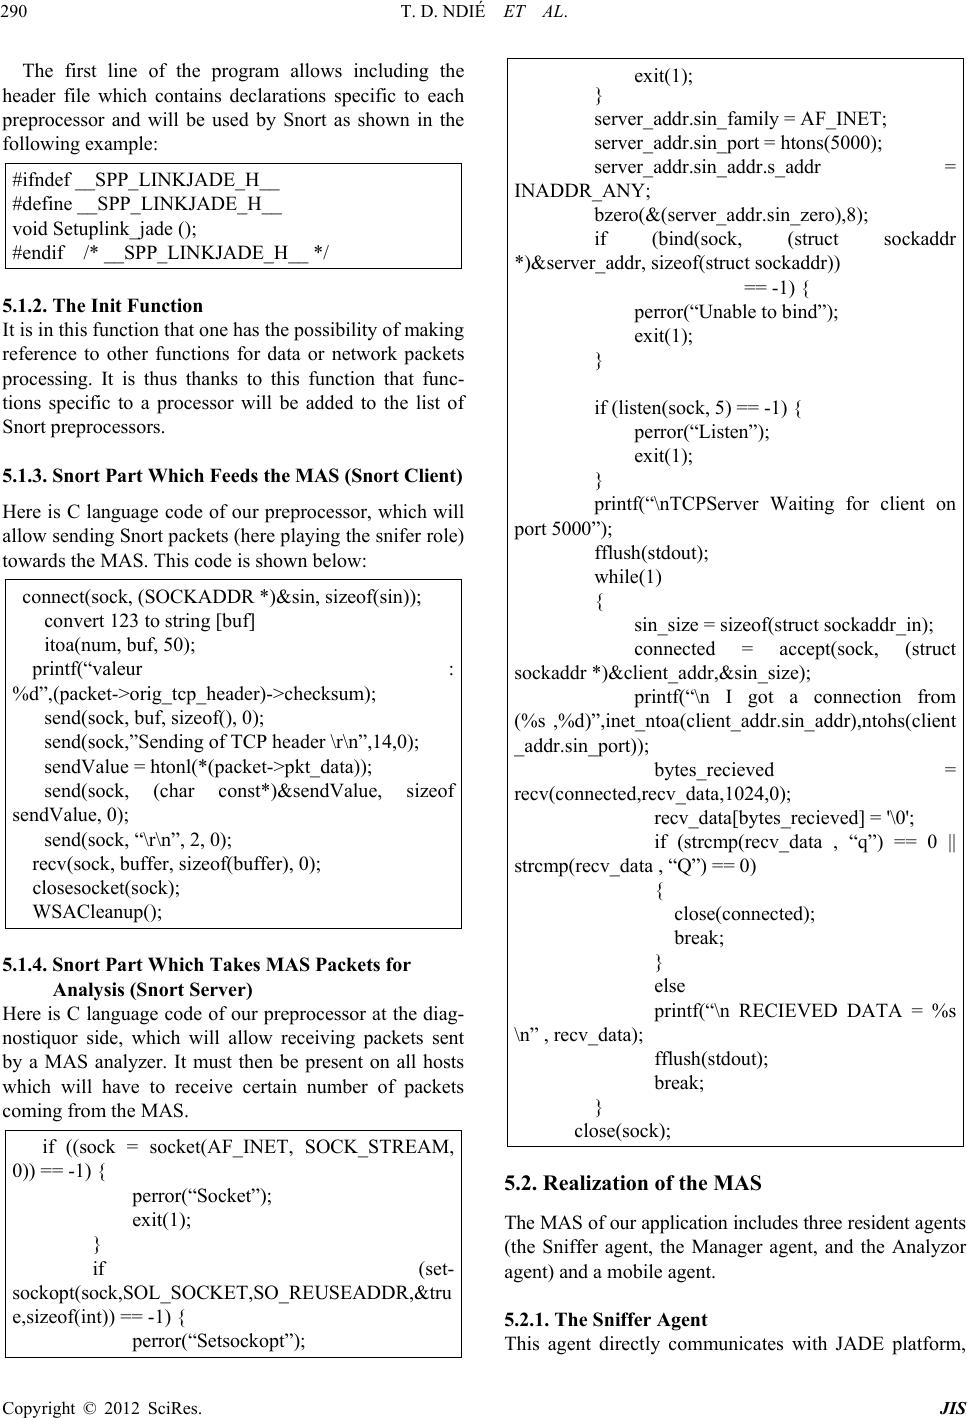 T. D. NDIÉ ET AL. 290 The first line of the program allows including the header file which contains declarations specific to each preprocessor and will be used by Snort as shown in the following example: #ifndef __SPP_LINKJADE_H__ #define __SPP_LINKJADE_H__ void Setuplink_jade (); #endif /* __SPP_LINKJADE_H__ */ 5.1.2. The Init Function It is in this function that one has the possibility of making reference to other functions for data or network packets processing. It is thus thanks to this function that func- tions specific to a processor will be added to the list of Snort preprocessors. 5.1.3. Snort Part Which Feeds the MAS (Snort Client) Here is C language code of our preprocessor, which will allow sending Snort packets (here playing the snifer role) towards the MAS. This code is shown below: connect(sock, (SOCKADDR *)&sin, sizeof(sin)); convert 123 to string [buf] itoa(num, buf, 50); printf(“valeur : %d”,(packet->orig_tcp_header)->checksum); send(sock, buf, sizeof(), 0); send(sock,”Sending of TCP header \r\n”,14,0); sendValue = htonl(*(packet->pkt_data)); send(sock, (char const*)&sendValue, sizeof sendValue, 0); send(sock, “\r\n”, 2, 0); recv(sock, buffer, sizeof(buffer), 0); closesocket(sock); WSACleanup(); 5.1.4. Snort Part Which Takes MAS Packets for Analysis (Snort Server) Here is C language code of our preprocessor at the diag- nostiquor side, which will allow receiving packets sent by a MAS analyzer. It must then be present on all hosts which will have to receive certain number of packets coming from the MAS. if ((sock = socket(AF_INET, SOCK_STREAM, 0)) == -1) { perror(“Socket”); exit(1); } if (set- sockopt(sock,SOL_SOCKET,SO_REUSEADDR,&tru e,sizeof(int)) == -1) { perror(“Setsockopt”); exit(1); } server_addr.sin_family = AF_INET; server_addr.sin_port = htons(5000); server_addr.sin_addr.s_addr = INADDR_ANY; bzero(&(server_addr.sin_zero),8); if (bind(sock, (struct sockaddr *)&server_addr, sizeof(struct sockaddr)) == -1) { perror(“Unable to bind”); exit(1); } if (listen(sock, 5) == -1) { perror(“Listen”); exit(1); } printf(“\nTCPServer Waiting for client on port 5000”); fflush(stdout); while(1) { sin_size = sizeof(struct sockaddr_in); connected = accept(sock, (struct sockaddr *)&client_addr,&sin_size); printf(“\n I got a connection from (%s ,%d)”,inet_ntoa(client_addr.sin_addr),ntohs(client _addr.sin_port)); bytes_recieved = recv(connected,recv_data,1024,0); recv_data[bytes_recieved] = '\0'; if (strcmp(recv_data , “q”) == 0 || strcmp(recv_data , “Q”) == 0) { close(connected); break; } else printf(“\n RECIEVED DATA = %s \n” , recv_data); fflush(stdout); break; } close(sock); 5.2. Realization of the MAS The MAS of our application includes three resident agents (the Sniffer agent, the Manager agent, and the Analyzor agent) and a mobile agent. 5.2.1. The Sniffer Agent This agent directly communicates with JADE platform, Copyright © 2012 SciRes. JIS 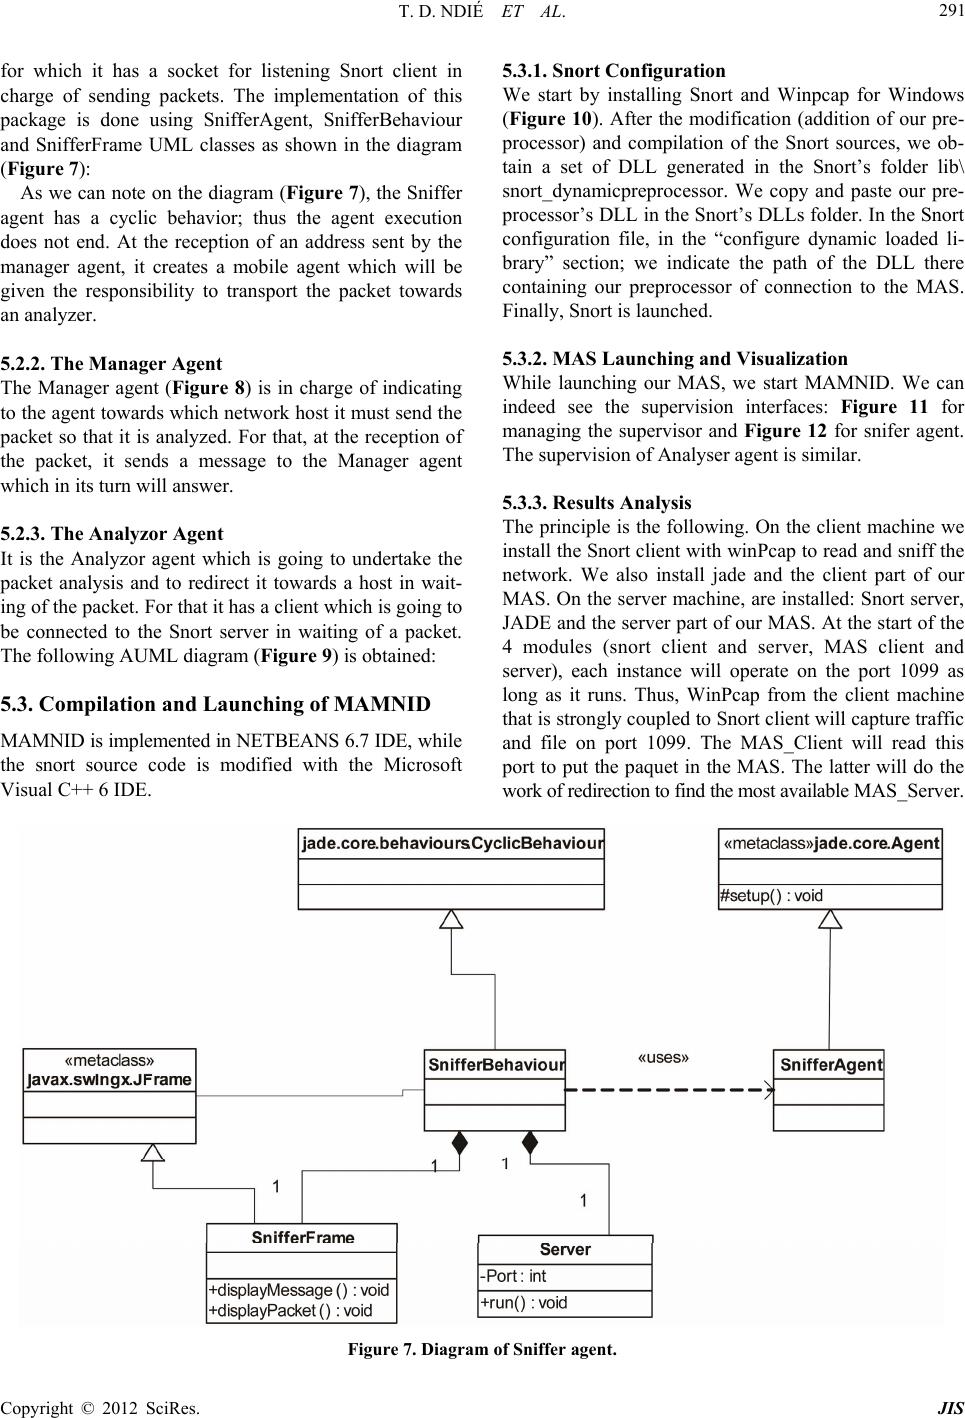 T. D. NDIÉ ET AL. Copyright © 2012 SciRes. JIS 291 5.3.1. Snort Configu ration for which it has a socket for listening Snort client in charge of sending packets. The implementation of this package is done using SnifferAgent, SnifferBehaviour and SnifferFrame UML classes as shown in the diagram (Figure 7): We start by installing Snort and Winpcap for Windows (Figure 10). After the modification (addition of our pre- processor) and compilation of the Snort sources, we ob- tain a set of DLL generated in the Snort’s folder lib\ snort_dynamicpreprocessor. We copy and paste our pre- processor’s DLL in the Snort’s DLLs folder. In the Snort configuration file, in the “configure dynamic loaded li- brary” section; we indicate the path of the DLL there containing our preprocessor of connection to the MAS. Finally, Snort is launched. As we can note on the diagram (Figure 7), the Sniffer agent has a cyclic behavior; thus the agent execution does not end. At the reception of an address sent by the manager agent, it creates a mobile agent which will be given the responsibility to transport the packet towards an analyzer. 5.3.2. M AS Launchin g a nd Visualization 5.2.2. T he M anager Age n t While launching our MAS, we start MAMNID. We can indeed see the supervision interfaces: Figure 11 for managing the supervisor and Figure 12 for snifer agent. The supervision of Analyser agent is similar. The Manager agent (Figure 8) is in charge of indicating to the agent towards which network host it must send the packet so that it is analyzed. For that, at the reception of the packet, it sends a message to the Manager agent which in its turn will answer. 5.3.3. Results Analys i s The principle is the following. On the client machine we install the Snort client with winPcap to read and sniff the network. We also install jade and the client part of our MAS. On the server machine, are installed: Snort server, JADE and the server part of our MAS. At the start of the 4 modules (snort client and server, MAS client and server), each instance will operate on the port 1099 as long as it runs. Thus, WinPcap from the client machine that is strongly coupled to Snort client will capture traffic and file on port 1099. The MAS_Client will read this port to put the paquet in the MAS. The latter will do the work of redirection to find the most available MAS_Server. 5.2.3. Th e Analyzor Agent It is the Analyzor agent which is going to undertake the packet analysis and to redirect it towards a host in wait- ing of the packet. For that it has a client which is going to be connected to the Snort server in waiting of a packet. The following AUML diagram (Figure 9) is obtained: 5.3. Compilation and Launching of MAMNID MAMNID is implemented in NETBEANS 6.7 IDE, while the snort source code is modified with the Microsoft Visual C++ 6 IDE. Figure 7. Diagram of Sniffer agent. 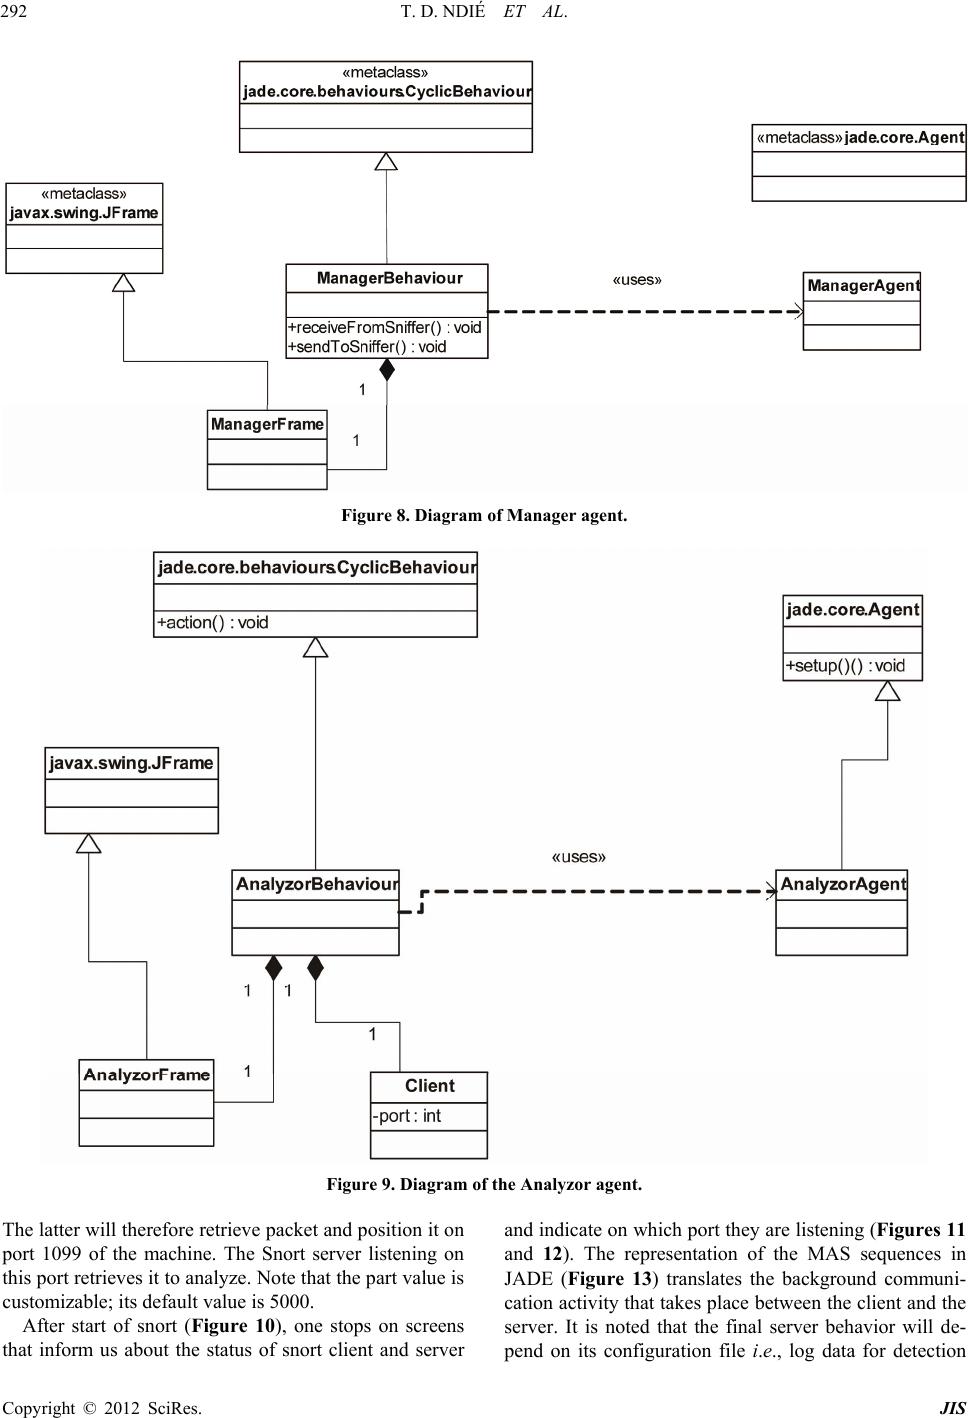 T. D. NDIÉ ET AL. 292 Figure 8. Diagram of Manager agent. Figure 9. Diagram of the Analyzor agent. The latter will therefore retrieve packet and position it on port 1099 of the machine. The Snort server listening on this port retrieves it to analyze. Note that the part value is customizable; its default value is 5000. After start of snort (Figure 10), one stops on screens that inform us about the status of snort client and server and indicate on which port they are listening (Figures 11 and 12). The representation of the MAS sequences in JADE (Figure 13) translates the background communi- cation activity that takes place between the client and the server. It is noted that the final server behavior will de- pend on its configuration file i.e., log data for detection Copyright © 2012 SciRes. JIS 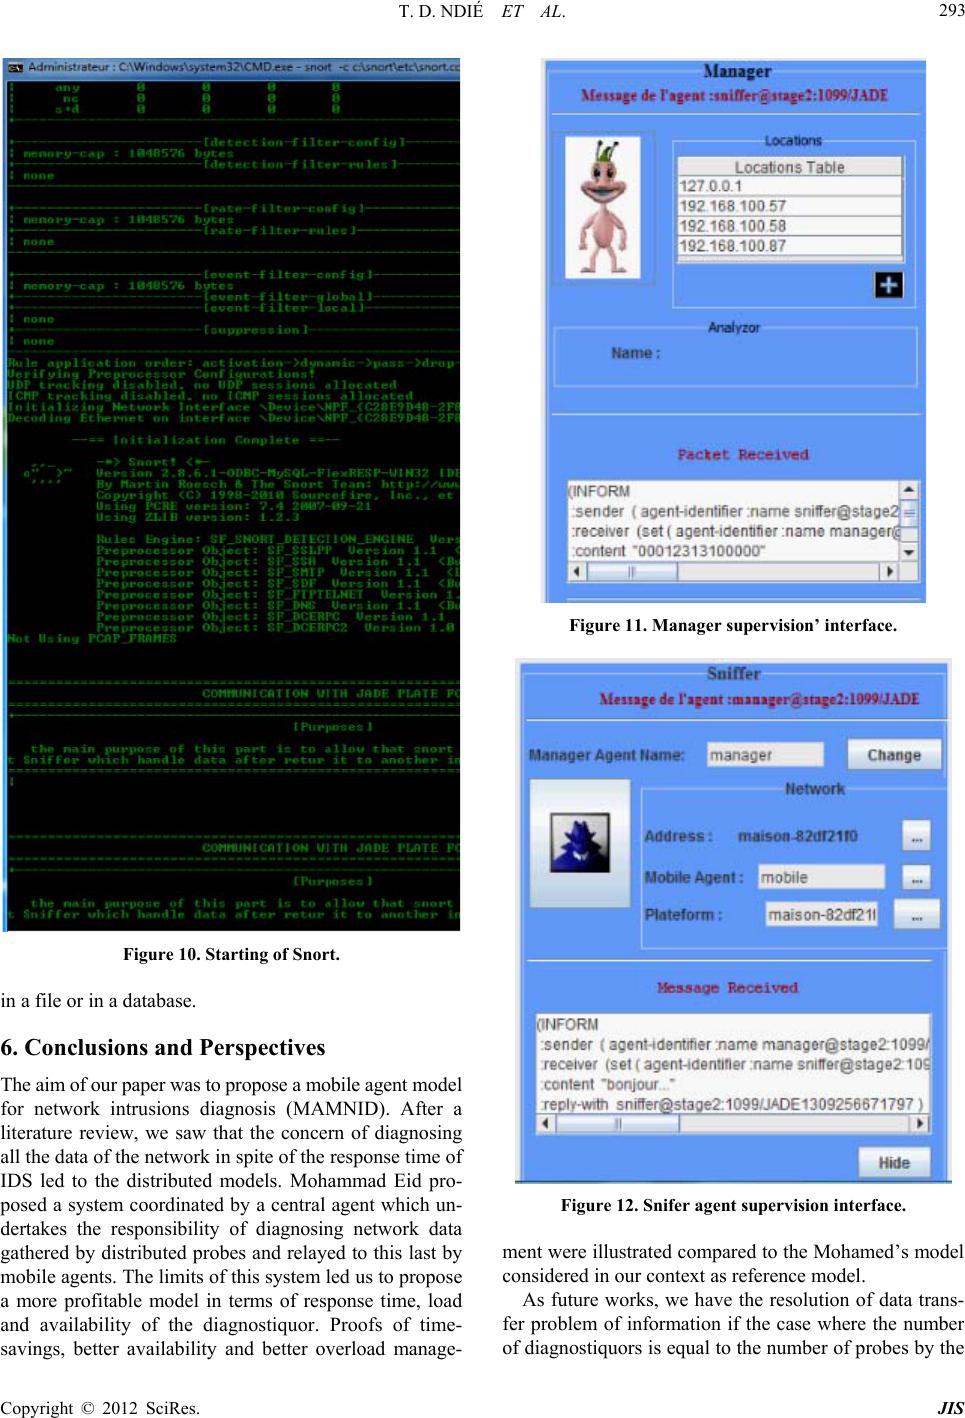 T. D. NDIÉ ET AL. 293 Figure 10. Starting of Snort. in a file or in a database. 6. Conclusions and Perspectives The aim of our paper was to propose a mobile agent model for network intrusions diagnosis (MAMNID). After a literature review, we saw that the concern of diagnosing all the data of the network in spite of the response time of IDS led to the distributed models. Mohammad Eid pro- posed a system coordinated by a central agent which un- dertakes the responsibility of diagnosing network data gathered by distributed probes and relayed to this last by mobile agents. The limits of this system led us to propose a more profitable model in terms of response time, load and availability of the diagnostiquor. Proofs of time- savings, better availability and better overload manage- Figure 11. Manager supervision’ interface. Figure 12. Snifer agent supervision interface. ment were illustrated compared to the Mohamed’s model considered in our context as reference model. As future works, we have the resolution of data trans- fer problem of information if the case where the number of diagnostiquors is equal to the number of probes by the Copyright © 2012 SciRes. JIS 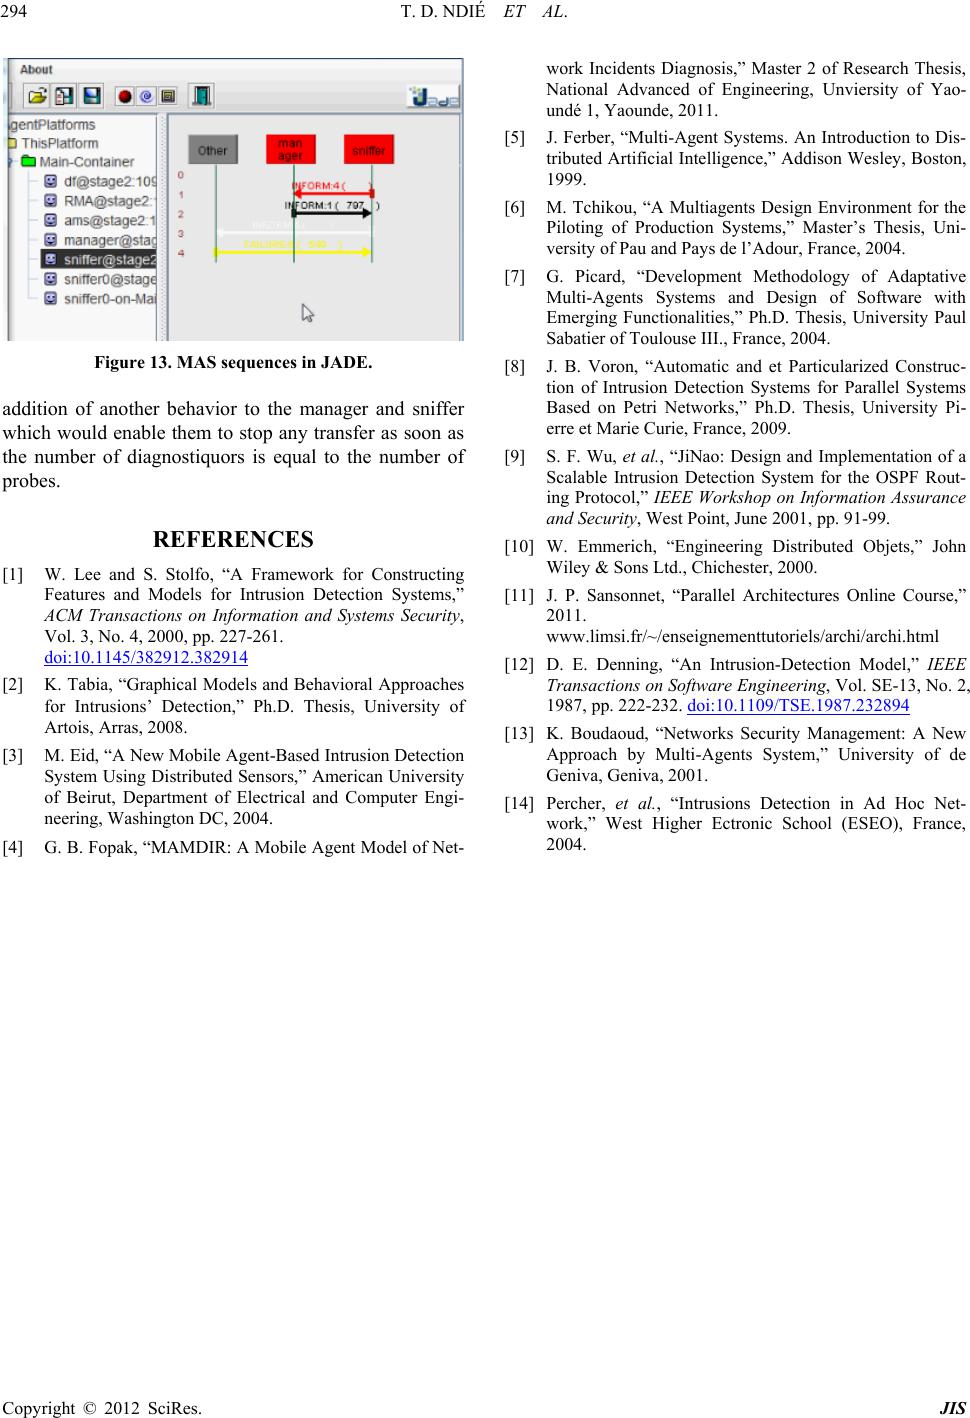 T. D. NDIÉ ET AL. Copyright © 2012 SciRes. JIS 294 Figure 13. MAS sequences in JADE. addition of another behavior to the manager and sniffer which would enable them to stop any transfer as soon as the number of diagnostiquors is equal to the number of probes. REFERENCES [1] W. Lee and S. Stolfo, “A Framework for Constructing Features and Models for Intrusion Detection Systems,” ACM Transactions on Information and Systems Security, Vol. 3, No. 4, 2000, pp. 227-261. doi:10.1145/382912.382914 [2] K. Tabia, “Graphical Models and Behavioral Approaches for Intrusions’ Detection,” Ph.D. Thesis, University of Artois, Arras, 2008. [3] M. Eid, “A New Mobile Agent-Based Intrusion Detection System Using Distributed Sensors,” American University of Beirut, Department of Electrical and Computer Engi- neering, Washington DC, 2004. [4] G. B. Fopak, “MAMDIR: A Mobile Agent Model of Net- work Incidents Diagnosis,” Master 2 of Research Thesis, National Advanced of Engineering, Unviersity of Yao- undé 1, Yaounde, 2011. [5] J. Ferber, “Multi-Agent Systems. An Introduction to Dis- tributed Artificial Intelligence,” Addison Wesley, Boston, 1999. [6] M. Tchikou, “A Multiagents Design Environment for the Piloting of Production Systems,” Master’s Thesis, Uni- versity of Pau and Pays de l’Adour, France, 2004. [7] G. Picard, “Development Methodology of Adaptative Multi-Agents Systems and Design of Software with Emerging Functionalities,” Ph.D. Thesis, University Paul Sabatier of Toulouse III., France, 2004. [8] J. B. Voron, “Automatic and et Particularized Construc- tion of Intrusion Detection Systems for Parallel Systems Based on Petri Networks,” Ph.D. Thesis, University Pi- erre et Marie Curie, France, 2009. [9] S. F. Wu, et al., “JiNao: Design and Implementation of a Scalable Intrusion Detection System for the OSPF Rout- ing Protocol,” IEEE Workshop on Information Assurance and Security, West Point, June 2001, pp. 91-99. [10] W. Emmerich, “Engineering Distributed Objets,” John Wiley & Sons Ltd., Chichester, 2000. [11] J. P. Sansonnet, “Parallel Architectures Online Course,” 2011. www.limsi.fr/~/enseignementtutoriels/archi/archi.html [12] D. E. Denning, “An Intrusion-Detection Model,” IEEE Transactions on Software Engineering, Vol. SE-13, No. 2, 1987, pp. 222-232. doi:10.1109/TSE.1987.232894 [13] K. Boudaoud, “Networks Security Management: A New Approach by Multi-Agents System,” University of de Geniva, Geniva, 2001. [14] Percher, et al., “Intrusions Detection in Ad Hoc Net- work,” West Higher Ectronic School (ESEO), France, 2004.
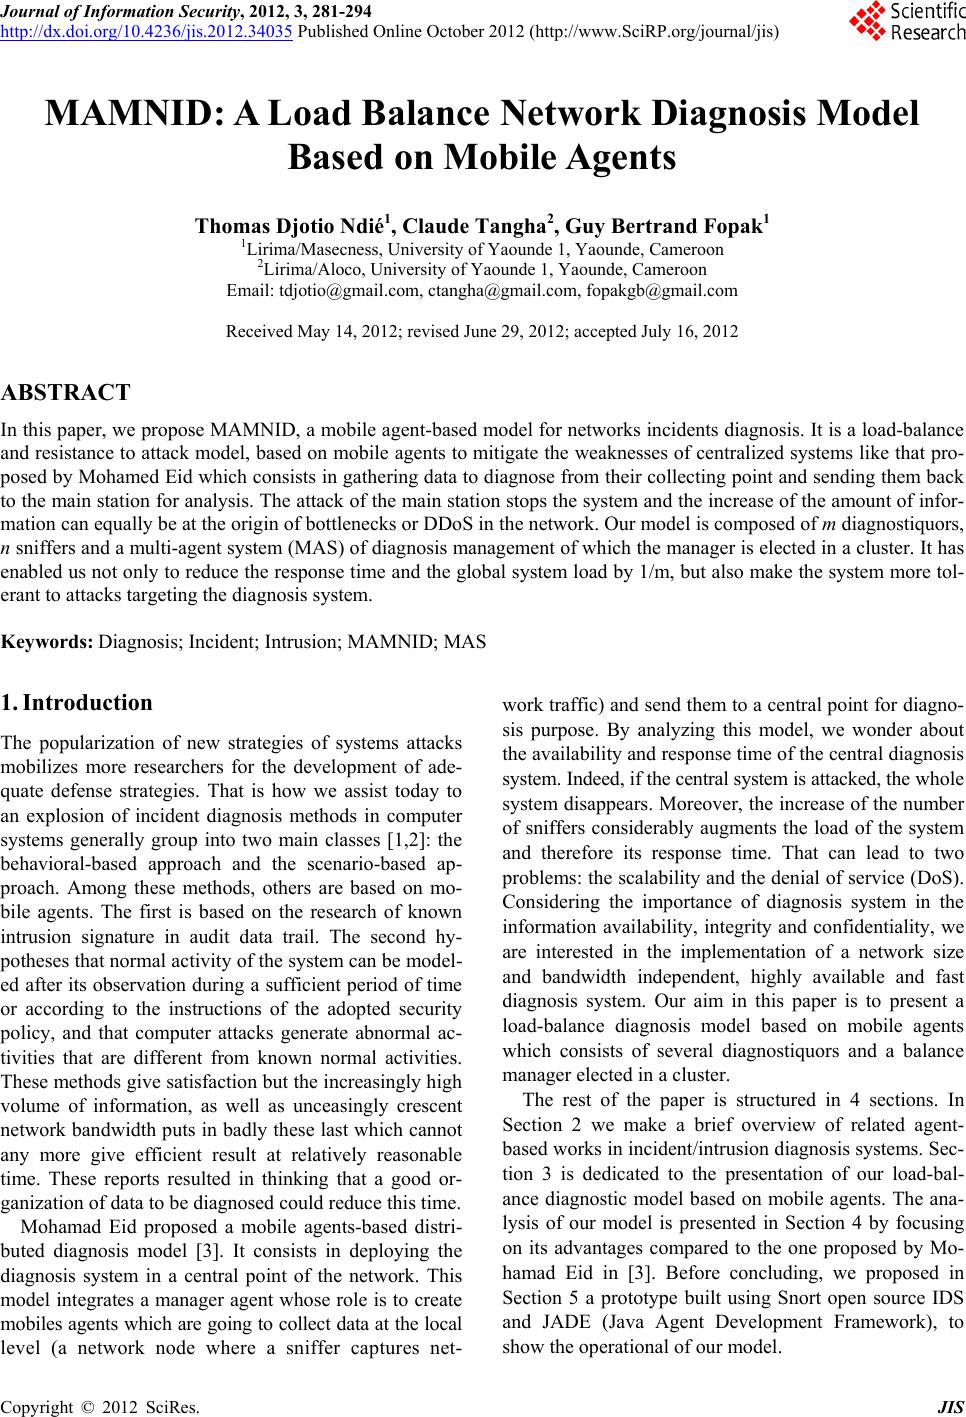
|