 Journal of Modern Physics, 2012, 3, 1369-1387 http://dx.doi.org/10.4236/jmp.2012.310174 Published Online October 2012 (http://www.SciRP.org/journal/jmp) Analysis of the Low-Energy π Elastic-Scattering Data E. Matsinos1*, G. Rasche2 1Centre for Applied Mathematics and Physics, Zurich University of Applied Sciences, Winterthur, Switzerland 2Institut für Theoretische Physik der Universität, Zürich, Switzerland Email: *evangelos.matsinos@zhaw.ch Received July 28, 2012; revised September 6, 2012; accepted September 14, 2012 ABSTRACT We report the results of a phase-shift analysis (PSA) of the low-energy elastic-scattering data. Following the method which we had set forth in our previous PSA [1], we first investigate the self-consistency of the low-energy elastic-scattering databases, via two separate analyses of (first) the and (subsequently) the elastic- scattering data. There are two main differences to our previous PSA: 1) we now perform only one test for the acceptance of each data set (based on its contribution to the overall πp πp πp πp 2 ) and 2) we adopt a more stringent acceptance criterion in the statistical tests. We show that it is possible to obtain self-consistent databases after removing a very small amount of the data (4.57% of the initial database). We subsequently fit the ETH model [38] to the truncated elastic-scattering databases. The model-parameter values show reasonable stability when subjected to different criteria for the rejection of single data points and entire data sets. Our result for the pseudovector coupling constant is . We extract the scattering lengths and volumes, as well as the s- and p-wave hadronic phase shifts up to T = 100 MeV. Large differences in the s-wave part of the interaction can be seen when comparing our hadronic phase shifts with the current SAID solution (WI08); there is general agreement in the p waves, save for the πp 726 0.0014 πNN 0.0 12 1 πN NπN N N 100T πp 0 ππpn πN πN hadronic phase shift. Keywords: Elastic Scattering; π Hadronic Phase Shifts; Coupling Constants; π Threshold Constants 1. Introduction This is the first of three papers dealing with issues of the pion-nucleon (π) interaction at low energies (pion la- boratory kinetic energy MeV). The goal in this study is to update part of the material given in our previ- ous phase-shift analysis (PSA) [1]. Hereafter, we will refer to that solution as UZH06, and to the one obtained in the present work as ZUAS12. We will show that the differences between these two solutions are small. In the second of the papers [2], we will address the self-con- sistency of the only elastic-scattering data which appeared in the meantime, i.e., of the measurements of Ref. [3], give details on the problems we encountered in the analysis of these measurements, and provide evi- dence to support our decision to retain the UZH06 initial elastic-scattering databases. In the third paper [4], we will analyse all available experimental data for the charge-exchange (CX) reaction and re- address the violation of the isospin invariance in the hadronic part of the interaction. In our program, we make use of the electromagnetic (em) corrections of Refs. [5], which lead to the em-modified hadronic quantities [1]. πp We re-open the case of the interaction at low en- ergies because of three reasons. There have been changes in the values of the physical constants which we had used in order to obtain our UZH06 solution. The largest of these changes con- cern the values of the charge radii of the pion and of the proton. All physical constants will be fixed here to the recommended values of the most recent report of the Particle-Data Group [6]. In view of the fact that a large amount of πp elas- tic-scattering data became available in 2004, one might be under the impression that the important re- sults and conclusions obtained with our UZH06 solu- *Corresponding author. C opyright © 2012 SciRes. JMP  E. MATSINOS, G. RASCHE 1370 tion (which did not include these data) need to be re- vised; we will show that this is not the case. Due to numerous problems which we have encountered in the analysis of these data [2], we have decided not to include them in our database. A large amount of CX data appeared after the com- pletion of the UZH06 PSA. In some cases, the corre- sponding reports of the experimental groups seem to cast doubt on the claims of isospin breaking [7,8]; therefore, it must be investigated whether the newly- obtained measurements invalidate those claims. We must stress that the physical quantities appearing here (i.e., the fit parameters of Sections 3.1-3.4, the scat- tering lengths and volumes of Section 3.4.2, the phase shifts of Section 3.4.3, etc.) are not purely-hadronic quantities since they still contain residual em effects, which the stage-I em corrections of Refs. [5] do not re- move. These residual effects relate in particular to the fact that, in principle, the (unknown) hadronic masses should be used (in the hadronic part of the π interac- tion) instead of the physical masses of the proton, of the neutron, and of the charged and neutral pion. Unfortu- nately, it is not possible at the present time to assess the significance of these effects. As a result, we must retain the cautious attitude of considering our physical quanti- ties “em-modified hadronic” (as we did in Ref. [1]). However, the repetitive use of this term is clumsy. Therefore, we omit it, unless we consider its use neces- sary as, for instance, in Section 4 and in the captions of our tables and figures. N πp p th j 2 2. Method 2.1. Formalism The determination of the observables from the hadronic phase shifts has been given in detail in Section 2 of Ref. [1]. For scattering, one obtains the partial-wave amplitudes from Equation (1) of that paper and deter- mines the no-spin-flip and spin-flip amplitudes via Equa- tions (2) and (3). Finally, the observables are evaluated from these amplitudes via Equations (13) and (14). For elastic scattering, the observables are determined on the basis of Equations (15)-(20). π 2.2. Minimisation Function and Scale Factors Similarly to our previous PSA [1], we make use of the minimisation function given by the Arndt-Roper formula [9]. The contribution of the data set to the overall is: 22 1 j j z z exp ij yth ith j th y exp y exp y exp 2 exp 1 jth N jij ij j iij zy y y (1) where denotes the data point of the data set, ij the corresponding fitted value (also referred to as “theoretical”), ij the statistical uncertainty of the ij data point, z a scale factor for the relative nor- malisation applying to the entire data set, z the cor- responding uncertainty (reported or assigned), and N th y the number of data points in the data set. The fitted val- ues ij are obtained by means of parameterised forms of the s- and p-wave amplitudes. The values of the scale factor z 2 are determined (for each data set separately) in such a way as to minimise . For each data set, there is a unique solution for z : 22 exp exp 1 22 exp 1 , j j N th ij ijijj i jN th ij ijj i yy yz z yy z (2) which leads to 2 exp 2 2 min exp 1 2 2 exp exp 1 22 exp 1 j j j th Nij ij j iij N th th ij ijijij i N th ij ijj i yy y yy yy yy z (3) 22 1min N j j 2 (where N stands for The overall the number of data sets used in the fit) is a function of the parameters entering the modelling of the s- and p-wave amplitudes; these parameters were varied until at- tained its minimal value 2 min . The part of 2 min j th j j z which represents the pure ran- dom fluctuations in the measurements of the data set (i.e., the “unexplained variation” in standard regres- sion terminology) may be obtained from Equation (3) in the limit , which is equivalent to removing the 2 j z from the denominator of the second term term on the right-hand side (rhs) of the expression; we will 2 j denote this value by t . The variation which is con- tained in 2 min j 2 j in excess of t must be associ- ated with the contribution from the rescaling (floating) of the data set as a whole; the expression for 22 2 min jj j cst is 2 2 2exp exp 1 2 22 2 exp exp 11 j jj N th th jijijijij i jNN sc th th ij ijij ijj ii zyyyy yyyy z . (4) Copyright © 2012 SciRes. JMP 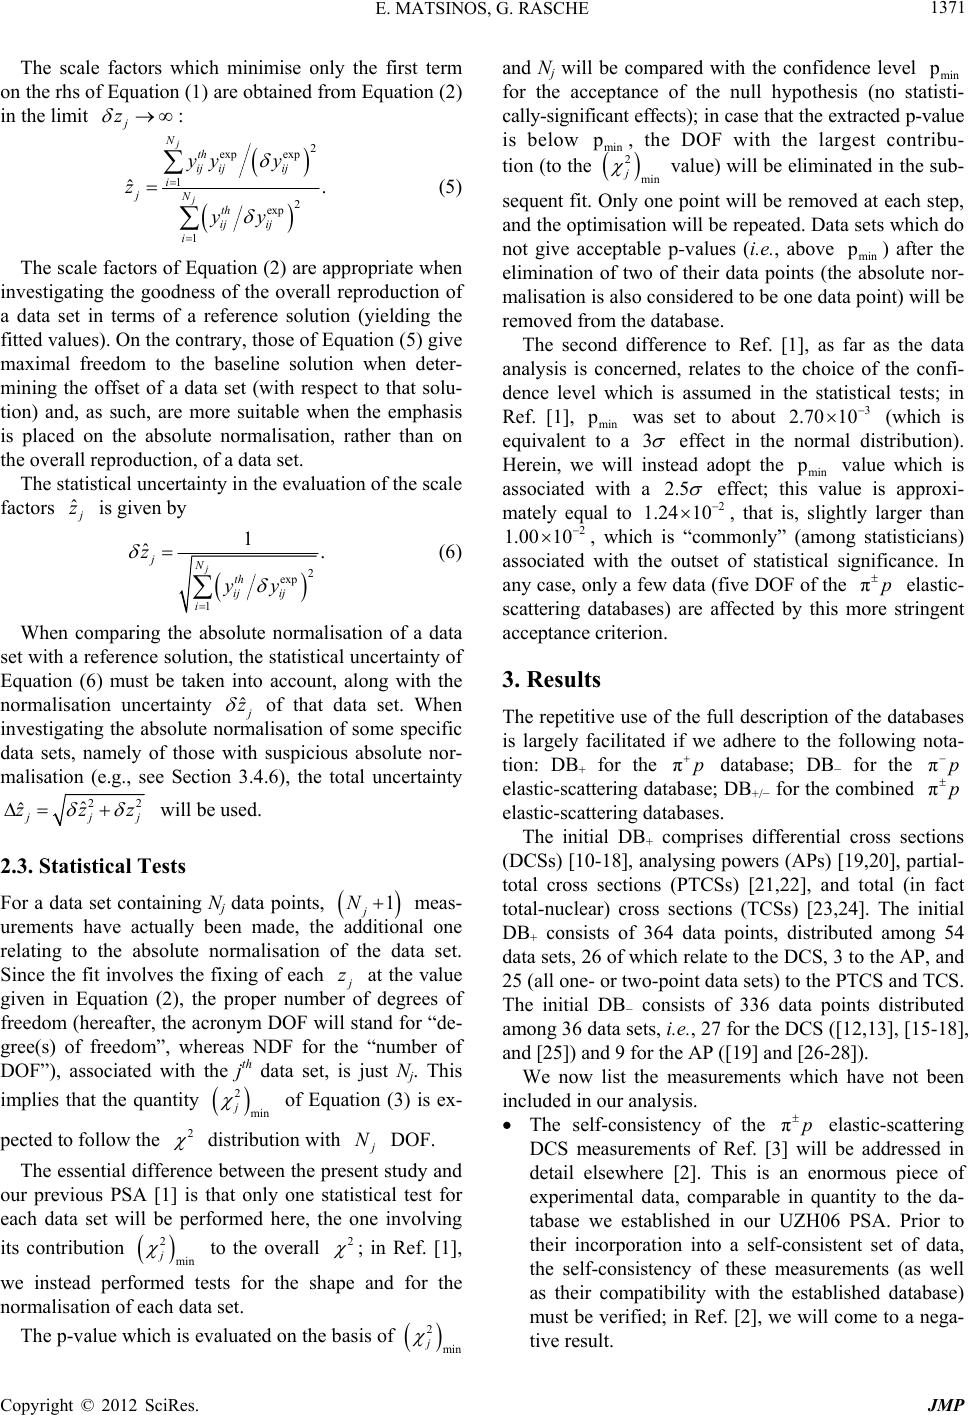 E. MATSINOS, G. RASCHE 1371 The scale factors which minimise only the first term on the rhs of Equation (1) are obtained from Equation (2) in the limit j z : 2 exp exp 2 exp j j N th ij ijij i jN th ij ij i yy y z yy ˆ 1 1 ˆ. (5) The scale factors of Equation (2) are appropriate when investigating the goodness of the overall reproduction of a data set in terms of a reference solution (yielding the fitted values). On the contrary, those of Equation (5) give maximal freedom to the baseline solution when deter- mining the offset of a data set (with respect to that solu- tion) and, as such, are more suitable when the emphasis is placed on the absolute normalisation, rather than on the overall reproduction, of a data set. The statistical uncertainty in the evaluation of the scale factors z is given by 2 exp 1. th ij ij yy ˆ 1 ˆ j jN i z (6) When comparing the absolute normalisation of a data set with a reference solution, the statistical uncertainty of Equation (6) must be taken into account, along with the normalisation uncertainty z of that data set. When investigating the absolute normalisation of some specific data sets, namely of those with suspicious absolute nor- malisation (e.g., see Section 3.4.6), the total uncertainty 22 ˆ ˆ jj zzz 1N will be used. 2.3. Statistical Tests For a data set containing Nj data points, j meas- urements have actually been made, the additional one relating to the absolute normalisation of the data set. Since the fit involves the fixing of each z 2 min j 2 at the value given in Equation (2), the proper number of degrees of freedom (hereafter, the acronym DOF will stand for “de- gree(s) of freedom”, whereas NDF for the “number of DOF”), associated with the jth data set, is just Nj. This implies that the quantity of Equation (3) is ex- pected to follow the distribution with N 2 min j 2 DOF. The essential difference between the present study and our previous PSA [1] is that only one statistical test for each data set will be performed here, the one involving its contribution to the overall ; in Ref. [1], we instead performed tests for the shape and for the normalisation of each data set. The p-value which is evaluated on the basis of and Nj will be compared with the confidence level min for the acceptance of the null hypothesis (no statisti- cally-significant effects); in case that the extracted p-value is below min , the DOF with the largest contribu- 2 mi j n value) will be eliminated in the sub- tion (to the sequent fit. Only one point will be removed at each step, and the optimisation will be repeated. Data sets which do not give acceptable p-values (i.e., above min ) after the elimination of two of their data points (the absolute nor- malisation is also considered to be one data point) will be removed from the database. The second difference to Ref. [1], as far as the data analysis is concerned, relates to the choice of the confi- dence level which is assumed in the statistical tests; in Ref. [1], min was set to about (which is equivalent to a 3 3 2.70 10 effect in the normal distribution). Herein, we will instead adopt the min value which is associated with a 2.5 effect; this value is approxi- mately equal to 2 1.24 10 2 1.00 10 , that is, slightly larger than πp πp πp πp , which is “commonly” (among statisticians) associated with the outset of statistical significance. In any case, only a few data (five DOF of the elastic- scattering databases) are affected by this more stringent acceptance criterion. 3. Results The repetitive use of the full description of the databases is largely facilitated if we adhere to the following nota- tion: DB+ for the database; DB− for the elastic-scattering database; DB+/− for the combined elastic-scattering databases. The initial DB+ comprises differential cross sections (DCSs) [10-18], analysing powers (APs) [19,20], partial- total cross sections (PTCSs) [21,22], and total (in fact total-nuclear) cross sections (TCSs) [23,24]. The initial DB+ consists of 364 data points, distributed among 54 data sets, 26 of which relate to the DCS, 3 to the AP, and 25 (all one- or two-point data sets) to the PTCS and TCS. The initial DB− consists of 336 data points distributed among 36 data sets, i.e., 27 for the DCS ([12,13], [15-18], and [25]) and 9 for the AP ([19] and [26-28]). We now list the measurements which have not been included in our analysis. The self-consistency of the πp elastic-scattering DCS measurements of Ref. [3] will be addressed in detail elsewhere [2]. This is an enormous piece of experimental data, comparable in quantity to the da- tabase we established in our UZH06 PSA. Prior to their incorporation into a self-consistent set of data, the self-consistency of these measurements (as well as their compatibility with the established database) must be verified; in Ref. [2], we will come to a nega- tive result. 2 mi j n Copyright © 2012 SciRes. JMP  E. MATSINOS, G. RASCHE 1372 The 70 πp DCS measurements of Ref. [29] are obvious outliers in all exclusive analyses of the low- energy data; when using “traditional” statistics, the inclusion of these values in a PSA is bound to intro- duce spurious effects (e.g., drifting of the parameters during the optimisation, entrapment of the minimi- sation algorithms in local minima, failing fits, etc.). We will further comment on these data in Section 3.4.6. The 6 (3 for πp at 94.50 MeV, 3 for πp at 88.50 MeV) DCS measurements of Ref. [30] have not appeared in a form which would enable their straight- forward inclusion in our database. Furthermore, we are not convinced that the original DCS data may be retrieved by simply adding the contributions appear- ing in columns 4 and 5 of Table 1 of Ref. [30]. Given that the 9 existing πp PTCSs and TCSs contain a component from CX scattering, they cannot be used; the inclusion of these data in any part of the analysis would perplex the discussion on the violation of the isospin invariance in the hadronic part of the πN interaction [4]. The inclusion of the 28 AP measurements of Ref. [31] in the fits would necessitate substantial modifications in the database structure and in the analysis software. This is due to two reasons: 1) each of the three data sets, to which the measurements of Ref. [31] must be assigned, contains data taken at more than one beam energy and 2) the last of the data sets contains meas- urements for both elastic-scattering reactions. Given the difficulty at present to include these measure- ments in our fits, we can only use them in testing the overall consistency of our approach across energies. (If a significant amount of πp measurements had been acquired in that experiment, we could have in- vestigated the consistency of our approach across re- actions.) We will return to this subject in Section 3.4.5. We will also not use in the fits the scattering length obtained from the experimental result for the strong shift of the 1s state in pionic hydrogen [32], after it has been corrected in Ref. [33] also taking into ac- count the proper contributions of the n channel; the difference to the cc a value of our UZH06 PSA (which is almost identical to the value we will obtain in this work) has been addressed in Ref. [33]. In order to give the data maximal freedom in the proc- ess of identifying the outliers, the two elastic-scattering reactions will be analysed separately using simple param- eterisations of the s- and p-wave K-matrix elements. The (small at low energies) d and f waves have been fixed herein from the current SAID solution (WI08) [34]. In the SAID analysis, the energy dependence of the d and f phase shifts is determined from the region T > 100 MeV (i.e., from energies where these contributions are sizable). The largest of these phase shifts in the energy interval of this analysis, D15, does not exceed 0.27˚. For the purpose of fitting, the standard MINUIT package [35] of the CERN library was used (FORTRAN version). Each optimisation was achieved on the basis of the (robust) SIMPLEX-MINIMIZE-MIGRAD-MINOS chain. All fits of the present work terminated success- fully. 3.1. Fits to the DB+ Using the K-Matrix Parameterisations The parameterisation, which we will now describe, was introduced (and successfully applied to scattering) in Ref. [36]. For elastic scattering, the s-wave phase shift is parameterised as πp πp 1 32 322 00 33 cot , c qabc q (7) where c and are respectively the momentum and the pion kinetic energy in the centre-of-mass (CM) sys- tem. The 12-wave phase shift is parameterised accord- ing to the form p 32 2 13131 tan c qd e. (8) Since the 32 wave contains the (1232) resonance, a resonant piece in Breit-Wigner form is added to the background term, thus leading to the equation pΔ 2 2 322 ΔΔ 13333 322 ΔΔ Γ tan , c c q m qd eqW mW 1232m (9) with MeV and MeV [6]; Δ q is the value of the CM momentum at the resonance position. The third term on the rhs of Equation (9) is the standard resonance contribution (e.g., see Ref. [37], p. 31). 118 Δ The use of the parametric forms in Equations (7)-(9), which do not impose any theoretical constraints (save for the expected low-energy behaviour of the K-matrix ele- ments and for the Breit-Wigner form used to describe the (1232)-resonance contribution), ensures that any out- liers in the fits cannot be attributed to the inability of these forms to account for the energy dependence of the phase shifts; they are instead indicative of experimental problems. Following the procedure of Section 2.3, we found that, for the data sets of BRACK90 [16] at 66.80 MeV and JORAM95 [18] at 32.70 MeV, the p-values were still below min after the removal of two data points (from each data set); as a result, these two data sets (with ele- ven and seven data points, respectively) were removed from the database. These two data sets have extremely low p-values and clearly stand out from the rest of the data. Two data sets had to be freely floated, the πp Copyright © 2012 SciRes. JMP 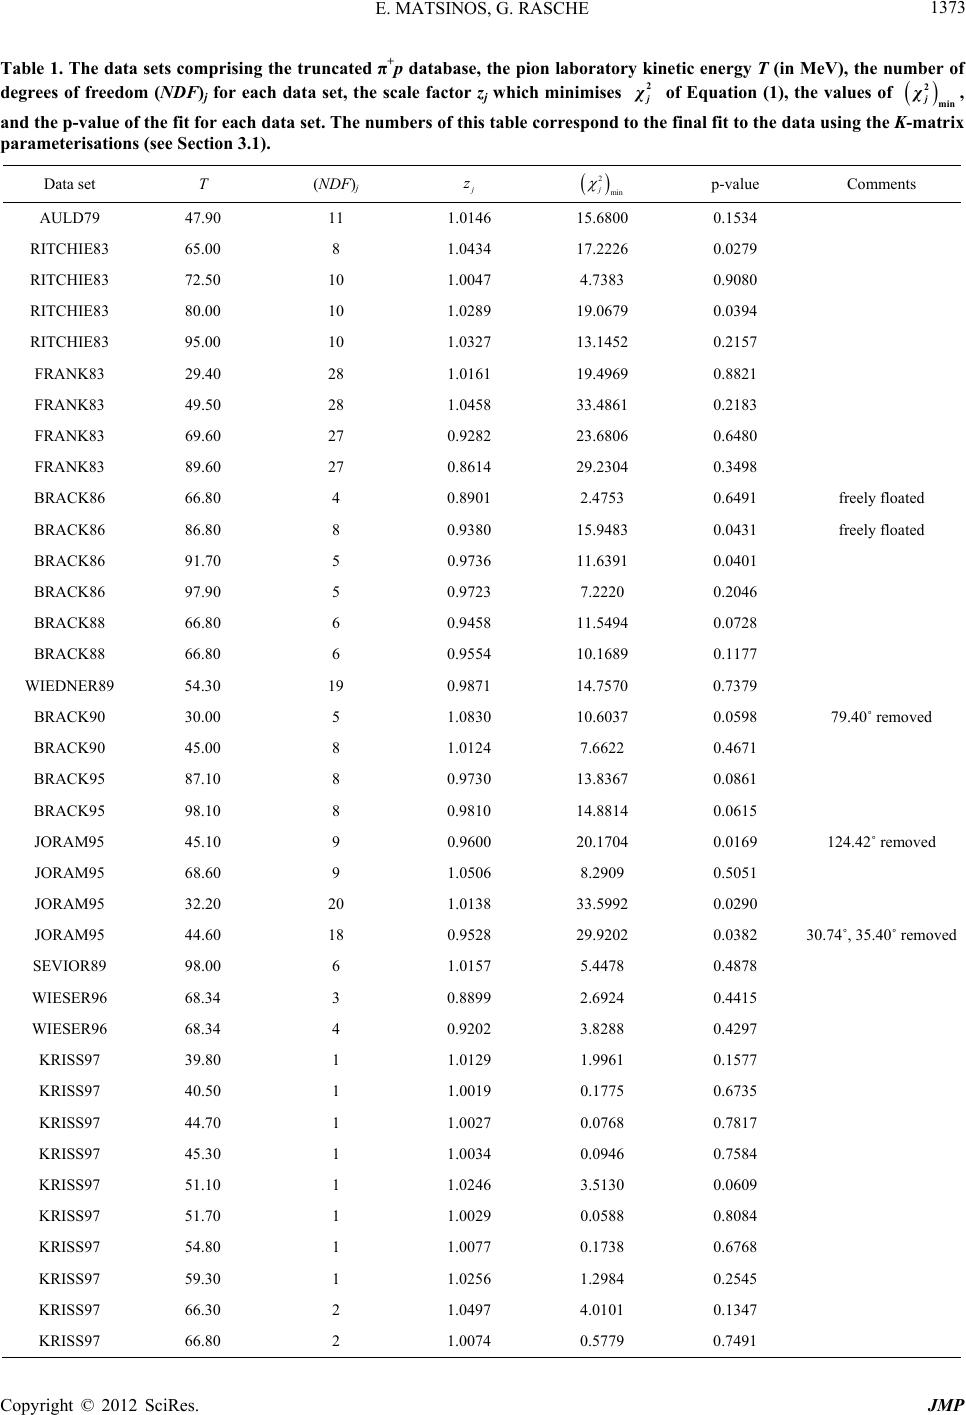 E. MATSINOS, G. RASCHE Copyright © 2012 SciRes. JMP 1373 2 Table 1. The data sets comprising the truncated π+p database, the pion laboratory kinetic energy T (in MeV), the number of degrees of freedom (NDF)j for each data set, the scale factor zj which minimises χ of Equation (1), the values of 2 min j χ, and the p-value of the fit for each data set. The numbers of this table correspond to the final fit to the data using the K-matrix parameterisations (see Section 3.1). Data set T (NDF)j j z 2 min j p-value Comments AULD79 47.90 11 1.0146 15.6800 0.1534 RITCHIE83 65.00 8 1.0434 17.2226 0.0279 RITCHIE83 72.50 10 1.0047 4.7383 0.9080 RITCHIE83 80.00 10 1.0289 19.0679 0.0394 RITCHIE83 95.00 10 1.0327 13.1452 0.2157 FRANK83 29.40 28 1.0161 19.4969 0.8821 FRANK83 49.50 28 1.0458 33.4861 0.2183 FRANK83 69.60 27 0.9282 23.6806 0.6480 FRANK83 89.60 27 0.8614 29.2304 0.3498 BRACK86 66.80 4 0.8901 2.4753 0.6491 freely floated BRACK86 86.80 8 0.9380 15.9483 0.0431 freely floated BRACK86 91.70 5 0.9736 11.6391 0.0401 BRACK86 97.90 5 0.9723 7.2220 0.2046 BRACK88 66.80 6 0.9458 11.5494 0.0728 BRACK88 66.80 6 0.9554 10.1689 0.1177 WIEDNER89 54.30 19 0.9871 14.7570 0.7379 BRACK90 30.00 5 1.0830 10.6037 0.0598 79.40˚ removed BRACK90 45.00 8 1.0124 7.6622 0.4671 BRACK95 87.10 8 0.9730 13.8367 0.0861 BRACK95 98.10 8 0.9810 14.8814 0.0615 JORAM95 45.10 9 0.9600 20.1704 0.0169 124.42˚ removed JORAM95 68.60 9 1.0506 8.2909 0.5051 JORAM95 32.20 20 1.0138 33.5992 0.0290 JORAM95 44.60 18 0.9528 29.9202 0.0382 30.74˚, 35.40˚ removed SEVIOR89 98.00 6 1.0157 5.4478 0.4878 WIESER96 68.34 3 0.8899 2.6924 0.4415 WIESER96 68.34 4 0.9202 3.8288 0.4297 KRISS97 39.80 1 1.0129 1.9961 0.1577 KRISS97 40.50 1 1.0019 0.1775 0.6735 KRISS97 44.70 1 1.0027 0.0768 0.7817 KRISS97 45.30 1 1.0034 0.0946 0.7584 KRISS97 51.10 1 1.0246 3.5130 0.0609 KRISS97 51.70 1 1.0029 0.0588 0.8084 KRISS97 54.80 1 1.0077 0.1738 0.6768 KRISS97 59.30 1 1.0256 1.2984 0.2545 KRISS97 66.30 2 1.0497 4.0101 0.1347 KRISS97 66.80 2 1.0074 0.5779 0.7491 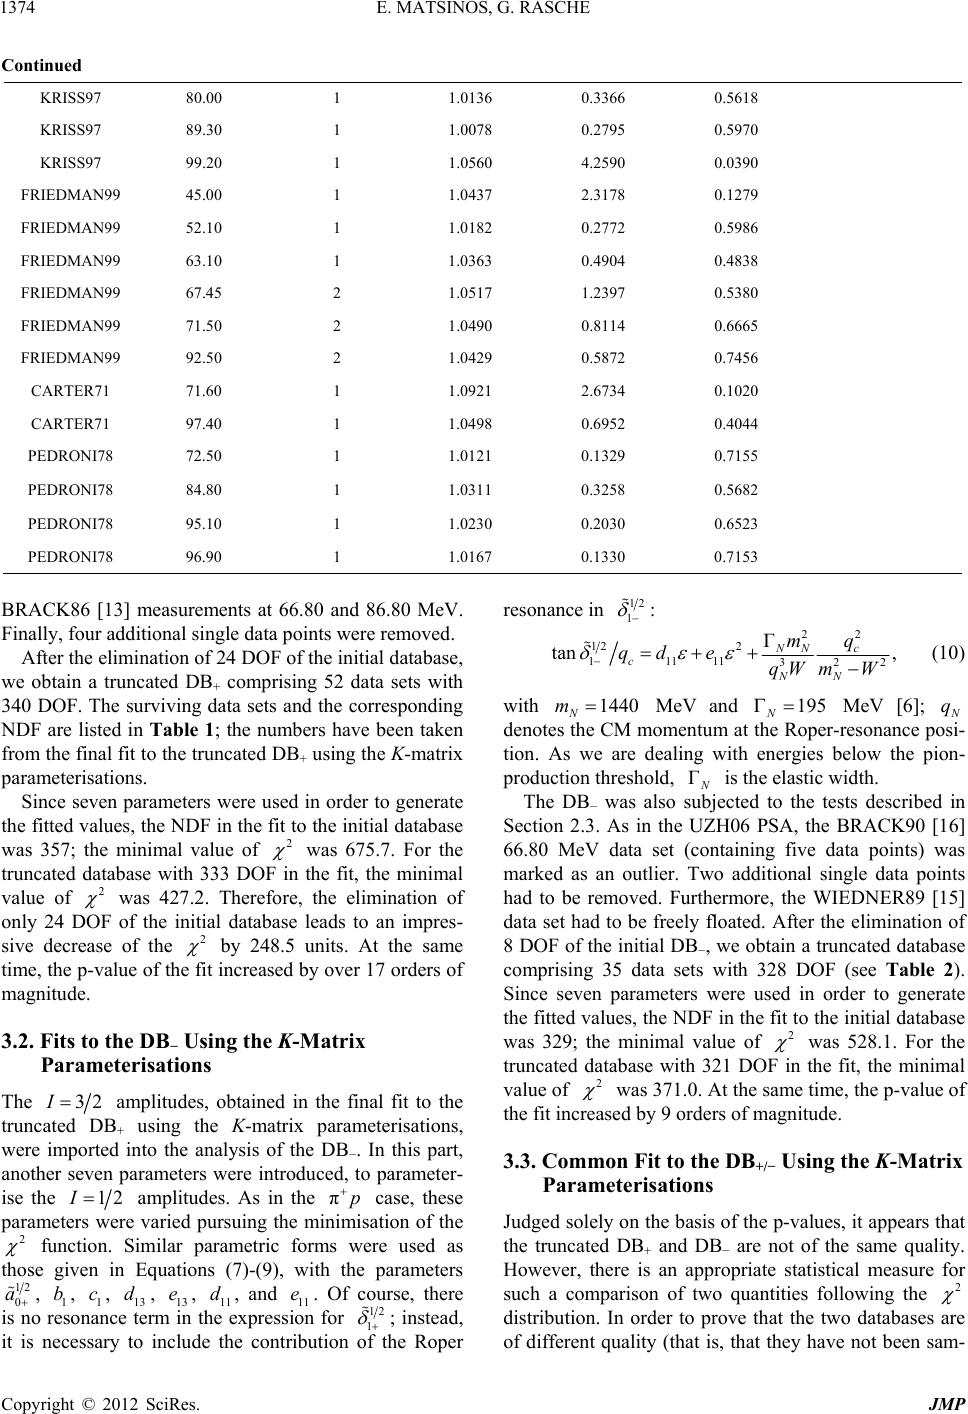 E. MATSINOS, G. RASCHE 1374 Continued KRISS97 80.00 1 1.0136 0.3366 0.5618 KRISS97 89.30 1 1.0078 0.2795 0.5970 KRISS97 99.20 1 1.0560 4.2590 0.0390 FRIEDMAN99 45.00 1 1.0437 2.3178 0.1279 FRIEDMAN99 52.10 1 1.0182 0.2772 0.5986 FRIEDMAN99 63.10 1 1.0363 0.4904 0.4838 FRIEDMAN99 67.45 2 1.0517 1.2397 0.5380 FRIEDMAN99 71.50 2 1.0490 0.8114 0.6665 FRIEDMAN99 92.50 2 1.0429 0.5872 0.7456 CARTER71 71.60 1 1.0921 2.6734 0.1020 CARTER71 97.40 1 1.0498 0.6952 0.4044 PEDRONI78 72.50 1 1.0121 0.1329 0.7155 PEDRONI78 84.80 1 1.0311 0.3258 0.5682 PEDRONI78 95.10 1 1.0230 0.2030 0.6523 PEDRONI78 96.90 1 1.0167 0.1330 0.7153 BRACK86 [13] measurements at 66.80 and 86.80 MeV. Finally, four additional single data points were removed. After the elimination of 24 DOF of the initial database, we obtain a truncated DB+ comprising 52 data sets with 340 DOF. The surviving data sets and the corresponding NDF are listed in Table 1; the numbers have been taken from the final fit to the truncated DB+ using the K-matrix parameterisations. Since seven parameters were used in order to generate the fitted values, the NDF in the fit to the initial database was 357; the minimal value of 2 was 675.7. For the truncated database with 333 DOF in the fit, the minimal value of 2 was 427.2. Therefore, the elimination of only 24 DOF of the initial database leads to an impres- sive decrease of the 2 by 248.5 units. At the same time, the p-value of the fit increased by over 17 orders of magnitude. 3.2. Fits to the DB− Using the K-Matrix Parameterisations The 32I amplitudes, obtained in the final fit to the truncated DB+ using the K-matrix parameterisations, were imported into the analysis of the DB−. In this part, another seven parameters were introduced, to parameter- ise the 12Iπp 2 amplitudes. As in the case, these parameters were varied pursuing the minimisation of the function. Similar parametric forms were used as those given in Equations (7)-(9), with the parameters 12 b cdee 0 a, 1, 1, 13 , 13 , 11 , and 11 . Of course, there is no resonance term in the expression for d 12 1 ; instead, it is necessary to include the contribution of the Roper resonance in 12 1 : 22 12 2 11111 322 Γ tan , NN c c NN mq qd eqW mW 1440m (10) MeV and N MeV [6]; with N195 q Γ denotes the CM momentum at the Roper-resonance posi- tion. As we are dealing with energies below the pion- production threshold, is the elastic width. The DB− was also subjected to the tests described in Section 2.3. As in the UZH06 PSA, the BRACK90 [16] 66.80 MeV data set (containing five data points) was marked as an outlier. Two additional single data points had to be removed. Furthermore, the WIEDNER89 [15] data set had to be freely floated. After the elimination of 8 DOF of the initial DB−, we obtain a truncated database comprising 35 data sets with 328 DOF (see Table 2). Since seven parameters were used in order to generate the fitted values, the NDF in the fit to the initial database was 329; the minimal value of 2 was 528.1. For the truncated database with 321 DOF in the fit, the minimal value of 2 was 371.0. At the same time, the p-value of the fit increased by 9 orders of magnitude. 3.3. Common Fit to the DB+/− Using the K-Matrix Parameterisations Judged solely on the basis of the p-values, it appears that the truncated DB+ and DB− are not of the same quality. However, there is an appropriate statistical measure for such a comparison of two quantities following the 2 distribution. In order to prove that the two databases are of different quality (that is, tat they have not been sam- h Copyright © 2012 SciRes. JMP 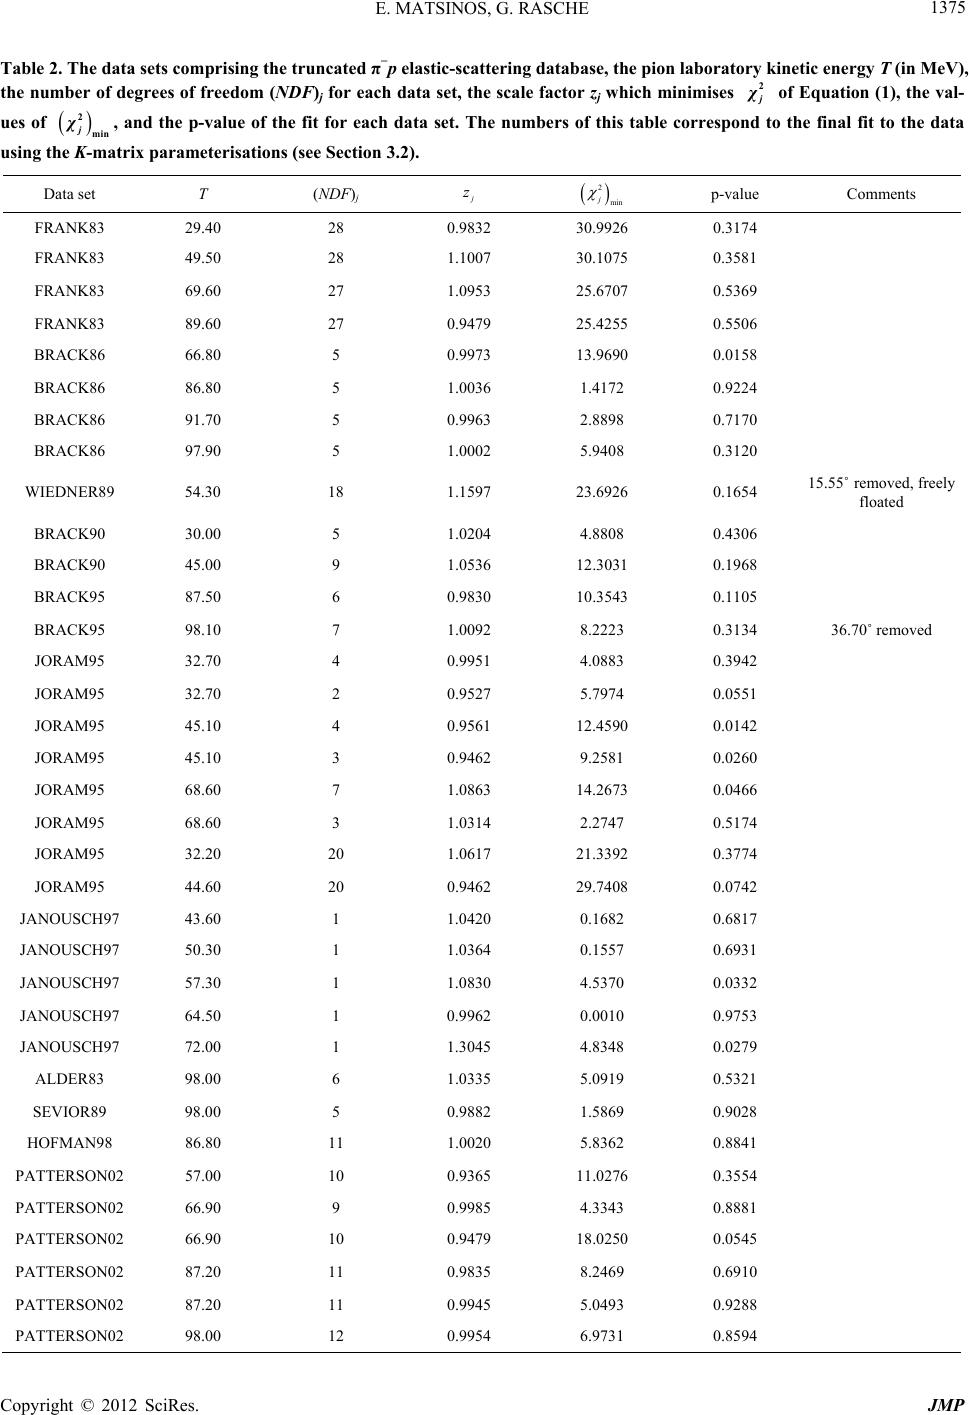 E. MATSINOS, G. RASCHE 1375 Table 2. The data sets comprising the truncated π−p elastic-scattering database, the pion laboratory kinetic energy T (in MeV), the number of degrees of freedom (NDF)j for each data set, the scale factor zj which minimises 2 χ 2 min j χ of Equation (1), the val- ues of , and the p-value of the fit for each data set. The numbers of this table correspond to the final fit to the data using the K-matrix parameterisations (see Section 3.2). Data set T (NDF)j j z 2 min j p-value Comments FRANK83 29.40 28 0.9832 30.9926 0.3174 FRANK83 49.50 28 1.1007 30.1075 0.3581 FRANK83 69.60 27 1.0953 25.6707 0.5369 FRANK83 89.60 27 0.9479 25.4255 0.5506 BRACK86 66.80 5 0.9973 13.9690 0.0158 BRACK86 86.80 5 1.0036 1.4172 0.9224 BRACK86 91.70 5 0.9963 2.8898 0.7170 BRACK86 97.90 5 1.0002 5.9408 0.3120 WIEDNER89 54.30 18 1.1597 23.6926 0.1654 15.55˚ removed, freely floated BRACK90 30.00 5 1.0204 4.8808 0.4306 BRACK90 45.00 9 1.0536 12.3031 0.1968 BRACK95 87.50 6 0.9830 10.3543 0.1105 BRACK95 98.10 7 1.0092 8.2223 0.3134 36.70˚ removed JORAM95 32.70 4 0.9951 4.0883 0.3942 JORAM95 32.70 2 0.9527 5.7974 0.0551 JORAM95 45.10 4 0.9561 12.4590 0.0142 JORAM95 45.10 3 0.9462 9.2581 0.0260 JORAM95 68.60 7 1.0863 14.2673 0.0466 JORAM95 68.60 3 1.0314 2.2747 0.5174 JORAM95 32.20 20 1.0617 21.3392 0.3774 JORAM95 44.60 20 0.9462 29.7408 0.0742 JANOUSCH97 43.60 1 1.0420 0.1682 0.6817 JANOUSCH97 50.30 1 1.0364 0.1557 0.6931 JANOUSCH97 57.30 1 1.0830 4.5370 0.0332 JANOUSCH97 64.50 1 0.9962 0.0010 0.9753 JANOUSCH97 72.00 1 1.3045 4.8348 0.0279 ALDER83 98.00 6 1.0335 5.0919 0.5321 SEVIOR89 98.00 5 0.9882 1.5869 0.9028 HOFMAN98 86.80 11 1.0020 5.8362 0.8841 PATTERSON02 57.00 10 0.9365 11.0276 0.3554 PATTERSON02 66.90 9 0.9985 4.3343 0.8881 PATTERSON02 66.90 10 0.9479 18.0250 0.0545 PATTERSON02 87.20 11 0.9835 8.2469 0.6910 PATTERSON02 87.20 11 0.9945 5.0493 0.9288 PATTERSON02 98.00 12 0.9954 6.9731 0.8594 Copyright © 2012 SciRes. JMP 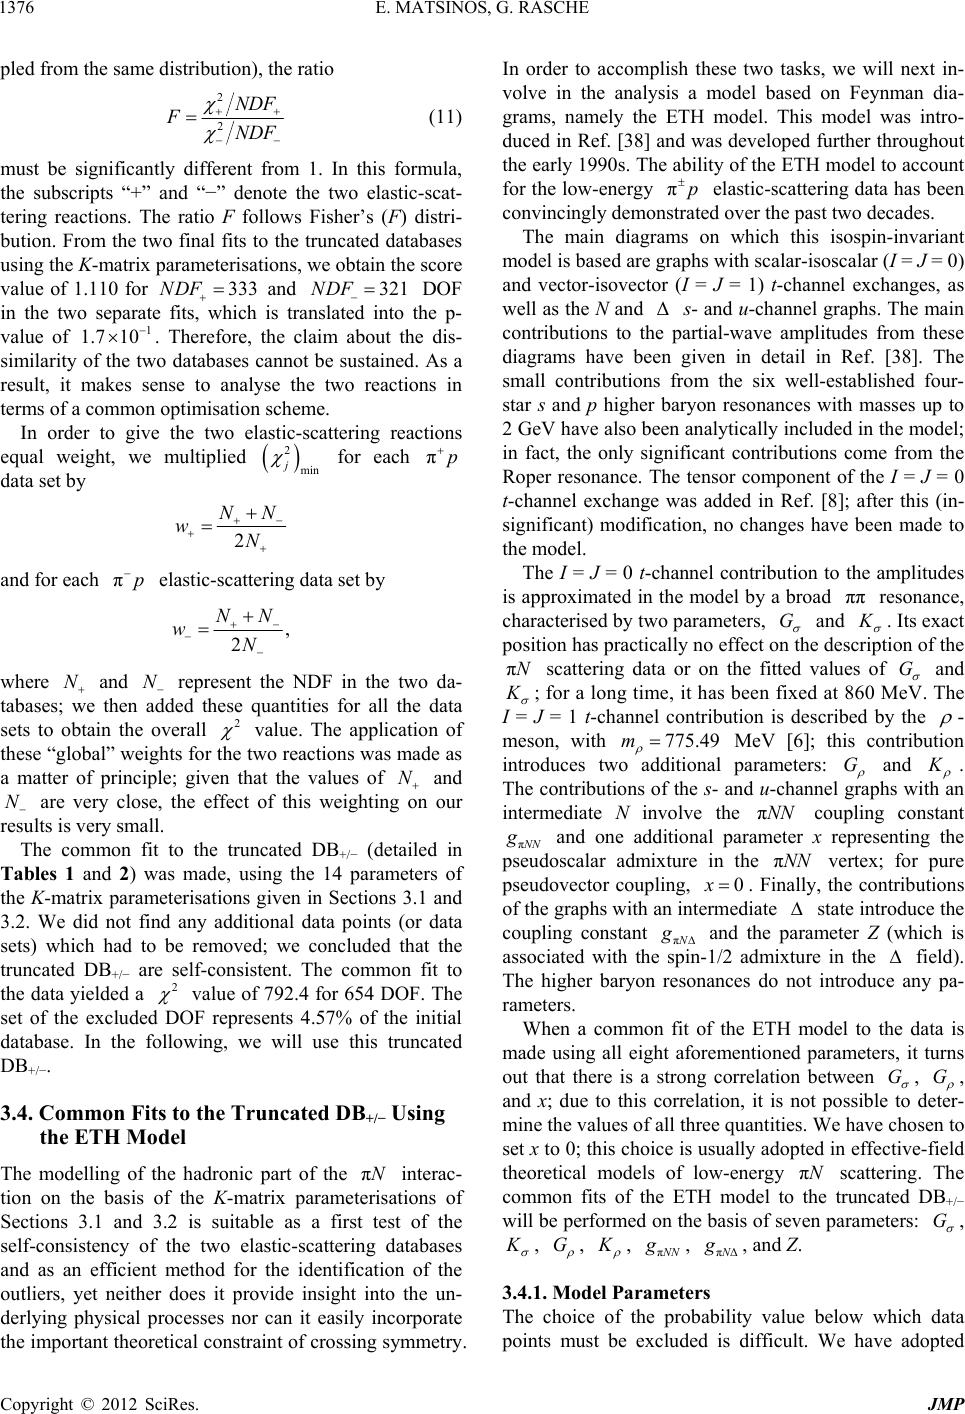 E. MATSINOS, G. RASCHE 1376 pled from the same distribution), the ratio 2 2 NDF NDF ND 321NDF 2 j πp F (11) must be significantly different from 1. In this formula, the subscripts “+” and “−” denote the two elastic-scat- tering reactions. The ratio F follows Fisher’s (F) distri- bution. From the two final fits to the truncated databases using the K-matrix parameterisations, we obtain the score value of 1.110 for and DOF in the two separate fits, which is translated into the p- value of . Therefore, the claim about the dis- similarity of the two databases cannot be sustained. As a result, it makes sense to analyse the two reactions in terms of a common optimisation scheme. 333F 1 1.7 10 In order to give the two elastic-scattering reactions equal weight, we multiplied for each data set by min 2 NN N w πp and for each elastic-scattering data set by , 2 NN N w N N 2 where and represent the NDF in the two da- tabases; we then added these quantities for all the data sets to obtain the overall value. The application of these “global” weights for the two reactions was made as a matter of principle; given that the values of N and are very close, the effect of this weighting on our results is very small. N 2 The common fit to the truncated DB+/− (detailed in Tables 1 and 2) was made, using the 14 parameters of the K-matrix parameterisations given in Sections 3.1 and 3.2. We did not find any additional data points (or data sets) which had to be removed; we concluded that the truncated DB+/− are self-consistent. The common fit to the data yielded a value of 792.4 for 654 DOF. The set of the excluded DOF represents 4.57% of the initial database. In the following, we will use this truncated DB+/−. 3.4. Common Fits to the Truncated DB+/− Using the ETH Model The modelling of the hadronic part of the interac- tion on the basis of the K-matrix parameterisations of Sections 3.1 and 3.2 is suitable as a first test of the self-consistency of the two elastic-scattering databases and as an efficient method for the identification of the outliers, yet neither does it provide insight into the un- derlying physical processes nor can it easily incorporate the important theoretical constraint of crossing symmetry. In order to accomplish these two tasks, we will next in- volve in the analysis a model based on Feynman dia- grams, namely the ETH model. This model was intro- duced in Ref. [38] and was developed further throughout the early 1990s. The ability of the ETH model to account for the low-energy elastic-scattering data has been convincingly demonstrated over the past two decades. πN πp Δ ππ G The main diagrams on which this isospin-invariant model is based are graphs with scalar-isoscalar (I = J = 0) and vector-isovector (I = J = 1) t-channel exchanges, as well as the N and s- and u-channel graphs. The main contributions to the partial-wave amplitudes from these diagrams have been given in detail in Ref. [38]. The small contributions from the six well-established four- star s and p higher baryon resonances with masses up to 2 GeV have also been analytically included in the model; in fact, the only significant contributions come from the Roper resonance. The tensor component of the I = J = 0 t-channel exchange was added in Ref. [8]; after this (in- significant) modification, no changes have been made to the model. The I = J = 0 t-channel contribution to the amplitudes is approximated in the model by a broad resonance, characterised by two parameters, and . Its exact position has practically no effect on the description of the scattering data or on the fitted values of πN G and ; for a long time, it has been fixed at 860 MeV. The I = J = 1 t-channel contribution is described by the - meson, with 775.49m MeV [6]; this contribution introduces two additional parameters: G and . The contributions of the s- and u-channel graphs with an intermediate N involve the coupling constant π πNN N and one additional parameter x representing the pseudoscalar admixture in the vertex; for pure pseudovector coupling, πNN 0x . Finally, the contributions of the graphs with an intermediate state introduce the coupling constant π and the parameter Z (which is associated with the spin-1/2 admixture in the field). The higher baryon resonances do not introduce any pa- rameters. When a common fit of the ETH model to the data is made using all eight aforementioned parameters, it turns out that there is a strong correlation between G , G , and x; due to this correlation, it is not possible to deter- mine the values of all three quantities. We have chosen to set x to 0; this choice is usually adopted in effective-field theoretical models of low-energy scattering. The common fits of the ETH model to the truncated DB+/− will be performed on the basis of seven parameters: πN G , G , , , π N , πΔ , and Z. 3.4.1. Model Parameters The choice of the probability value below which data points must be excluded is difficult. We have adopted Copyright © 2012 SciRes. JMP  E. MATSINOS, G. RASCHE 1377 here the value of min corresponding to a 2.5 effect in the normal distribution. Recognising the subjective- ness in this choice, we consider that, in order to have confidence in the reliability of our analysis, it is neces- sary to verify that the fitted values of the seven model parameters remain stable over a reasonably broad range of min values; we followed the same strategy in Ref. [1]. Thus, in addition to min 2 1.2410 , the analysis was performed with a database reduced by using the min values of about (equivalent to a 3 10 2.703 effect in the normal distribution) and 2 4.55 10 (equivalent to a 2 effect in the normal distribution)1. Table 3 shows the values of the seven model parame- ters for the common fits to the truncated DB+/− for the three selected values of min . The uncertainties shown correspond to 2 min 1.24 10 . In fact, when the uncer- tainties are calculated with the Birge factor 2NDF included, they do not vary much with the value of min . As min is increased, the truncated database fitted shrinks and so the raw uncertainties increase. However, the fac- tor 2NDF decreases as the fit quality improves (despite the decrease in NDF) and the two effects largely compensate. Table 3 shows that the results of the fit are reasonably stable as the criterion for the rejection of data points is varied2. We see from Table 3 that the values of π N are compatible; converted to the usual pseudovector cou- pling constant3, our result for 2 min 1.2410 is , 4π NN c p fg m 2 22 ππ 0.0726 14 24π NN where c denotes the mass of the charged pion and m 2 that of the proton. This result agrees well with the value we had obtained in our previous PSA [1]. The correlation (Hessian) matrix for the seven pa- rameters of the ETH model is given in Table 4; the num- bers correspond to the fit for min 1.24 10 . This matrix, together with the uncertainties given in Table 3, enables the determination of predictions (and of their associated uncertainties) for the threshold constants, for the hadronic phase shifts and amplitudes, and for the observables at any combination of the energy and of the scattering angle. Table 3 shows that the value of is consistent with 0; the quality of the fit would deteriorate very little if this parameter were set to 0. The value of G is very little correlated with the values of the other five parameters. However, these parameters (G , , π N , πΔ , and Z) are all strongly correlated with each other. (As expected, the correlations among the model parameters are smaller when no floating of data sets is allowed in the fit.) Our results for the seven model parameters have shown remarkable stability over the years, from the pe- riod when the fits were performed to old, outdated phase shifts (e.g., those of Refs. [39]) to the present times when the low-energy measurements are directly fitted to. The database itself has changed significantly over the past twenty or so years, with the important contributions from experiments performed at the meson factories by different research groups, which made use of different apparatuses and techniques in their experiments. Our method of applying the em corrections has also changed. Finally, various approaches have been implemented in the optimisation (e.g., in the choice of the minimisation function, from “standard” πN 2 functions [36], to robust statistics without any rejection of data [8], to the use of the Arndt-Roper formula [9] along with pruning the databases [1]). The observed stability is indicative of the robustness one obtains in the results when involving the ETH model in the analysis of the low-energy data. πN πN 2 3.4.2. Threshold Constants From the parameters of the ETH model and their uncer- tainties given in Table 3 for min 1.24 10, as well as the correlation matrix given in Table 4, we deter- mined the isoscalar and isovector s-wave scattering lengths and the isoscalar(isovector)-scalar(vector) p- wave scattering volumes. The results are: 12 321 00 12 321 00 12 3212 323 11 11 12 32 12323 11 11 1232 1232 1111 120.0033 12, 33 11 0.07698 60, 33 12240.2039 19, 33 33 11 220.1728 18, 3333 1212 3333 c c c c aa aa aaaa aa aa aaaa 3 1232 12 323 11 11 0.183019, 1111 0.06724 83. 3333 c c aaaa min p 1It must be mentioned that, in Ref. [1], the results for the different levels had been obtained by applying cuts to the distribution of the residuals, as this distribution came out in the 3 min p2.7010 min p 3 solu- tion. On the contrary, the analysis here is performed separately for the different levels. (12) min p 2The effects, which are seen when increasing the value from the equivalent of a 2.5 to a effect in the normal distribution, are due to the removal of the large JORAM95 π data set at 44.60 MeV in the analysis of the data using the K-matrix parameterisations of Section 3.1. A third data point from this data set (the measurement at 14.26˚) must e excluded at the last step of the iteration, thus resulting in the removal of the entire data set; were this data set not excluded, there would have been almost no change in the parameter values shown in Table 3. 3Some authors redefine 2 πNN , absorbing in it the factor . 4π Copyright © 2012 SciRes. JMP 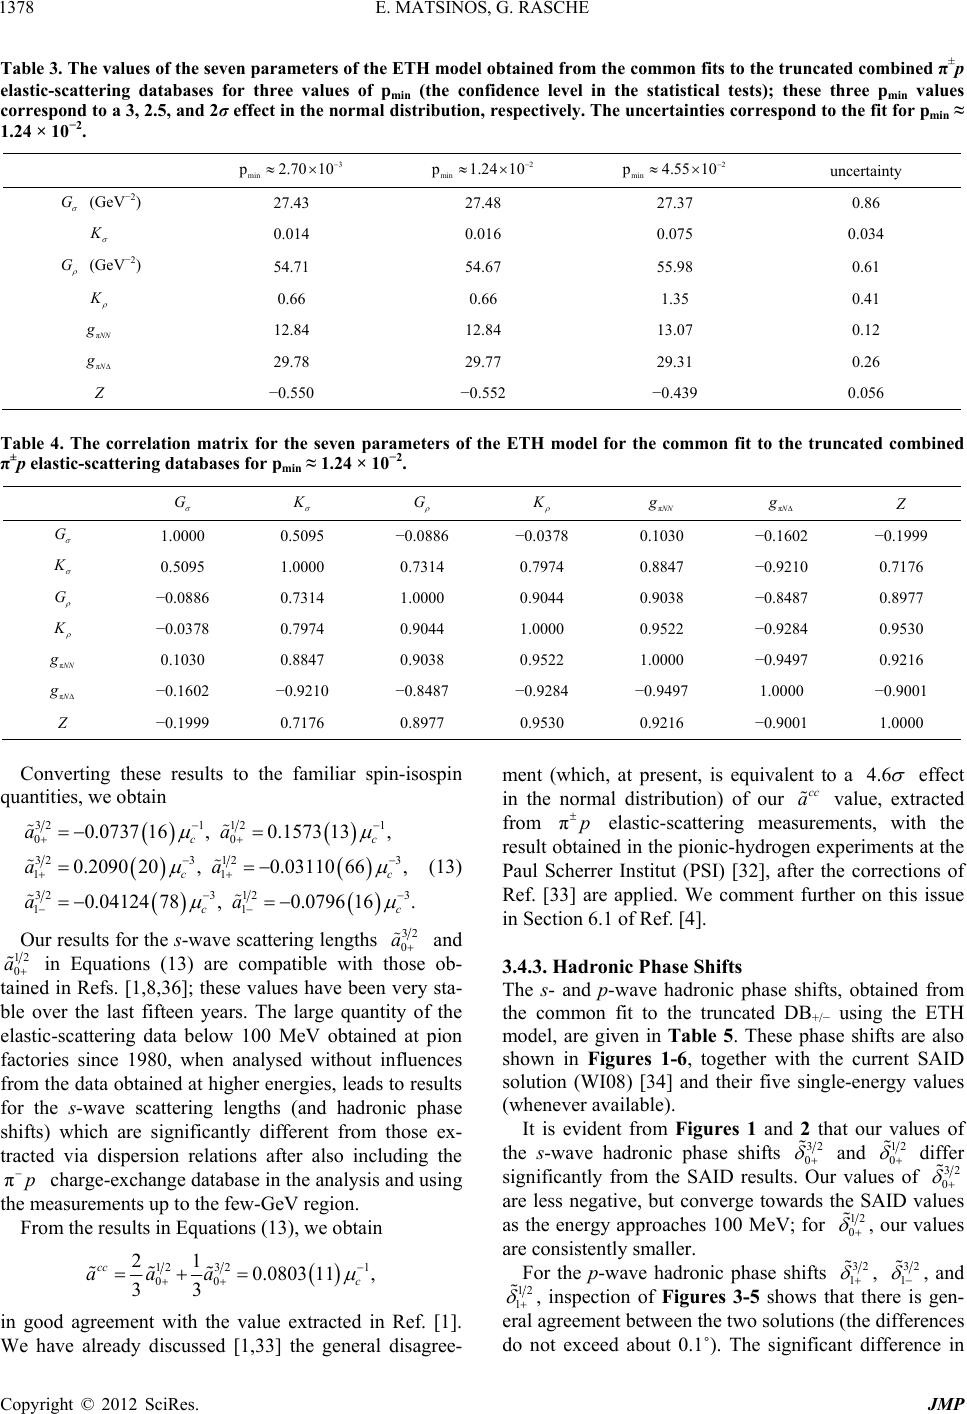 E. MATSINOS, G. RASCHE Copyright © 2012 Sci JMP 1378 min p2.min p1. Table 3. The values of the seven parameters of the ETH model obtained from the common fits to the truncated combined π±p elastic-scattering databases for three values of pmin (the confidence level in the statistical tests); these three pmin values correspond to a 3, 2.5, and 2σ effect in the normal distribution, respectively. The uncertainties correspond to the fit for pmin ≈ 1.24 × 10⁻². 3 7010 2 2410 2 min p4.5510 uncertainty (GeV−2) 27.43 27.48 27.37 0.86 G 0.014 0.016 0.075 0.034 G (GeV−2) 54.71 54.67 55.98 0.61 0.66 0.66 1.35 0.41 πNN 12.84 12.84 13.07 0.12 πN 29.78 29.77 29.31 0.26 Z −0.550 −0.552 −0.439 0.056 Table 4. The correlation matrix for the seven parameters of the ETH model for the common fit to the truncated combined π±p elastic-scattering databases for pmin ≈ 1.24 × 10⁻². G G πNN πN G 1.0000 0.5095 −0.0886 −0.0378 0.1030 −0.1602 −0.1999 0.5095 1.0000 0.7314 0.7974 0.8847 −0.9210 0.7176 G −0.0886 0.7314 1.0000 0.9044 0.9038 −0.8487 0.8977 −0.0378 0.7974 0.9044 1.0000 0.9522 −0.9284 0.9530 πNN 0.1030 0.8847 0.9038 0.9522 1.0000 −0.9497 0.9216 −0.1602 −0.9210 −0.8487 −0.9284 −0.9497 1.0000 −0.9001 πN −0.1999 0.7176 0.8977 0.9530 0.9216 −0.9001 1.0000 Converting these results to the familiar spin-isospin quantities, we obtain Res. 321 121 3 3 3 13, 110 66, .0796 16. c c c 00 32 3 12 11 32312 11 0.0737 16,0.157 0.2090 20,0.03 0.04124 78,0 c c c aa aa aa (13) Our results for the s-wave scattering lengths 32 a0 and 12 a πp 0 in Equations (13) are compatible with those ob- tained in Refs. [1,8,36]; these values have been very sta- ble over the last fifteen years. The large quantity of the elastic-scattering data below 100 MeV obtained at pion factories since 1980, when analysed without influences from the data obtained at higher energies, leads to results for the s-wave scattering lengths (and hadronic phase shifts) which are significantly different from those ex- tracted via dispersion relations after also including the charge-exchange database in the analysis and using the measurements up to the few-GeV region. From the results in Equations (13), we obtain 1 21 803 11, c 12 32 00 0.0 33 cc aaa 4.6 in good agreement with the value extracted in Ref. [1]. We have already discussed [1,33] the general disagree- ment (which, at present, is equivalent to a effect in the normal distribution) of our value, extracted from elastic-scattering measurements, with the result obtained in the pionic-hydrogen experiments at the Paul Scherrer Institut (PSI) [32], after the corrections of Ref. [33] are applied. We comment further on this issue in Section 6.1 of Ref. [4]. cc a πp 3.4.3. Hadronic Phase Shifts The s- and p-wave hadronic phase shifts, obtained from the common fit to the truncated DB+/− using the ETH model, are given in Table 5. These phase shifts are also shown in Figures 1-6, together with the current SAID solution (WI08) [34] and their five single-energy values (whenever available). It is evident from Figures 1 and 2 that our values of the s-wave hadronic phase shifts 32 0 and 12 0 differ significantly from the SAID results. Our values of 32 0 are less negative, but converge towards the SAID values as the energy approaches 100 MeV; for 12 0 , our values are consistently smaller. For the p-wave hadronic phase shifts 32 1 , 32 1 , and 12 1 , inspection of Figures 3-5 shows that there is gen- eral agreement between the two solutions (the differences do not exceed about 0.1˚). The significant difference in  E. MATSINOS, G. RASCHE 1379 Table 5. The values of the six s- and p-wave em-modified hadronic phase shifts (in degrees), obtained on the basis of the re- sults of Tables 3 (for pmin ≈ 1.24 × 10⁻²) and 4. T (MeV) 3/ 0 2 1/ 2 0 (S31) 3/ 1 (S11) 2 3/ 1 (P33) 2 1/ 2 1 (P31) 1/ 2 1 (P13) (P11) 20 −2.375 (34) 4.189 (27) 1.2787 (94) −0.2239 (45) −0.1588 (37) −0.3687 (80) 25 −2.772 (36) 4.673 (29) 1.817 (12) −0.3083 (63) −0.2153 (52) −0.486 (11) 30 −3.164 (37) 5.105 (30) 2.431 (15) −0.3996 (83) −0.2747 (68) −0.602 (14) 35 −3.555 (37) 5.496 (31) 3.122 (18) −0.497 (11) −0.3361 (86) −0.714 (17) 40 −3.949 (37) 5.852 (33) 3.892 (21) −0.599 (13) −0.399 (11) −0.820 (20) 45 −4.345 (37) 6.180 (34) 4.744 (23) −0.706 (16) −0.463 (13) −0.918 (23) 50 −4.746 (37) 6.482 (37) 5.683 (24) −0.816 (18) −0.527 (15) −1.006 (27) 55 −5.151 (38) 6.760 (39) 6.715 (26) −0.931 (21) −0.591 (17) −1.084 (30) 60 −5.561 (39) 7.018 (42) 7.845 (27) −1.049 (25) −0.655 (20) −1.150 (34) 65 −5.977 (41) 7.256 (46) 9.081 (29) −1.169 (28) −0.719 (23) −1.204 (38) 70 −6.397 (44) 7.476 (51) 10.433 (31) −1.293 (32) −0.782 (26) −1.244 (42) 75 −6.823 (48) 7.679 (56) 11.909 (35) −1.419 (36) −0.844 (29) −1.271 (46) 80 −7.254 (53) 7.865 (61) 13.519 (40) −1.547 (41) −0.906 (32) −1.283 (50) 85 −7.690 (59) 8.036 (67) 15.277 (48) −1.678 (45) −0.966 (36) −1.281 (55) 90 −8.131 (67) 8.192 (74) 17.193 (59) −1.811 (50) −1.026 (39) −1.263 (60) 95 −8.577 (75) 8.334 (81) 19.282 (73) −1.946 (55) −1.084 (43) −1.229 (66) 100 −9.028 (85) 8.462 (89) 21.556 (90) −2.083 (61) −1.141 (48) −1.178 (71) 3/2 0+ Figure 1. The em-modified hadronic phase shift (S31) from the present work (solid curve); the band around our solu- tion indicates 1σ uncertainties. Shown also is the current SAID solution (WI08) [34] (dashed curve), along with their five sin- gle-energy values (at T = 20, 30, 47, 66, and 90 MeV). Copyright © 2012 SciRes. JMP  E. MATSINOS, G. RASCHE 1380 1/ 2 0+ Figure 2. The em-modified hadronic phase shift (S11) from the present work (solid curve); the band around our solu- tion indicates 1σ uncertainties. Shown also is the current SAID solution (WI08) [34] (dashed curve), along with their five sin- gle-energy values (at T = 20, 30, 47, 66, and 90 MeV). 3/2 1+ Figure 3. The em-modified hadronic phase shift (P33) from the present work (solid curve); the band around our solu- tion indicates 1σ uncertainties. Shown also is the current SAID solution (WI08) [34] (dashed curve), along with their five sin- gle-energy values (at T = 20, 30, 47, 66, and 90 MeV). To enable the meaningful comparison of the values contained in this figure, an energy-dependent baseline δR (= (0.20 × T + 1.54) T × 10−2, with T in MeV and δR (T) in degrees) was subtracted from all data. Copyright © 2012 SciRes. JMP  E. MATSINOS, G. RASCHE 1381 3/2 1 Figure 4. The em-modified hadronic phase shift (P31) from the present work (solid curve); the band around our solu- tion indicates 1σ uncertainties. Shown also is the current SAID solution (WI08) [34] (dashed curve). 1/ 2 1+ Figure 5. The em-modified hadronic phase shift (P13) from the present work (solid curve); the band around our solu- tion indicates 1σ uncertainties. Shown also is the current SAID solution (WI08) [34] (dashed curve). Copyright © 2012 SciRes. JMP 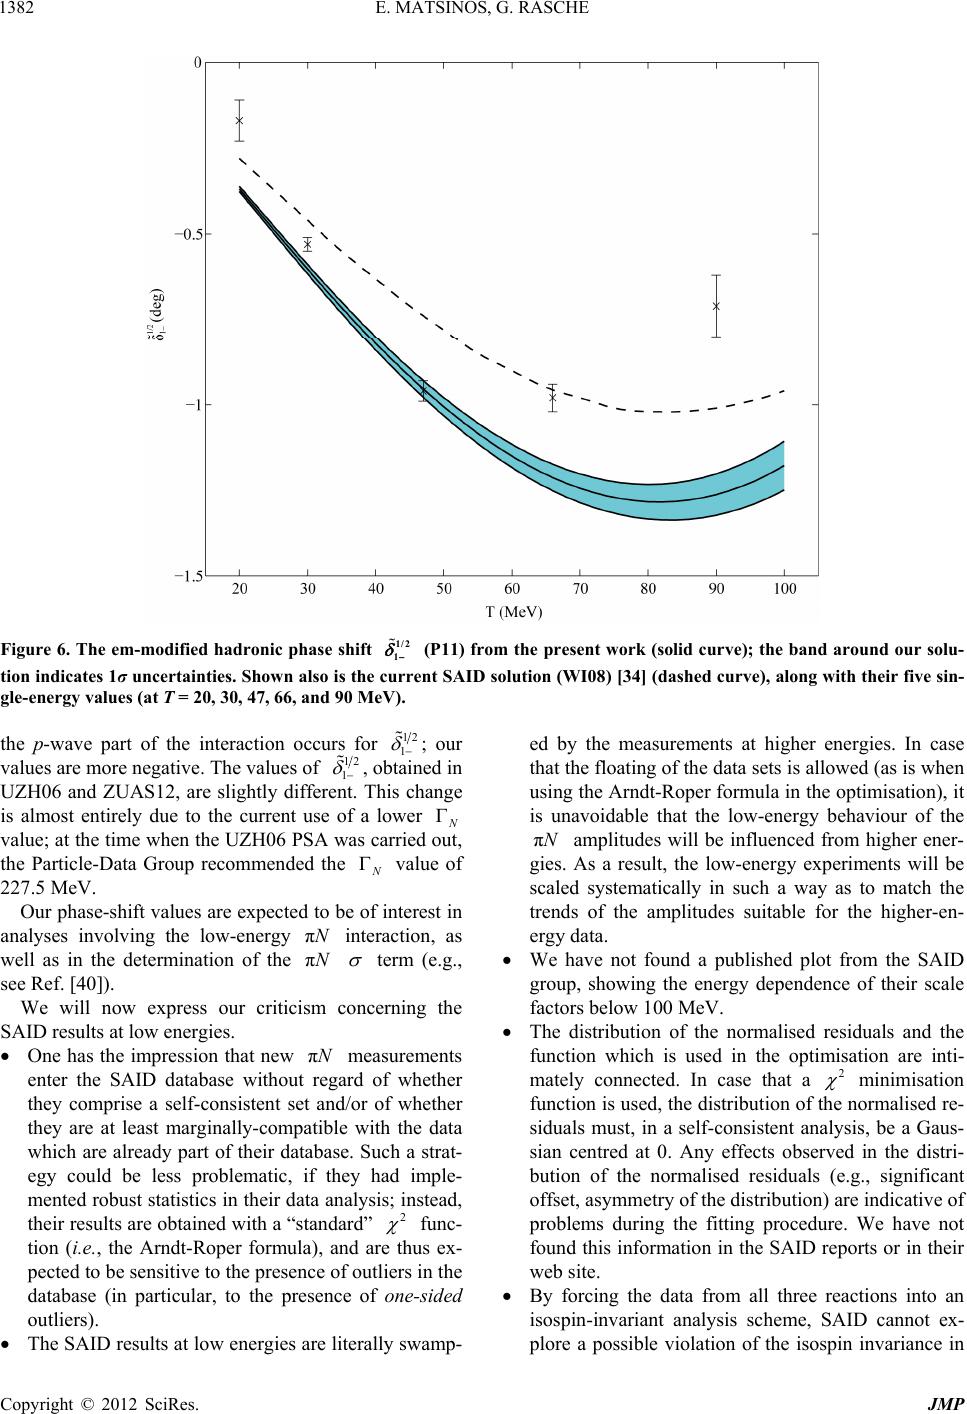 E. MATSINOS, G. RASCHE Copyright © 2012 SciRes. JMP 1382 1/ 2 1 Figure 6. The em-modified hadronic phase shift (P11) from the present work (solid curve); the band around our solu- tion indicates 1σ uncertainties. Shown also is the current SAID solution (WI08) [34] (dashed curve), along with their five sin- gle-energy values (at T = 20, 30, 47, 66, and 90 MeV). the p-wave part of the interaction occurs for 12 1 ; our values are more negative. The values of 12 1 , obtained in UZH06 and ZUAS12, are slightly different. This change is almost entirely due to the current use of a lower value; at the time when the UZH06 PSA was carried out, the Particle-Data Group recommended the πN πN value of 227.5 MeV. Our phase-shift values are expected to be of interest in analyses involving the low-energy interaction, as well as in the determination of the term (e.g., see Ref. [40]). We will now express our criticism concerning the SAID results at low energies. One has the impression that new πN measurements enter the SAID database without regard of whether they comprise a self-consistent set and/or of whether they are at least marginally-compatible with the data which are already part of their database. Such a strat- egy could be less problematic, if they had imple- mented robust statistics in their data analysis; instead, their results are obtained with a “standard” 2 func- tion (i.e., the Arndt-Roper formula), and are thus ex- pected to be sensitive to the presence of outliers in the database (in particular, to the presence of one-sided outliers). The SAID results at low energies are literally swamp- ed by the measurements at higher energies. In case that the floating of the data sets is allowed (as is when using the Arndt-Roper formula in the optimisation), it is unavoidable that the low-energy behaviour of the πN amplitudes will be influenced from higher ener- gies. As a result, the low-energy experiments will be scaled systematically in such a way as to match the trends of the amplitudes suitable for the higher-en- ergy data. We have not found a published plot from the SAID group, showing the energy dependence of their scale factors below 100 MeV. The distribution of the normalised residuals and the function which is used in the optimisation are inti- mately connected. In case that a 2 minimisation function is used, the distribution of the normalised re- siduals must, in a self-consistent analysis, be a Gaus- sian centred at 0. Any effects observed in the distri- bution of the normalised residuals (e.g., significant offset, asymmetry of the distribution) are indicative of problems during the fitting procedure. We have not found this information in the SAID reports or in their web site. By forcing the data from all three reactions into an isospin-invariant analysis scheme, SAID cannot ex- plore a possible violation of the isospin invariance in  E. MATSINOS, G. RASCHE 1383 the hadronic part of the πN interaction. 3.4.4. Scale Factors and Normalised Residuals We will now comment on the distribution of the scale factors z πp πp obtained from the common fits using the ETH model. In a “healthy” fit made on the basis of the Arndt-Roper formula, the data sets which must be scaled “upwards” should (more or less) be balanced by those which must be scaled “downwards”. Additionally, the energy dependence of the scale factors over the energy range of the analysis should not be significant. If these prerequisites are not fulfilled, the parametric forms used in the fits cannot adequately reproduce the data over the entire energy range. For both the ( Figure 7) and ( Figure 8) elastic-scattering data sets, the values of z which lie above and below 1 roughly balance each other and there is no discernible energy dependence4. Evidently, there is no subrange of the entire 30 to 100 MeV energy interval in which the data is better or worse fitted than for the rest of the range. A second issue which must be investigated in a fit in- volving the minimisation of any χ2 function is whether the distribution of the normalised residuals rij, defined as exp exp th ij ij ij zy y y ij r (see Equation (1)), evaluated on the basis of the optimal parameter values, is Gaussian5. In practice, one fits a Gaussian function to the distribution of the normalised residuals, i.e., 2 e, Br r fr A 2 and investigates the quality of the fit (expressed through the corresponding value and the NDF in the fit), as well as the asymmetry of the fitted distribution (e.g., ex- pressed through the deviation of the extracted value of r from 0). The distribution of the normalised residuals is shown in Figure 9, along with the optimal Gaussian function. The 2 value of this fit was 33.2 for 22 DOF in the fit, whereas 2 1.9 4.710r 0.038B 2 , i.e., compatible with 0. For the sake of completeness, we also give the optimal value and the uncertainty of the parameter B: ; the expectation value for B is 0.5. 0.544 3.4.5. Reproduction of the MEIER04 Measurements We will now discuss the MEIER04 measurements (which have not been included in our fits). We have created Monte-Carlo predictions for the AP corresponding to each of their 28 data points. For the three experimental data sets, the resulting values of min were 12.5, 7.0, and 16.1, for 12, 6, and 10 DOF, respectively. The val- ues of the scale factor for the three data sets (in the same order) are 1.011, 0.973, and 1.039; the reported normalisation uncertainty of the data is 3.5%. It is evi- dent that our hadronic phase shifts reproduce the MEI- ER04 measurements very well; even the smallest p-value does not fall below . This is a good test of the consistency of our approach in describing the energy and angular dependence of the elas- tic-scattering data. 2 9.6 10 πp πp πN 2 3.4.6. Reproduction of the BERTIN76 Measurements We will now comment on the reproduction of the old measurements of Ref. [29], which are “traditionally” considered outliers in almost all modern PSAs. Reported in Ref. [29] were DCS measurements obtained in a broad angular interval, at seven beam energies (20.80, 30.50, 39.50, 51.50, 67.40, 81.70, and 95.90 MeV). The experimental group did not report any normalisation un- certainties for their measurements; it cannot be excluded that, at those times, the absolute normalisation was not seriously investigated in the experiments. We assigned rough normalisation uncertainties to the BERTIN76 data, on the basis of the values obtained from the modern low-energy experiments which properly re- ported this quantity, and analysed these measurements as if they comprised the entire DB+ at low energies. The analysis in terms of our general K-matrix parameterisa- tions of Section 3.1 revealed that the data set at 67.40 MeV had to be eliminated due to its (very bad) shape. We were able to fit the remaining data successfully, and obtained the final value of 55.0 for 53 DOF in the fit. We subsequently investigated how well the phase-shift solution of the present study reproduces the BERTIN76 data; it failed. The basic problem with the BERTIN76 measurements lies with their absolute normalisation, not with their shape (though the shapes of the data sets at 39.50 and at 95.90 MeV do not pass our mi n criterion). For instance, for the data set at 20.80 MeV, j ˆ1.349z when the overall uncertainty ˆ Δ z ˆ (defined at the end of Section 2.2) is equal to 0.081; this is the most striking discrepancy in the data. The extracted z ˆ1.027z factors de- crease almost linearly with T, reaching j at 95.90 MeV. In view of these large energy-dependent effects in their absolute normalisation, we will continue excluding the BERTIN76 data in our PSAs. 4. Discussion In the present work, comprising the first of three papers 4The linear fit to the scale factors for the π+p reaction yields the inter- cept of 1.012 ± 0.018 and the slope of (−0.9 ± 2.4) × 10−4 MeV−1; the linear fit to the scale factors for the π−p elastic-scattering reaction yields the intercept of 1.031 ± 0.018 and the slope of (−4.5 ± 2.4) × 10−4 MeV−1. 5Of course, the values of 1 j zz j , appearing in the second term on the rhs of Equation (1), must also be included in the distribution of the no malised residuals. Copyright © 2012 SciRes. JMP  E. MATSINOS, G. RASCHE Copyright © 2012 SciRes. JMP 1384 Figure 7. The scale factors zj for the π+p data, obtained from the common fit to the truncated combined π±p elastic-scattering databases using the ETH model (see Section 3.4). The values, corresponding to the two data sets which were freely floated (see Table 1), have not been included; in the case of free floating, 20 jsc χ. Figure 8. The scale factors zj for the π–p elastic-scattering data, obtained from the common fit to the truncated combined π±p elastic-scattering databases using the ETH model (see Section 3.4). The value, corresponding to the data set which was freely floated (see Table 2), has not been included; in the case of free floating, 20 jsc χ.  E. MATSINOS, G. RASCHE 1385 Figure 9. The distribution of the normalised residuals, obtained from the common fit to the truncated combined π±p elastic- scattering databases using the ETH model (see Section 3.4). Also shown (solid curve) is the optimal Gaussian fit to the data. dealing with issues of the pion-nucleon () interaction below pion laboratory kinetic energy of 100 MeV, we report the results of a new phase-shift analysis (PSA) of the elastic-scattering data, using the electromag- netic (em) corrections of Refs. [5]. πN πp 2 min j 2 There are two main differences to the approach we set forth in our previous PSA [1], both pertaining to the me- thod for the exclusion of outliers, single data points and entire data sets, in the optimisation phase. We now per- form only one test for each data set on the only rele- vant quantity, namely on its contribution to the overall . In Ref. [1], we instead performed several tests (on shape, normalisation, etc.) for each data set; the use of only one test led to the exclusion of fewer data compared to Ref. [1]. The second difference concerns the imposition of a more stringent acceptance criterion of the null hypothesis in the statistical tests. Herein, we raised the minimal p-value (min ) for the acceptance of the null hypothesis from the equivalent of a 3 to a 2.5 effect in the normal distribution; the latter value is closer to the “common” choice (of most statisticians) as the outset of statistical significance. Similarly to Ref. [1], we first investigated the self- consistency of the low-energy elastic-scattering databases, via two separate analyses carried out (first) on the and (subsequently) on the elastic-scat- tering data using simple K-matrix parameterisations. We found that it is possible to obtain self-consistent data- bases by removing the measurements of two and one data sets, as well as a few single data points; the removal of these outliers resulted in enormous reduc- tions in the minimal πp πp πp πp πp 2 values for the separate fits to the two elastic-scattering databases using the K-matrix parameterisations. We give all the details concerning the accepted data sets in Tables 1 and 2; these details may be useful in other analyses. The aforementioned results were obtained without imposing any theoretical constraints, save for the expected low-energy behaviour of the s- and p-wave K-matrix elements and the Breit-Wigner form (see Equations (9) and (10)) for the contributions of the resonant terms. The ETH model of Ref. [38], based on s- and u-chan- nel diagrams with N and in the intermediate states, and and t-channel exchanges, was subsequently fitted to the truncated combined elastic-scattering databases. The model-parameter values showed reason- able stability when subjected to different criteria for the removal of data (see Table 3). Our result for the pseu- dovector coupling constant is πp πNN 0.07260.0014 . On the basis of the results of the model fits, we obtained the em-modified hadronic scattering lengths and volumes (see Section 3.4.2), as well as the s- and p-wave em- modified hadronic phase shifts up to T = 100 MeV (see Table 5 and Figures 1-6). Large differences in the s-wave part of the interaction were found when compar- Copyright © 2012 SciRes. JMP  E. MATSINOS, G. RASCHE 1386 ing our hadronic phase shifts with the current SAID solu- tion (WI08) [34] (see Figures 1 and 2); there is general agreement in the p waves, save for the em-modified ha- dronic phase shift 12 1 Apart from analysing our results in terms of the as- sumed confidence level in the statistical tests, we also investigated the possibility of a bias in the analysis. To this end, we examined the energy dependence of the scale factors . zπp πp ˆ , shown in Figures 7 (for the data) and 8 (for the elastic-scattering data), as well as the characteristics of the distribution of the normalised residuals (Figure 9). We did not find any significant de- viation for these quantities from the expectations in a successful optimisation. We are grateful to G. J. Wagner for drawing our atten- tion to the statistical uncertainties of the scale factors z for free floating (see Equation (6)). We would like to thank W. S. Woolcock for his comments and sugges- tions. REFERENCES [1] E. Matsinos, W. S. Woolcock, G. C. Oades, G. Rasche and A. Gashi, “Phase-Shift Analysis of Low-Energy πp Elastic-Scattering Data,” Nuclear Physics A, Vol. 778, No. 1-2, 2006, pp. 95-123. doi:10.1016/j.nuclphysa.2006.07.040 [2] E. Matsinos and G. Rasche, “Analysis of the Low-Energy πp Elastic-Scattering Data of the CHAOS Collabora- tion,” 2012. http://arxiv.org/abs/1203.3635 [3] H. Denz, et al., “π±p Differential Cross Sections at Low Energies,” Physics Letters B, Vol. 633, No. 2-3, 2006, pp. 209-213. doi:10.1016/j.physletb.2005.12.017 [4] E. Matsinos and G. Rasche, “Analysis of the Low-Energy πp Charge-Exchange Data,” 2012. http://arxiv.org/abs/1203.3856 [5] A. Gashi, E. Matsinos, G. C. Oades, G. Rasche and W. S. Woolcock, “Electromagnetic Corrections to the Hadronic Phase Shifts in Low Energy π+p Elastic Scattering,” Nu- clear Physics A, Vol. 686, No. 1-4, 2001, pp. 447-462. doi:10.1016/S0375-9474(00)00603-5; A. Gashi, E. Matsi- nos, G. C. Oades, G. Rasche and W. S. Woolcock, “Elec- tromagnetic Corrections for the Analysis of Low Energy π−p Scattering Data,” Nuclear Physics A, Vol. 686, No. 1-4, 2001, pp. 463-477. doi:10.1016/S0375-9474(00)00604-7 [6] K. Nakamura, et al. (Particle Data Group), “Review of Particle Physics,” Journal of Physics G, Vol. 37, No. 7A, 2010, Article ID: 075021. doi:10.1088/0954-3899/37/7A/075021 [7] W. R. Gibbs, Li Ai and W. B. Kaufmann, “Isospin Breaking in Low-Energy Pion-Nucleon Scattering,” Physical Review Letters, Vol. 74, No. 19, 1995, pp. 3740-3743. doi:10.1103/PhysRevLett.74.3740 [8] E. Matsinos, “Isospin Violation in the πN System at Low Energies,” Physical Review C, Vol. 56, No. 6, 1997, pp. 3014-3025. doi:10.1103/PhysRevC.56.3014 [9] R. A. Arndt and L. D. Roper, “The Use of Partial-Wave Representations in the Planning of Scattering Measure- ments. Application to 330 MeV np Scattering,” Nuclear Physics B, Vol. 50, No. 1, 1972, pp. 285-300. doi:10.1016/S0550-3213(72)80019-1 [10] E.G. Auld, et al., “π+ − p Elastic Scattering at 47.9 MeV,” Canadian Journal of Physics, Vol. 57, No. 1, 1979, pp. 73-78. doi:10.1139/p79-008 [11] B. G. Ritchie, et al., “π+p Scattering at 65 to 140 MeV,” Physics Letters B, Vol. 125, No. 2-3, 1983, pp. 128-132. doi:10.1016/0370-2693(83)91251-0 [12] J. S. Frank, et al., “Measurement of Low-Energy Elastic π±p Differential Cross Sections,” Physical Review D, Vol. 28, No. 7, 1983, pp. 1569-1585. doi:10.1103/PhysRevD.28.1569 [13] J. T. Brack, et al., “πp Elastic Scattering from 67 to 139 MeV,” Physical Review C, Vol. 34, No. 5, 1986, pp. 1771-1778. doi:10.1103/PhysRevC.34.1771 [14] J. T. Brack, et al., “Large-Angle π+p Elastic Scattering at 66.8 MeV,” Physical Review C, Vol. 38, No. 5, 1988, pp. 2427-2429. doi:10.1103/PhysRevC.38.2427 [15] U. Wiedner, et al., “Hidden Strangeness in the Proton? Determination of the Real Part of the Isospin-Even For- ward-Scattering Amplitude of Pion-Nucleon Scattering at 54.3 MeV,” Physical Review D, Vol. 40, No. 11, 1989, pp. 3568-3581. doi:10.1103/PhysRevD.40.3568 [16] J. T. Brack, et al., “Absolute Differential Cross Sections for π±p Elastic Scattering at 30 ≤ Tπ ≤ 67 MeV,” Physical Review C, Vol. 41, No. 5, 1990, pp. 2202-2214. doi:10.1103/PhysRevC.41.2202 [17] J. T. Brack, et al., “Forward Angle π±p Elastic Scattering Differential Cross Sections at Tπ = 87 to 139 MeV,” Physical Review C, Vol. 51, No. 2, 1995, pp. 929-936. doi:10.1103/PhysRevC.51.929 [18] Ch. Joram, et al., “Low-Energy Differential Cross Sec- tions of Pion-Proton (π±p) Scattering. I. The Isospin-Even Forward Scattering Amplitude at Tπ = 32.2 and 44.6 MeV,” Physical Review C, Vol. 51, 1995, pp. 2144-2158. doi:10.1103/PhysRevC.51.2144; Ch. Joram, et al., “Low- Energy Differential Cross Sections of Pion-Proton (π±p) Scattering. II. Phase Shifts at Tπ = 32.7, 45.1, and 68.6 MeV,” Physical Review C, Vol. 51, No. 4, 1995, pp. 2159-2165. doi:10.1103/PhysRevC.51.2159 [19] M. E. Sevior, et al., “Analyzing Powers in πp Elastic Scattering from Tπ = 98 to 263 MeV,” Physical Review C, Vol. 40, No. 6, 1989, pp. 2780-2788. doi:10.1103/PhysRevC.40.2780 [20] R. Wieser, et al., “Measurement of the πp Analyzing Power at 68.3 MeV,” Physical Review C, Vol. 54, No. 4, 1996, pp. 1930-1934. doi:10.1103/PhysRevC.54.1930 [21] B. J. Kriss, et al., “Pion-Proton Integral Cross Section Measurements,” πN Newsletter, Vol. 12, 1997, pp. 20-25; B. J. Kriss, et al., “Pion-Proton Integral Cross Sections at Tπ = 40 to 284 MeV,” Physical Review C, Vol. 59, No. 3, 1999, pp. 1480-1487. doi:10.1103/PhysRevC.59.1480 [22] E. Friedman, “Partial Total πN Cross Sections,” πN New- sletter, Vol. 15, 1999, pp. 37-42. Copyright © 2012 SciRes. JMP  E. MATSINOS, G. RASCHE Copyright © 2012 SciRes. JMP 1387 [23] A. A. Carter, J. R. Williams, D. V. Bugg, P. J. Bussey and D. R. Dance, “The Total Cross Sections for Pion-Proton Scattering between 70 MeV and 290 MeV,” Nuclear Physics B, Vol. 26, No. 3, 1971, pp. 445-460. doi:10.1016/0550-3213(71)90188-X [24] E. Pedroni, et al., “A Study of Charge Independence and Symmetry from π+ and π− Total Cross Sections on Hy- drogen and Deuterium near the 3,3 Resonance,” Nuclear Physics A, Vol. 300, No. 2, 1978, pp. 321-347. doi:10.1016/0375-9474(78)96136-5 [25] M. Janousch, et al., “Destructive Interference of s and p Waves in 180˚ π−p Elastic Scattering,” Physics Letters B, Vol. 414, No. 3-4, 1997, pp. 237-241. doi:10.1016/S0370-2693(97)01169-6 [26] J. C. Alder, et al., “Measurement of the Asymmetry Pa- rameter A in π−p Elastic and Charge-Exchange Scattering at Pion Energies Tπ = 98, 238, 292, and 310 MeV,” Phys- ical Review D, Vol. 27, No. 5, 1983, pp. 1040-1055. doi:10.1103/PhysRevD.27.1040 [27] G. J. Hofman, et al., “Analyzing Powers for π Elastic Scattering between 87 and 263 MeV,” Physical Review C, Vol. 58, No. 6, 1998, pp. 3484-3493. doi:10.1103/PhysRevC.58.3484 [28] J. D. Patterson, et al., “Analyzing Powers for πp Elastic Scattering between 57 and 139 MeV,” Physical Review C, Vol. 66, No. 2, 2002, Article ID: 025207. doi:10.1103/PhysRevC.66.025207 [29] P. Y. Bertin, et al., “π+p Scattering below 100 MeV,” Nuclear Physics B, Vol. 106, 1976, pp. 341-354. doi:10.1016/0550-3213(76)90383-7 [30] P. J. Bussey, et al., “πp Elastic Scattering from 88 to 292 MeV,” Nuclear Physics B, Vol. 58, No. 2, 1973, pp. 363-377. doi:10.1016/0550-3213(73)90589-0 [31] R. Meier, et al., “Low Energy Analyzing Powers in Pion-Proton Elastic Scattering,” Physics Letters B, Vol. 588, No. 3-4, 2004, pp. 155-162. doi:10.1016/j.physletb.2004.02.071 [32] H.-Ch. Schröder, et al., “The Pion-Nucleon Scattering Lengths from Pionic Hydrogen and Deuterium,” Euro- pean Physical Journal C, Vol. 21, No. 3, 2001, pp. 473- 488. doi:10.1007/s100520100754 [33] G. C. Oades, G. Rasche, W. S. Woolcock, E. Matsinos and A. Gashi, “Determination of the s-Wave Pion-Nu- cleon Threshold Scattering Parameters from the Results of Experiments on Pionic Hydrogen,” Nuclear Physics A, Vol. 794, No. 1-2, 2007, pp. 73-86. doi:10.1016/j.nuclphysa.2007.07.007 [34] R. A. Arndt, W. J. Briscoe, I. I. Strakovsky and R. L. Workman, “Extended Partial-Wave Analysis of πN Scat- tering Data,” Physical Review C, Vol. 74, No. 4, 2006, Article ID: 045205. doi:10.1103/PhysRevC.74.045205 [35] F. James, “MINUIT—Function Minimization and Error Analysis,” CERN Program Library Long Writeup D506. [36] N. Fettes and E. Matsinos, “Analysis of Recent π+p Low- Energy Differential Cross-Section Measurements,” Phys- ical Review C, Vol. 55, No. 1, 1997, pp. 464-473. doi:10.1103/PhysRevC.55.464 [37] T. E. O. Ericson and W. Weise, “Pions and Nuclei,” Cla- rendon Press, Oxford, 1988. [38] P. F. A. Goudsmit, H. J. Leisi, E. Matsinos, B. L. Birbrair and A. B. Gridnev, “The Extended Tree-Level Model for the Pion-Nucleon Interaction,” Nuclear Physics A, Vol. 575, No. 4, 1994, pp. 673-706. doi:10.1016/0375-9474(94)90162-7 [39] R. Koch and E. Pietarinen, “Low-Energy πN Partial Wave Analysis,” Nuclear Physics A, Vol. 336, No. 3, 1980, pp. 331-346. doi:10.1016/0375-9474(80)90214-6; R. Koch, “A Calculation of Low-Energy πN Partial Waves Based on Fixed-t Analyticity,” Nuclear Physics A, Vol. 448, No. 4, 1986, pp. 707-731. doi:10.1016/0375-9474(86)90438-0 [40] J. M. Alacrón, J. M. Camalich and J. A. Oller, “Chiral Representation of the πN Scattering Amplitude and the Pion-Nucleon Sigma Term,” Physical Review D, Vol. 85, No. 5, 2012, Article ID: 051503. doi:10.1103/PhysRevD.85.051503
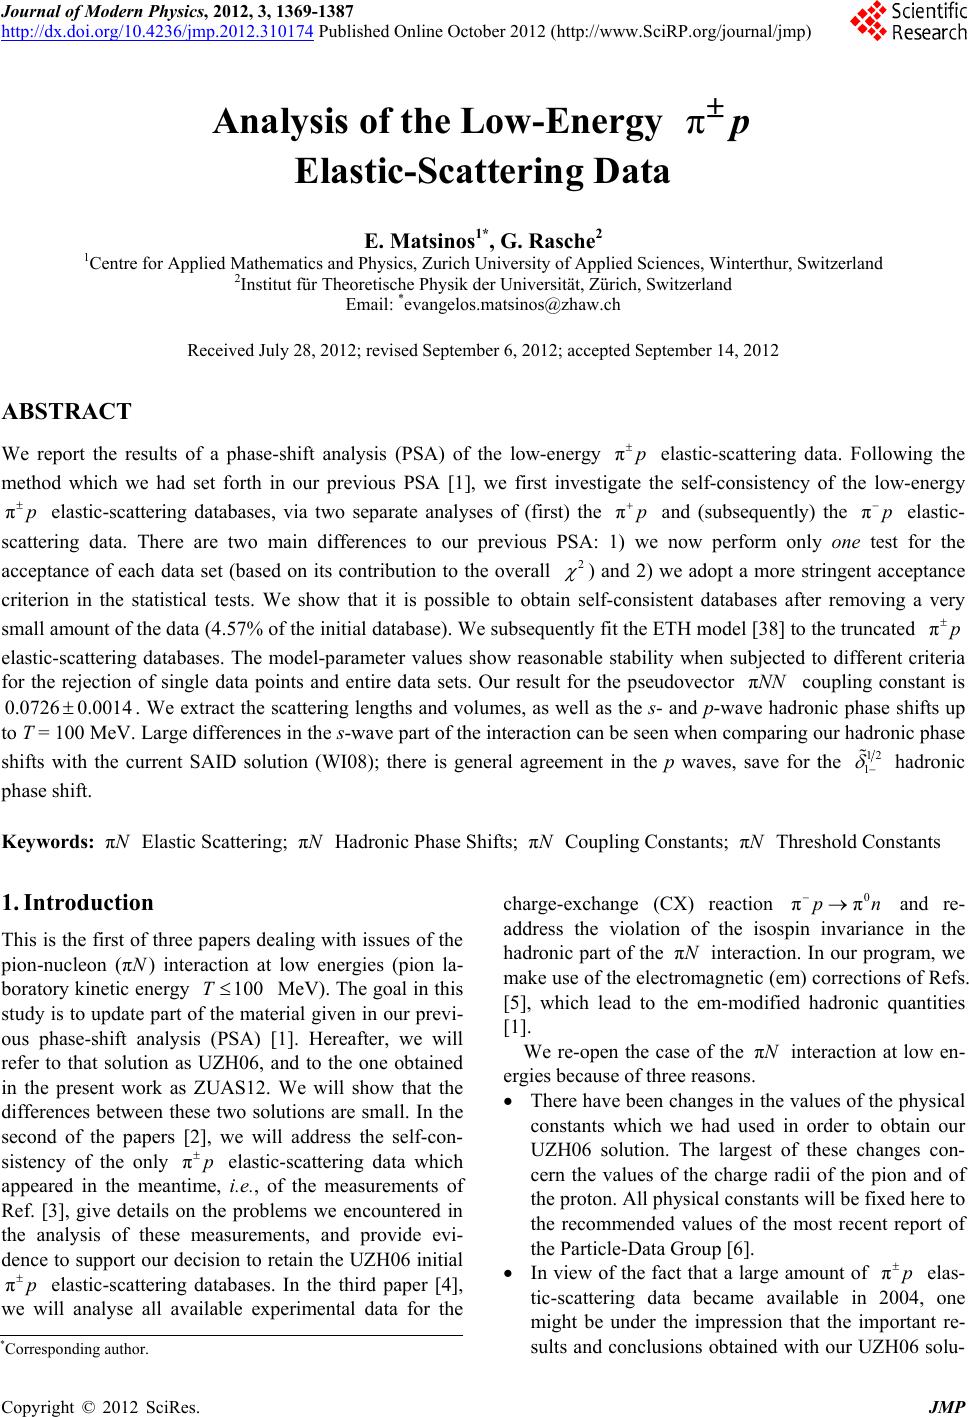
|