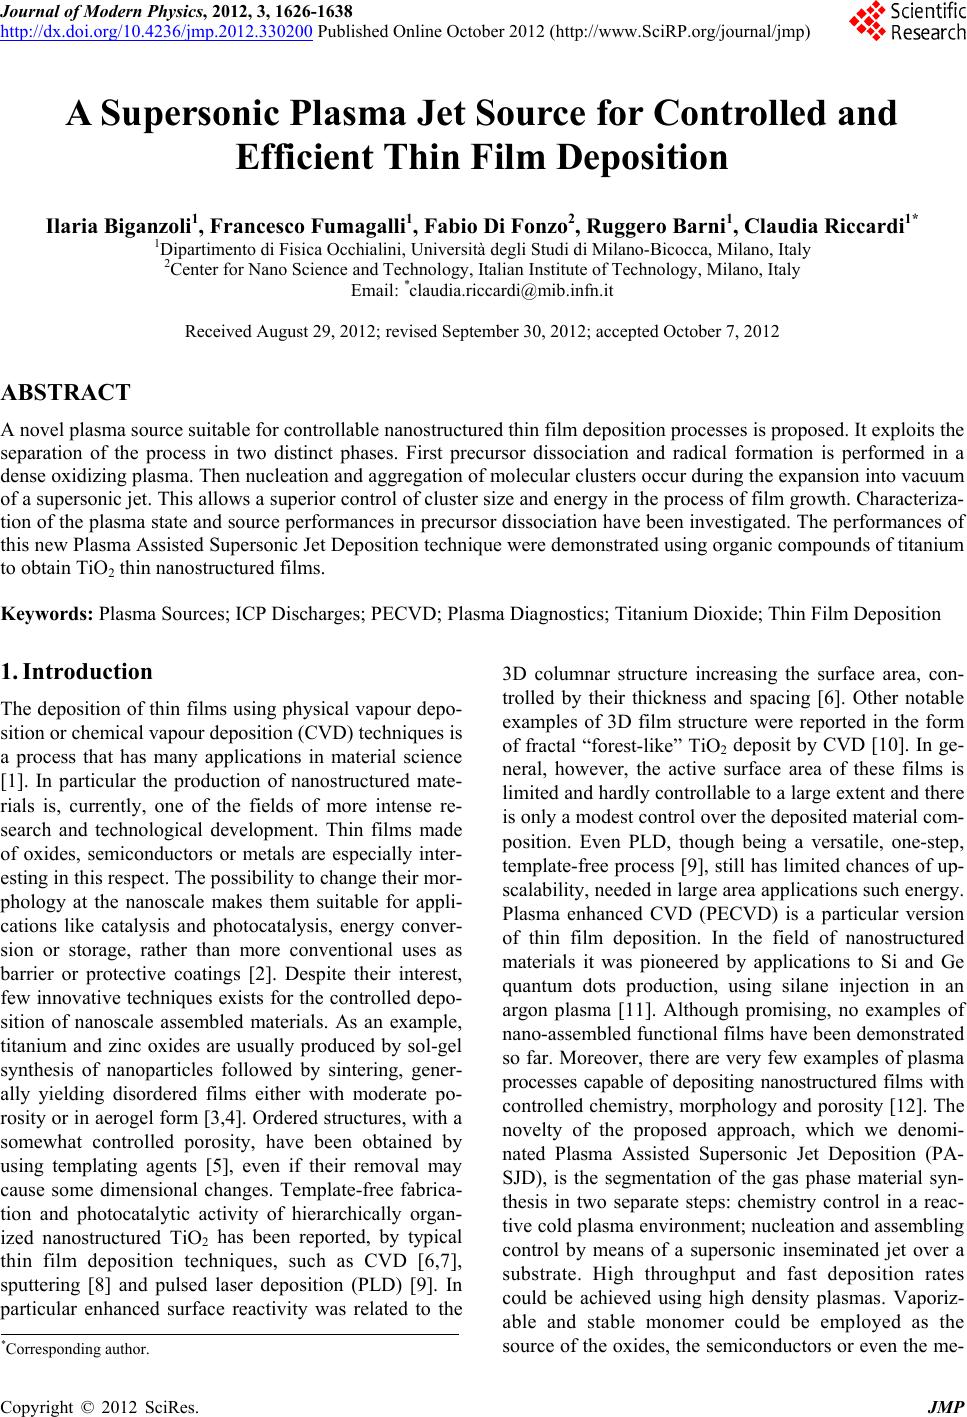
 Journal of Modern Physics, 2012, 3, 1626-1638 http://dx.doi.org/10.4236/jmp.2012.330200 Published Online October 2012 (http://www.SciRP.org/journal/jmp) A Supersonic Plasma Jet Source for Controlled and Efficient Thin Film Deposition Ilaria Biganzoli1, Francesco Fumagalli1, Fabio Di Fonzo2, Ruggero Barni1, Claudia Riccardi1* 1Dipartimento di Fisica Occhialini, Università degli Studi di Milano-Bicocca, Milano, Italy 2Center for Nano Science and Technology, Italian Institute of Technology, Milano, Italy Email: *claudia.riccardi@mib.infn.it Received August 29, 2012; revised September 30, 2012; accepted October 7, 2012 ABSTRACT A novel plasma source suitable for controllable nanostructured thin film deposition processes is proposed. It exploits the separation of the process in two distinct phases. First precursor dissociation and radical formation is performed in a dense oxidizing plasma. Then nucleation and aggregation of molecular clusters occur during the expansion into vacuum of a supersonic jet. This allows a superior control of cluster size and energy in the process of film growth. Characteriza- tion of the plasma state and source performances in precursor dissociation have been investigated. The performances of this new Plasma Assisted Supersonic Jet Deposition technique were demonstrated using organic compounds of titanium to obtain TiO2 thin nanostructured films. Keywords: Plasma Sources; ICP Discharges; PECVD; Plasma Diagnostics; Titanium Dioxide; Thin Film Deposition 1. Introduction The deposition of thin films using physical vapour depo- sition or chemical vapour deposition (CVD) techniques is a process that has many applications in material science [1]. In particular the production of nanostructured mate- rials is, currently, one of the fields of more intense re- search and technological development. Thin films made of oxides, semiconductors or metals are especially inter- esting in this respect. The possibility to change their mor- phology at the nanoscale makes them suitable for appli- cations like catalysis and photocatalysis, energy conver- sion or storage, rather than more conventional uses as barrier or protective coatings [2]. Despite their interest, few innovative techniques exists for the controlled depo- sition of nanoscale assembled materials. As an example, titanium and zinc oxides are usually produced by sol-gel synthesis of nanoparticles followed by sintering, gener- ally yielding disordered films either with moderate po- rosity or in aerogel form [3,4]. Ordered structures, with a somewhat controlled porosity, have been obtained by using templating agents [5], even if their removal may cause some dimensional changes. Template-free fabrica- tion and photocatalytic activity of hierarchically organ- ized nanostructured TiO2 has been reported, by typical thin film deposition techniques, such as CVD [6,7], sputtering [8] and pulsed laser deposition (PLD) [9]. In particular enhanced surface reactivity was related to the 3D columnar structure increasing the surface area, con- trolled by their thickness and spacing [6]. Other notable examples of 3D film structure were reported in the form of fractal “forest-like” TiO2 deposit by CVD [10]. In ge- neral, however, the active surface area of these films is limited and hardly controllable to a large extent and there is only a modest control over the deposited material com- position. Even PLD, though being a versatile, one-step, template-free process [9], still has limited chances of up- scalability, needed in large area applications such energy. Plasma enhanced CVD (PECVD) is a particular version of thin film deposition. In the field of nanostructured materials it was pioneered by applications to Si and Ge quantum dots production, using silane injection in an argon plasma [11]. Although promising, no examples of nano-assembled functional films have been demonstrated so far. Moreover, there are very few examples of plasma processes capable of depositing nanostructured films with controlled chemistry, morphology and porosity [12]. The novelty of the proposed approach, which we denomi- nated Plasma Assisted Supersonic Jet Deposition (PA- SJD), is the segmentation of the gas phase material syn- thesis in two separate steps: chemistry control in a reac- tive cold plasma environment; nucleation and assembling control by means of a supersonic inseminated jet over a substrate. High throughput and fast deposition rates could be achieved using high density plasmas. Vaporiz- able and stable monomer could be employed as the source of the oxides, the semiconductors or even the me- *Corresponding author. C opyright © 2012 SciRes. JMP  I. BIGANZOLI ET AL. 1627 tals. The extraction of a supersonic plasma jet allows to focus the precursor flow on the substrate and to control the growth and the sizes of clusters. Over conventional gas phase processes the proposed technique allows con- trol of the kinetic energy of clusters, whence control on their assembly pattern on the substrate. In particular when molecular cluster deposition is performed under condition of supersonic jet several advantages could be envisaged including the better collimation and stability and the control of crystallinity. By changing the condi- tions during processing it is also possible to obtain graded films. Here we present results concerning the de- sign and performances of a novel plasma source with a reaction chamber where plasma dissociation and clus- terization of precursors could be achieved and from which a sample of reactive radicals could be extracted. Extraction is performed through a nozzle, producing a supersonic jet which propagates in an expansion chamber where deposition processes happen, to be used to grow thin films with controlled morphology at high yield. We will characterize the plasma in our source and then we will demonstrate that ordered nanostructured films of TiO2 could be grown and that their morphological prop- erties, similar to dendritic structures obtained by means of PLD, can be tuned, by varying the process parameters. Then a fair parameter control could be achieved in order to tailor the optoelectronic properties of synthesized ma- terial. 2. The Experimental Setup As stated in the introduction, our main purpose was to spatially separate the region where dissociation of the precursor is achieved in a dense plasma environment and another region where deposition takes place, on a sub- strate which is exposed to a flow of mainly neutral parti- cles and clusters. A sketched view of the source setup is shown in Figure 1. As for the electrical discharge our approach was to use an inductively coupled plasma (ICP) [13,14]. This allows to reach quite large plasma densities and relatively small electron temperatures at moderate pressures, 1 100 Pa. This favours dissociation of ex- ternal, weakly bound chemical groups in organic precur- sors, partially preserving the backbone structures, for instances Si-O bonds in HMDSO [15] or Ti-O ones in titanium ethoxide [16]. A radiofrequency (RF) signal was then applied to an antenna facing the plasma chamber. For the discharge feeding we employed a commercial RF power supply (PFG-1600 by Huettinger, maximum pow- er 1.6 kW). Then our experiments have been performed all at a fixed frequency of 13.56 MHz. An L-type match- ing box was used along the transmission line. A passive system fits our needs, since plasma showed to be quite stable during operation, even during the fairly long depo- Figure 1. Lay-out of the experimental setup. sitions exceeding 30 minutes. To reduce cable length, the system was mounted directly on top of the vacuum chamber and connected with the RF antenna through copper straps (see Figure 1). The measured reflected power was below 1% - 2% even at power level of about 500 W. We have used a two and three quarters loop pla- nar antenna made of hollow copper wire (4-external, 3- internal mm diameters). This allows to circulate deion- ized water for cooling purposes. The total length was about 80 cm with an outer and an inner radius of 54 and 40 mm respectively. The antenna was inserted in a teflon scaffold, a perforated disk (22 cm diameter, 17 mm thick with a 33 mm radius hole), and voids were filled with an epoxy patch adhesive (see Figure 1). Over the internal side of the teflon scaffold, where the antenna is embed- ded, an alumina perforated disk (135 mm diameter, 2 mm thick) is placed, facing the plasma. This reduces con- tamination due to teflon sputtering. It also sustains much better the heat load from the plasma exposure. Under the teflon scaffold, an aluminium disk is placed, sealing the plasma chamber. In the central part of the disk, where there is the transition between the plasma and the deposi- tion chambers, the nozzle region is excavated, as de- scribed below. The supply RF signal is connected to the external edge of the coil (and shielded), while the inter- nal end is connected to the ground. The RF connections run down from the top of the device along the external walls of the plasma chamber (see Figure 1), to reduce contamination. The total inductance of the antenna sys- tem was measured to be 2.5 μH with an impedance of about 213 Ω at RF. Particular care was paid to the earthing. Large copper straps were employed to connect the different parts of the vacuum chamber (main body, top and bottom plates, internal plasma chamber) and the RF network to ensure low resistance, short ways to ground. This proved essential to prevent discharges hap- pening at unwanted locations and RF power dispersions. Afterwards stable working conditions, even at relatively Copyright © 2012 SciRes. JMP  I. BIGANZOLI ET AL. 1628 high power levels, could be maintained for times ex- ceeding hour-long operations. Localized temperature measurements on the plate under the antenna confirm that heating is moderate even after running more than 1 hour at 500 W. Our device operates under moderate vac- uum conditions, that is roughly in a range 1 100 Pa. It was built up out of a commercial stainless-steel cylindri- cal vacuum chamber (31 cm diameter and 40 cm height). Several ports allows to monitor the discharge as well the insertion of diagnostics or sample holders. On the bottom a large (100 mm diameter) vacuum flange constitutes the main connection to the pumping system. On the top flange 11 ports where placed, for gas/vapour-inlet, RF feed throughs, view ports and diagnostics. The plasma chamber is appended in the upper central part of the de- vice. It is made of a thick aluminium cylinder (125 mm diameter and 95 mm height) closed on the bottom by the antenna scaffold and the sealing aluminium disk. Its volume is approximately 1.15 liters. Although a vacuum proof insulation from the main chamber is not strictly needed, all junctions of the plasma chamber were sealed using Viton rings in order to prevent leakage of precur- sors and of reactive agents in other part of the device. The rest of the device constitutes the deposition chamber. Its volume is approximately 30 liters. However the active region is just below the plasma chamber. On a side port a rotable/movable vacuum feedthrough is used to move forward/backward the sample holder and to expose dif- ferent substrates at fixed distances from the plasma chamber exit. The connection between the plasma cham- ber and the deposition chamber consists of a convergent nozzle followed by a thin aperture. In a first realization the latter consists of a slit (22 mm length, 2 mm width) cut in a 0.9 mm aluminium foil. The lay-out is sketched in Figure 2. A circular hole (7.5 mm diameter) was tried too, the better shape being determined by the deposition needed properties [17]. Above this orifice, the aluminium disk was excavated forming a gentle transition (conver- gent nozzle) from the teflon aperture, at the level of the Figure 2. Cross section of nozzle region with a schematic view of the jet expansion in our experimental setup. RF coil to the bottom of the disk aperture (a 22 × 30 mm rounded rectangle), where one of the different apertures is to be sealed. With this choice, when a differential pres- sure exists the flow out of the plasma chamber assumes the form of a jet. In principle, other convergent-divergent configurations could be used (for instance De Laval noz- zle [18]), but this one has the advantage that the aperture foil can be easily removed and modified. As we will dis- cuss in a short while, when the pressure difference is high enough the jet expansion can become supersonic. We have already said that such a capability was one of the main goal to be achieved in the design of the source. In this first design of the source, we choose to use a sin- gle pumping system composed of a turbo molecular pump (Turbovac TW250-S by Leybold) and a rotary pump (Alcatel 2020A). As already mentioned, the pumping system is connected at the bottom of the main chamber, through a gate valve. The actual pressures in the two chambers is controlled by the conductances of the connections (see Figure 1) and by the position of the manual leakage valves connected to the gas-mixture feed system, as it will be discussed below. Three direct gas-inlet on the top plate of the device were used to pre- pare the gas phase in the plasma chamber. The central port was employed for the precursor injection system. Other two ports, 50 mm out of center, are used for the gases. Two micrometer dosing valves (EVN-116 by Pfeiffer) were chosen, in principle supporting an ex- tended flowrate range of more than 8 order of magnitude, Q = 10−6 102 Pa·m3·s−1. In the experiments discussed below, an argon and oxygen mixture was chosen. Oxy- gen was selected as the oxidizing agent to chemically attack the organic groups in precursors. Oxygen is in fact the most efficient oxidizing plasma, but used as a pure gas has many drawbacks, including strong stresses of the pumping system and of the vacuum parts. Argon dilution was then used to provide a stable, not so stressing plasma environment. Argon ICPs are also well known in litera- ture and their properties have been studied at length [13,19]. High purity argon and oxygen cylinders (5.0 by Sapio) were employed. A dedicated and calibrated, re- mote controlled flow-meter (EL-Flow by Bronkhorst) has been installed during the preliminary device test phase, with argon. Using such calibration, we could as- sess that during experiments flow-rate was changed in a somewhat limited range of Q = 0.01 0.1 Pa·m3·s−1. The nominal pumping speed S and the real ones of argon (0.21 m3·s−1) and oxygen (0.23 m3·s−1) are similar for our pump thus providing a sensible control of the gas-phase composition, preventing accumulation and a derive in the gas-phase mixing. Pressure during operation is provided by two capacitance gauges (an Alcatel ADS-1003, upper range of 1 kPa in the plasma chamber and a Pfeiffer CMR- 264, upper range of 100 Pa in the deposition chamber). Copyright © 2012 SciRes. JMP  I. BIGANZOLI ET AL. 1629 Their pressure reading is rather unsensible to the gas- phase composition and their precision is good in the working pressure ranges. Then the argon/oxygen mixing ratio was simply evaluated by measuring the pressure ratio after opening at first argon dosing valve and subse- quently oxygen one. To control contamination and over- all purity, the system could be evacuated using the full capability of the pumping system. This is performed rou- tinely before sample preparation is to be started. Vacuum pressure is controlled in the main chamber by a Penning gauge (PTR-90 by Leybold). Although the use of pre- cursors in deposition processes makes unavoidable some contamination of the chamber walls, the quite large volume of the chamber and the flow of the gas somewhat limited to the central part of the device helps in keeping at acceptable levels. Periodic cleaning of the plasma chamber walls, which can be completely removed, is performed. Then outgassing flowrate could be controlled and vacuum levels of a few 10−4 Pa could be achieved after a few hours of full speed pumping, since sealing. For the injection of the precursor we have chosen a nee- dle. While for the discharge ignition and development in the plasma chamber a uniform and well mixed gas mix- ture is a nice starting point, efficient precursor dissocia- tion does not need it. Indeed a mixing of the precursor outside the plasma chamber could provide complications, since heating is useful to vaporize liquid compounds or to increase the vapour pressure of a precursor but it is not needed for a gas. A uniform distribution of the precursor in the whole plasma volume is not needed too, since deposition is performed elsewhere and most of the vol- ume is too far from the injection point. Moreover the effective residence time in the plasma region needs to be optimized or, at least, controlled in each deposition process, and cannot fit a once and for all scheme as im- plied by performing the mixing of the gas-phase outside the plasma chamber. We used a hollow copper wire (6-external, 4-internal mm diameters) with a 1.5 mm hole drilled at the bottom end. The wire is mounted on a vac- uum feedthrough at the center of the top plate and gets down in the plasma chamber to a regulable depth, in the experiments reported here 87 mm, thus being a few mm above the level of the RF coil and 30 mm from the slit. Another micrometer dosing valve of the same kind con- trols the vapour flow. A reservoir, a sintered aluminum flask of a few tens of ml with a brass sealing is used to store liquid precursors. After refilling, the flask and the micrometer valve connections were briefly pumped by a rotary pump. This remove most of the residual air from the flask, allowing the reservoir to be stored with the liquid precursor in equilibrium with its saturated vapour. This obviously select as usable precursors only those with a sufficiently high vapour pressure at set tempera- ture, otherwise outgassing and residual air will contami- nate the gas-phase. To increase the flow, heating of the precursor flask and the injection system constitutes the most viable way. A heater was then put under the flask. Insulation of the injection system is provided too and tested by the use of several thermocouples. It should be noted that the injection needle gets heated by the plasma and by the RF itself. So the actual temperature of the precursor vapour at the injection in the plasma is some- what depending on the plasma conditions. However, after the opening of the dosing valve, equilibrium is reached quite fast and a steady operation condition could be es- tablished and maintained allowing long, even hour-long deposition processes. In order to avoid contaminations and not to perform deposition under a poorly controlled environment, sample holder was not exposed to the jet until such steady condition is reached. In the experiments discussed in the present paper we have employed as a precursor the titanium ethoxide (TEOT). It is widely used in TiO2 depositions [20]. It already bears the tetrahedral structure of the titanium oxide, while the lateral hydro- carbon chains are easily removed by oxygen in the plasma chamber. The effective interaction length of pre- cursor molecules is determined by the position of injec- tion point and by the plasma conditions, mainly the den- sity of oxidizing agents. This could be tuned in order to produce an optimal flow of seed radicals at the nozzle, to fed the plasma jet. In this respect the injection system and the plasma source could be easily fitted for different kind of precursors. Even concerning only TiO2 deposi- tions, we have demonstrated that titanium isopropoxide could be used instead of TEOT, obtaining similar satis- factory results. The actual pressures in the two chambers are controlled by the conductances of the connections shown in Figure 1, their values depending on the flow- rate Q determined by the leakage valves opening and by the pumping speed S. The pressures in the plasma cham- ber PP and in the deposition chamber PD are given by the following expressions [21]: 111 PNP PQ CCS (1) 11, DP PQ CS (2) where CN and CP are the conductances separating the plasma from the deposition chambers and the deposition chamber from the turbo-molecular pump, respectively. The values of S and CN are in a sense fixed by the setup choice. On the contrary, CP could be varied by throttling partially the gate valve at the bottom of the main cham- ber, reducing the overall pumping speed. This also in- creases the pressure in the deposition chamber which, as discussed previously, is useful to enhance clusterization and to grow porous films with a structure at the nanome- ter scale [9]. Q can also be easily changed regulating the opening of the micrometer valves. From the operating Copyright © 2012 SciRes. JMP 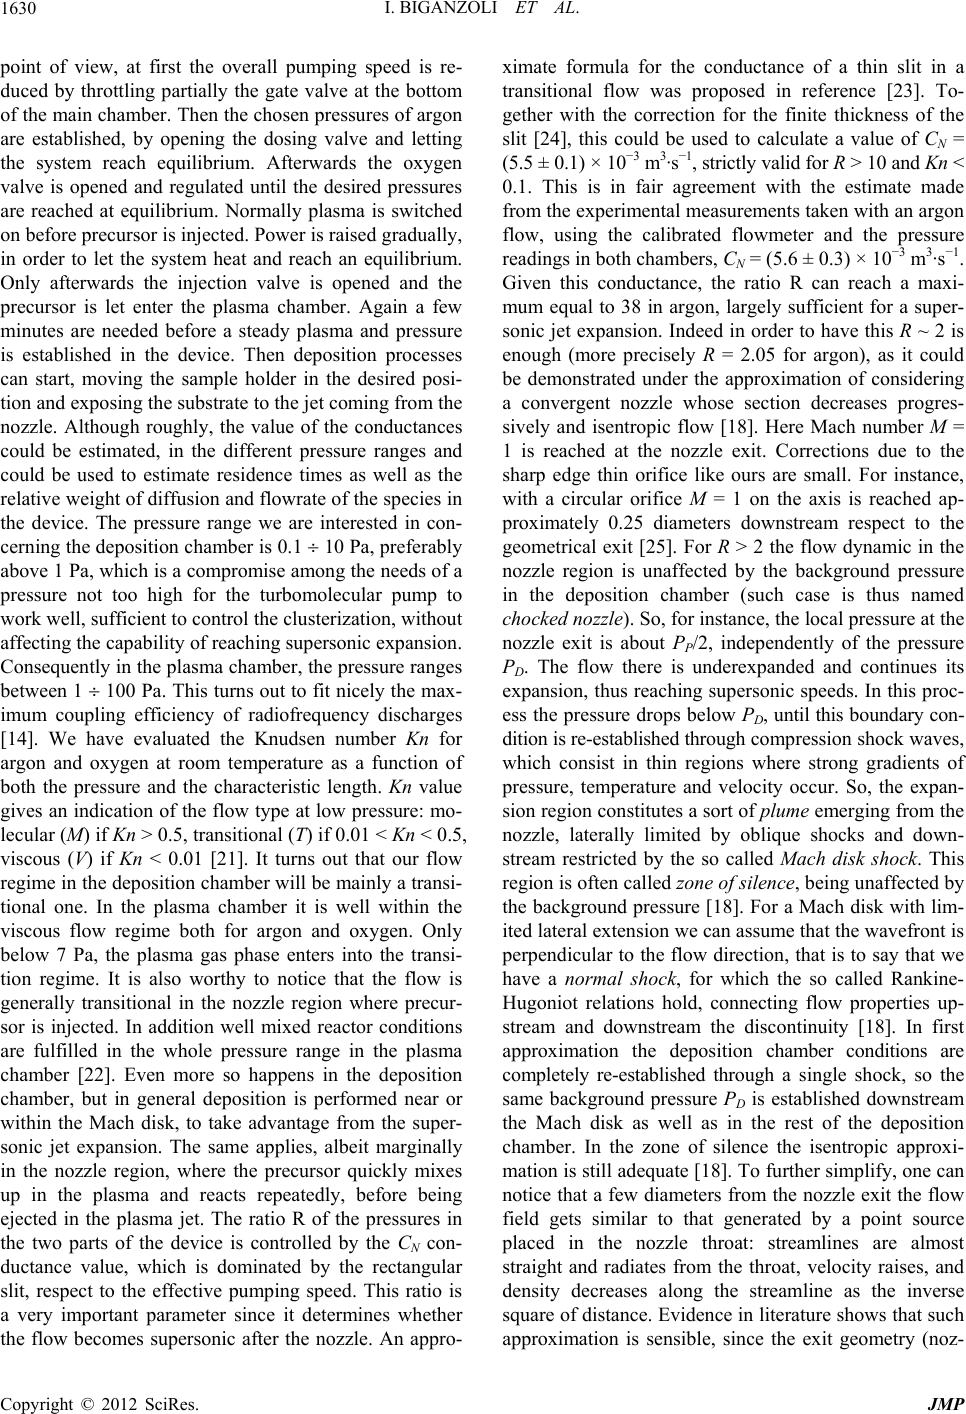 I. BIGANZOLI ET AL. 1630 point of view, at first the overall pumping speed is re- duced by throttling partially the gate valve at the bottom of the main chamber. Then the chosen pressures of argon are established, by opening the dosing valve and letting the system reach equilibrium. Afterwards the oxygen valve is opened and regulated until the desired pressures are reached at equilibrium. Normally plasma is switched on before precursor is injected. Power is raised gradually, in order to let the system heat and reach an equilibrium. Only afterwards the injection valve is opened and the precursor is let enter the plasma chamber. Again a few minutes are needed before a steady plasma and pressure is established in the device. Then deposition processes can start, moving the sample holder in the desired posi- tion and exposing the substrate to the jet coming from the nozzle. Although roughly, the value of the conductances could be estimated, in the different pressure ranges and could be used to estimate residence times as well as the relative weight of diffusion and flowrate of the species in the device. The pressure range we are interested in con- cerning the deposition chamber is 0.1 10 Pa, preferably above 1 Pa, which is a compromise among the needs of a pressure not too high for the turbomolecular pump to work well, sufficient to control the clusterization, without affecting the capability of reaching supersonic expansion. Consequently in the plasma chamber, the pressure ranges between 1 100 Pa. This turns out to fit nicely the max- imum coupling efficiency of radiofrequency discharges [14]. We have evaluated the Knudsen number Kn for argon and oxygen at room temperature as a function of both the pressure and the characteristic length. Kn value gives an indication of the flow type at low pressure: mo- lecular (M) if Kn > 0.5, transitional (T) if 0.01 < Kn < 0.5, viscous (V) if Kn < 0.01 [21]. It turns out that our flow regime in the deposition chamber will be mainly a transi- tional one. In the plasma chamber it is well within the viscous flow regime both for argon and oxygen. Only below 7 Pa, the plasma gas phase enters into the transi- tion regime. It is also worthy to notice that the flow is generally transitional in the nozzle region where precur- sor is injected. In addition well mixed reactor conditions are fulfilled in the whole pressure range in the plasma chamber [22]. Even more so happens in the deposition chamber, but in general deposition is performed near or within the Mach disk, to take advantage from the super- sonic jet expansion. The same applies, albeit marginally in the nozzle region, where the precursor quickly mixes up in the plasma and reacts repeatedly, before being ejected in the plasma jet. The ratio R of the pressures in the two parts of the device is controlled by the CN con- ductance value, which is dominated by the rectangular slit, respect to the effective pumping speed. This ratio is a very important parameter since it determines whether the flow becomes supersonic after the nozzle. An appro- ximate formula for the conductance of a thin slit in a transitional flow was proposed in reference [23]. To- gether with the correction for the finite thickness of the slit [24], this could be used to calculate a value of CN = (5.5 ± 0.1) × 10−3 m3·s−1, strictly valid for R > 10 and Kn < 0.1. This is in fair agreement with the estimate made from the experimental measurements taken with an argon flow, using the calibrated flowmeter and the pressure readings in both chambers, CN = (5.6 ± 0.3) × 10−3 m3·s−1. Given this conductance, the ratio R can reach a maxi- mum equal to 38 in argon, largely sufficient for a super- sonic jet expansion. Indeed in order to have this R ~ 2 is enough (more precisely R = 2.05 for argon), as it could be demonstrated under the approximation of considering a convergent nozzle whose section decreases progres- sively and isentropic flow [18]. Here Mach number M = 1 is reached at the nozzle exit. Corrections due to the sharp edge thin orifice like ours are small. For instance, with a circular orifice M = 1 on the axis is reached ap- proximately 0.25 diameters downstream respect to the geometrical exit [25]. For R > 2 the flow dynamic in the nozzle region is unaffected by the background pressure in the deposition chamber (such case is thus named chocked nozzle). So, for instance, the local pressure at the nozzle exit is about PP/2, independently of the pressure PD. The flow there is underexpanded and continues its expansion, thus reaching supersonic speeds. In this proc- ess the pressure drops below PD, until this boundary con- dition is re-established through compression shock waves, which consist in thin regions where strong gradients of pressure, temperature and velocity occur. So, the expan- sion region constitutes a sort of plume emerging from the nozzle, laterally limited by oblique shocks and down- stream restricted by the so called Mach disk shock. This region is often called zone of silence, being unaffected by the background pressure [18]. For a Mach disk with lim- ited lateral extension we can assume that the wavefront is perpendicular to the flow direction, that is to say that we have a normal shock, for which the so called Rankine- Hugoniot relations hold, connecting flow properties up- stream and downstream the discontinuity [18]. In first approximation the deposition chamber conditions are completely re-established through a single shock, so the same background pressure PD is established downstream the Mach disk as well as in the rest of the deposition chamber. In the zone of silence the isentropic approxi- mation is still adequate [18]. To further simplify, one can notice that a few diameters from the nozzle exit the flow field gets similar to that generated by a point source placed in the nozzle throat: streamlines are almost straight and radiates from the throat, velocity raises, and density decreases along the streamline as the inverse square of distance. Evidence in literature shows that such approximation is sensible, since the exit geometry (noz- Copyright © 2012 SciRes. JMP 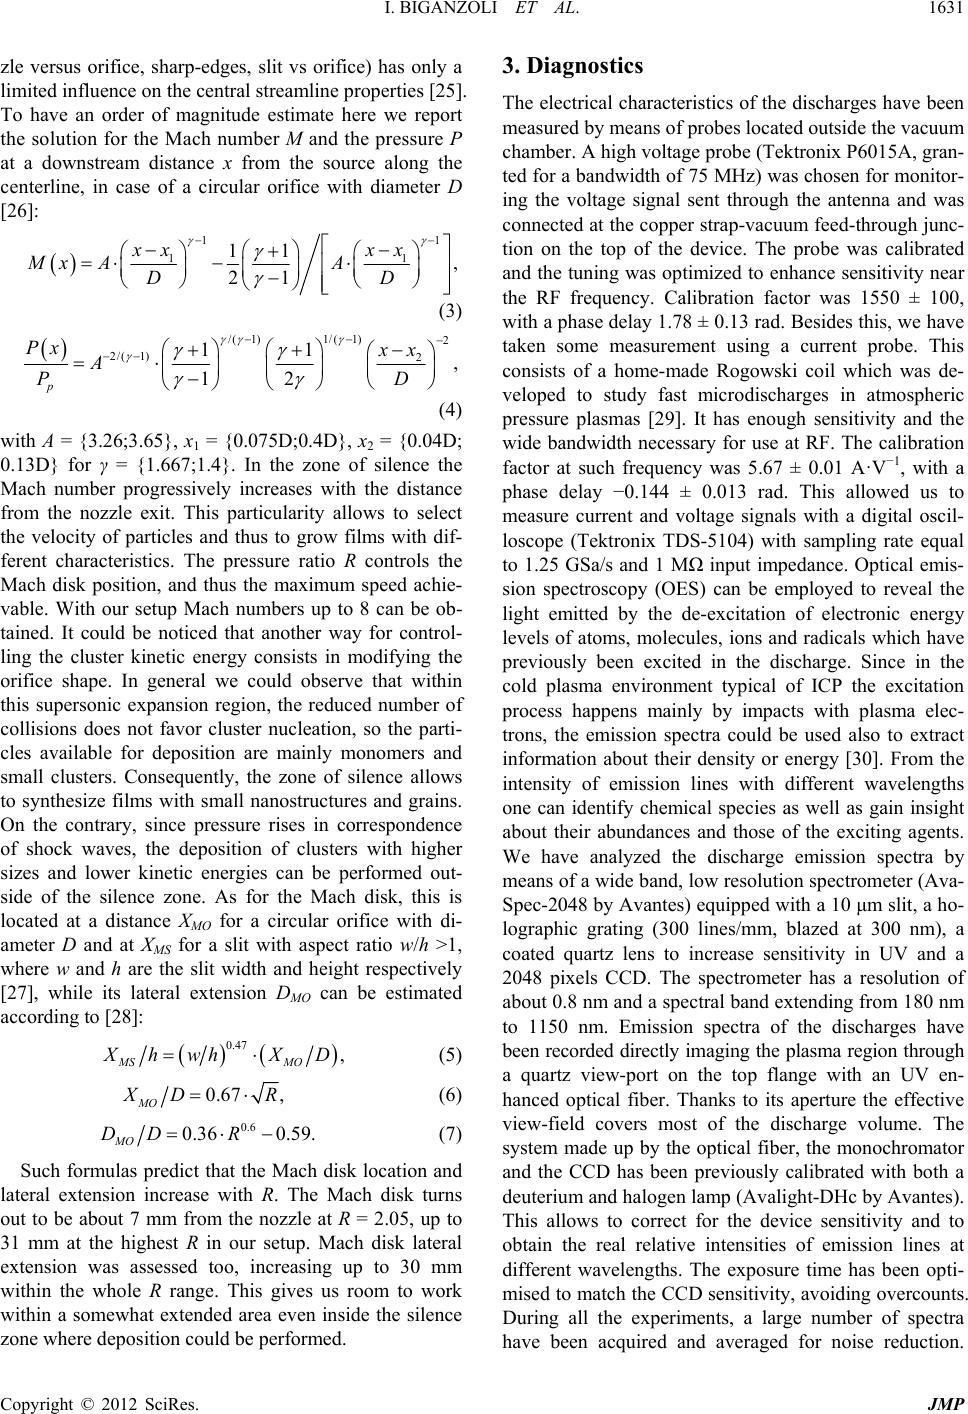 I. BIGANZOLI ET AL. 1631 zle versus orifice, sharp-edges, slit vs orifice) has only a limited influence on the central streamline properties [25]. To have an order of magnitude estimate here we report the solution for the Mach number M and the pressure P at a downstream distance x from the source along the centerline, in case of a circular orifice with diameter D [26]: 1 1 11 21 xx Mx AA D 1 1 , xx D (3) /( 1)1/( 2/( 1)11 12 p Px A P 1)2 2, xx D (4) with A = {3.26;3.65}, x1 = {0.075D;0.4D}, x2 = {0.04D; 0.13D} for γ = {1.667;1.4}. In the zone of silence the Mach number progressively increases with the distance from the nozzle exit. This particularity allows to select the velocity of particles and thus to grow films with dif- ferent characteristics. The pressure ratio R controls the Mach disk position, and thus the maximum speed achie- vable. With our setup Mach numbers up to 8 can be ob- tained. It could be noticed that another way for control- ling the cluster kinetic energy consists in modifying the orifice shape. In general we could observe that within this supersonic expansion region, the reduced number of collisions does not favor cluster nucleation, so the parti- cles available for deposition are mainly monomers and small clusters. Consequently, the zone of silence allows to synthesize films with small nanostructures and grains. On the contrary, since pressure rises in correspondence of shock waves, the deposition of clusters with higher sizes and lower kinetic energies can be performed out- side of the silence zone. As for the Mach disk, this is located at a distance XMO for a circular orifice with di- ameter D and at XMS for a slit with aspect ratio w/h >1, where w and h are the slit width and height respectively [27], while its lateral extension DMO can be estimated according to [28]: , MO 0.47 MS hwhXD (5) MO 0.67 ,DR (6) 0.6 0.59.R0.36 MO DD (7) Such formulas predict that the Mach disk location and lateral extension increase with R. The Mach disk turns out to be about 7 mm from the nozzle at R = 2.05, up to 31 mm at the highest R in our setup. Mach disk lateral extension was assessed too, increasing up to 30 mm within the whole R range. This gives us room to work within a somewhat extended area even inside the silence zone where deposition could be performed. 3. Diagnostics The electrical characteristics of the discharges have been measured by means of probes located outside the vacuum chamber. A high voltage probe (Tektronix P6015A, gran- ted for a bandwidth of 75 MHz) was chosen for monitor- ing the voltage signal sent through the antenna and was connected at the copper strap-vacuum feed-through junc- tion on the top of the device. The probe was calibrated and the tuning was optimized to enhance sensitivity near the RF frequency. Calibration factor was 1550 ± 100, with a phase delay 1.78 ± 0.13 rad. Besides this, we have taken some measurement using a current probe. This consists of a home-made Rogowski coil which was de- veloped to study fast microdischarges in atmospheric pressure plasmas [29]. It has enough sensitivity and the wide bandwidth necessary for use at RF. The calibration factor at such frequency was 5.67 ± 0.01 A·V−1, with a phase delay −0.144 ± 0.013 rad. This allowed us to measure current and voltage signals with a digital oscil- loscope (Tektronix TDS-5104) with sampling rate equal to 1.25 GSa/s and 1 MΩ input impedance. Optical emis- sion spectroscopy (OES) can be employed to reveal the light emitted by the de-excitation of electronic energy levels of atoms, molecules, ions and radicals which have previously been excited in the discharge. Since in the cold plasma environment typical of ICP the excitation process happens mainly by impacts with plasma elec- trons, the emission spectra could be used also to extract information about their density or energy [30]. From the intensity of emission lines with different wavelengths one can identify chemical species as well as gain insight about their abundances and those of the exciting agents. We have analyzed the discharge emission spectra by means of a wide band, low resolution spectrometer (Ava- Spec-2048 by Avantes) equipped with a 10 μm slit, a ho- lographic grating (300 lines/mm, blazed at 300 nm), a coated quartz lens to increase sensitivity in UV and a 2048 pixels CCD. The spectrometer has a resolution of about 0.8 nm and a spectral band extending from 180 nm to 1150 nm. Emission spectra of the discharges have been recorded directly imaging the plasma region through a quartz view-port on the top flange with an UV en- hanced optical fiber. Thanks to its aperture the effective view-field covers most of the discharge volume. The system made up by the optical fiber, the monochromator and the CCD has been previously calibrated with both a deuterium and halogen lamp (Avalight-DHc by Avantes). This allows to correct for the device sensitivity and to obtain the real relative intensities of emission lines at different wavelengths. The exposure time has been opti- mised to match the CCD sensitivity, avoiding overcounts. During all the experiments, a large number of spectra have been acquired and averaged for noise reduction. Copyright © 2012 SciRes. JMP  I. BIGANZOLI ET AL. 1632 Dark spectra with comparable statistics were acquired before each experiment and have been subtracted after- wards. Although somewhat outside the scope of our pa- per, we have also investigated thin film morphology and composition. Deposited films were analyzed with an FE-SEM (Zeiss Supra 40), equipped with an Oxford EDS analyzer. Their chemical composition was then measured with a precision of about 1%. 4. Experimental Results As it is well known ICP discharges operates in two dif- ferent regimes, so-called E- and H-mode [31]. The names refer to the main actor sustaining the plasma state, being in the former case the electrostatic electric field provided by the voltage applied to an edge of the radiofrequency antenna, while in the latter the oscillating magnetic field locally inducing the electric field needed to sustain the plasma. Only in the second case the name ICP refers ac- tually to the prevailing impedance of the antenna plasma coupling. By rising incrementally the voltage applied to the antenna through the matching network, the gas-phase undergoes an electrical breakdown and usually the ig- nited discharge operates in the E-mode. Increasing the voltage, a sharp transition occurs and the discharge enters the H-mode [32]. Apart from the geometry of the RF antenna and of the plasma chamber, the minimum volt- age needed to enter the H-mode is determined by the ratio between the radiofrequency ω and the momentum transfer collision frequency which is controlled by the gas pressure [31]. As discussed above, the relevant pres- sure range in the plasma chamber will be 10 100 Pa. Initially plasma was produced in argon alone. Break- down happens at a low power level (10 - 20 W in the pressure range) after suitable RF-line adapter conditions are chosen and fixed to optimize network matching. The HV signal measured by the probe at the different power levels is shown in Figure 3. The steep rise at low power is due to the E-mode, with voltage proportional to the square root of the power. The voltage drops, even by a few hundreds volts, when the regime transition starts and the coupling is changing. The transition is somewhat smooth happening over a quite extended range of power, 30 - 60 W, which is larger the lower the pressure. This is in agreement with similar observations published in lit- erature [33]. After the H-mode is fully established, the HV starts rising linearly with the power level, at least in the limited range considered. From the simultaneous measurement of the current and voltage signals it is pos- sible to calculate the values of the impedance of the an- tenna-plasma load. The same measure could be extracted form the values fixed for the capacitances of the RF matching box, when the best tuning conditions are reached [14]. This is displayed in Figure 4. The two Figure 3. Coil HV amplitude as a function of the RF power level in argon discharges at pressures of 10, 40 and 80 Pa. Figure 4. Real and imaginary part of the load impedance as a function of RF power in argon discharges at 40 Pa. procedures agree fairly well. The second being much more easy to employ was used in the subsequent experi- ments. Load resistance, which is dominated by the plasma contribution, starts to increase as the transition happens, and to stabilize in the H-mode. Load reactance, initially dominated by the antenna inductance, decreases as the plasma coupling becomes inductive, as expected from the simplified ICP model as a transformer [14]. A typical OES spectrum of argon discharges after dark sub- traction and sensitivity correction is shown in Figure 5. The brightest feature in the spectra of such discharges is the system of 3p54p → 4s transitions, the 2px system in the Paschen notation, in the red and in the near IR [34]. Under vacuum conditions, the excitation of argon radia- tively decaying levels happens mainly through inelastic scattering of argon atoms by high energy electron impact. Under such an approximation the intensity of emission lines is proportional to the product of the electron density and the rate of impact excitation process, which is a function of the reduced electric field or, in other terms, of the electron temperature alone [30]. We take advantage Copyright © 2012 SciRes. JMP 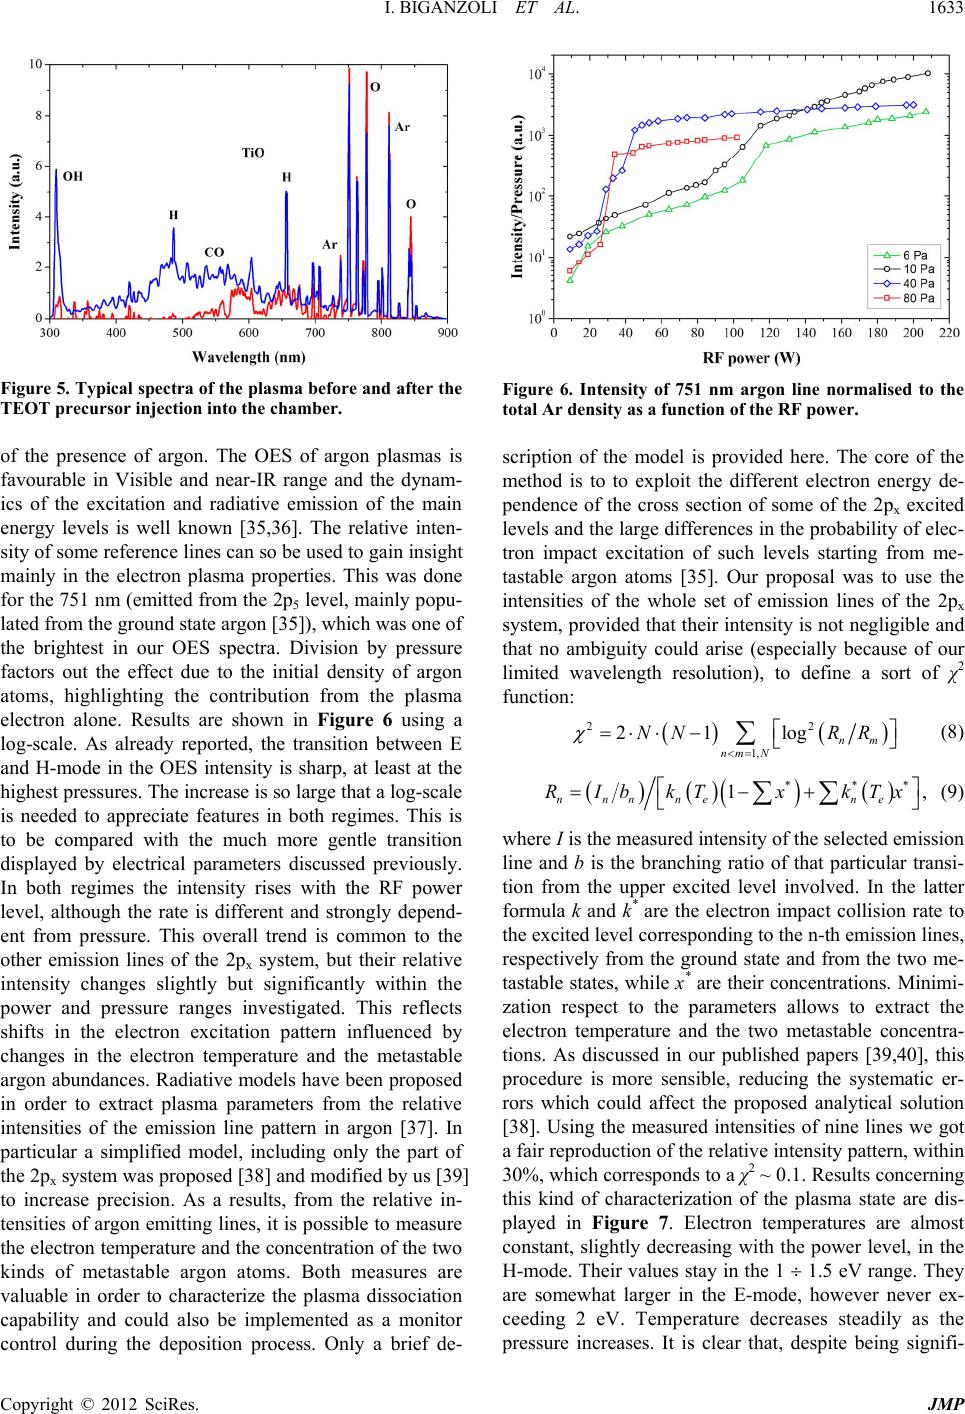 I. BIGANZOLI ET AL. 1633 Figure 5. Typical spectra of the plasma before and after the TEOT precursor injection into the chamber. of the presence of argon. The OES of argon plasmas is favourable in Visible and near-IR range and the dynam- ics of the excitation and radiative emission of the main energy levels is well known [35,36]. The relative inten- sity of some reference lines can so be used to gain insight mainly in the electron plasma properties. This was done for the 751 nm (emitted from the 2p5 level, mainly popu- lated from the ground state argon [35]), which was one of the brightest in our OES spectra. Division by pressure factors out the effect due to the initial density of argon atoms, highlighting the contribution from the plasma electron alone. Results are shown in Figure 6 using a log-scale. As already reported, the transition between E and H-mode in the OES intensity is sharp, at least at the highest pressures. The increase is so large that a log-scale is needed to appreciate features in both regimes. This is to be compared with the much more gentle transition displayed by electrical parameters discussed previously. In both regimes the intensity rises with the RF power level, although the rate is different and strongly depend- ent from pressure. This overall trend is common to the other emission lines of the 2px system, but their relative intensity changes slightly but significantly within the power and pressure ranges investigated. This reflects shifts in the electron excitation pattern influenced by changes in the electron temperature and the metastable argon abundances. Radiative models have been proposed in order to extract plasma parameters from the relative intensities of the emission line pattern in argon [37]. In particular a simplified model, including only the part of the 2px system was proposed [38] and modified by us [39] to increase precision. As a results, from the relative in- tensities of argon emitting lines, it is possible to measure the electron temperature and the concentration of the two kinds of metastable argon atoms. Both measures are valuable in order to characterize the plasma dissociation capability and could also be implemented as a monitor control during the deposition process. Only a brief de- Figure 6. Intensity of 751 nm argon line normalised to the total Ar density as a function of the RF power. scription of the model is provided here. The core of the method is to to exploit the different electron energy de- pendence of the cross section of some of the 2px excited levels and the large differences in the probability of elec- tron impact excitation of such levels starting from me- tastable argon atoms [35]. Our proposal was to use the intensities of the whole set of emission lines of the 2px system, provided that their intensity is not negligible and that no ambiguity could arise (especially because of our limited wavelength resolution), to define a sort of χ2 function: 22 1, 21log nm nm N NN RR (8) *** 1, nnnne ne RIbkTx kTx (9) where I is the measured intensity of the selected emission line and b is the branching ratio of that particular transi- tion from the upper excited level involved. In the latter formula k and k* are the electron impact collision rate to the excited level corresponding to the n-th emission lines, respectively from the ground state and from the two me- tastable states, while x* are their concentrations. Minimi- zation respect to the parameters allows to extract the electron temperature and the two metastable concentra- tions. As discussed in our published papers [39,40], this procedure is more sensible, reducing the systematic er- rors which could affect the proposed analytical solution [38]. Using the measured intensities of nine lines we got a fair reproduction of the relative intensity pattern, within 30%, which corresponds to a χ2 ~ 0.1. Results concerning this kind of characterization of the plasma state are dis- played in Figure 7. Electron temperatures are almost constant, slightly decreasing with the power level, in the H-mode. Their values stay in the 1 1.5 eV range. They are somewhat larger in the E-mode, however never ex- ceeding 2 eV. Temperature decreases steadily as the pressure increases. It is clear that, despite being signifi- Copyright © 2012 SciRes. JMP 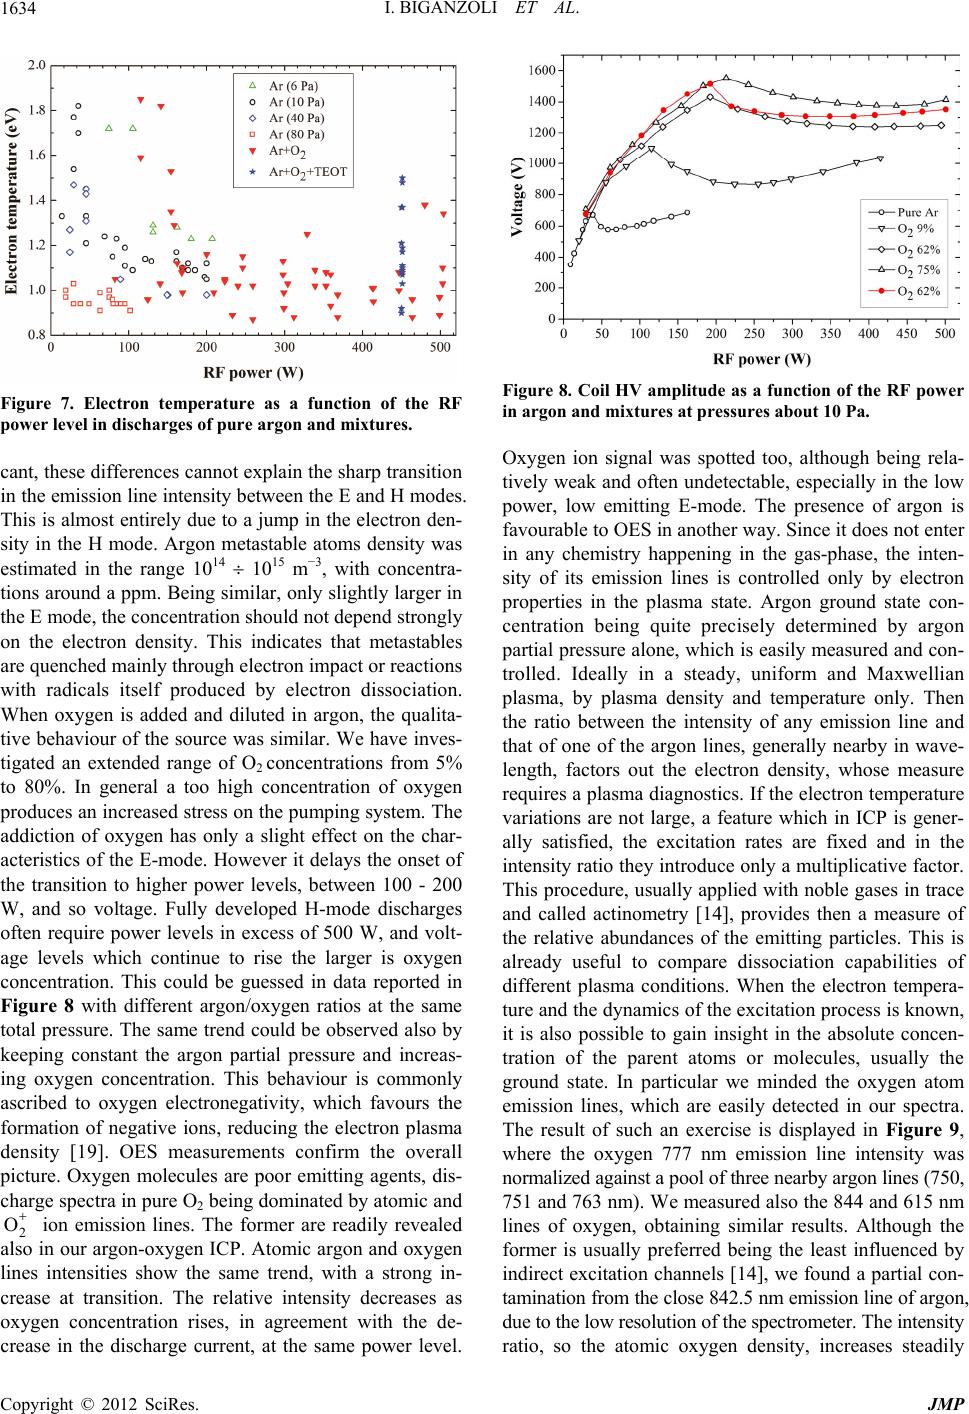 I. BIGANZOLI ET AL. 1634 Figure 7. Electron temperature as a function of the RF power level in dischar g e s of pure argon and mixtures. cant, these differences cannot explain the sharp transition in the emission line intensity between the E and H modes. This is almost entirely due to a jump in the electron den- sity in the H mode. Argon metastable atoms density was estimated in the range 1014 1015 m −3, with concentra- tions around a ppm. Being similar, only slightly larger in the E mode, the concentration should not depend strongly on the electron density. This indicates that metastables are quenched mainly through electron impact or reactions with radicals itself produced by electron dissociation. When oxygen is added and diluted in argon, the qualita- tive behaviour of the source was similar. We have inves- tigated an extended range of O2 concentrations from 5% to 80%. In general a too high concentration of oxygen produces an increased stress on the pumping system. The addiction of oxygen has only a slight effect on the char- acteristics of the E-mode. However it delays the onset of the transition to higher power levels, between 100 - 200 W, and so voltage. Fully developed H-mode discharges often require power levels in excess of 500 W, and volt- age levels which continue to rise the larger is oxygen concentration. This could be guessed in data reported in Figure 8 with different argon/oxygen ratios at the same total pressure. The same trend could be observed also by keeping constant the argon partial pressure and increas- ing oxygen concentration. This behaviour is commonly ascribed to oxygen electronegativity, which favours the formation of negative ions, reducing the electron plasma density [19]. OES measurements confirm the overall picture. Oxygen molecules are poor emitting agents, dis- charge spectra in pure O2 being dominated by atomic and 2 ion emission lines. The former are readily revealed also in our argon-oxygen ICP. Atomic argon and oxygen lines intensities show the same trend, with a strong in- crease at transition. The relative intensity decreases as oxygen concentration rises, in agreement with the de- crease in the discharge current, at the same power level. Figure 8. Coil HV amplitude as a function of the RF power in argon and mixtures at pressures about 10 Pa. Oxygen ion signal was spotted too, although being rela- tively weak and often undetectable, especially in the low power, low emitting E-mode. The presence of argon is favourable to OES in another way. Since it does not enter in any chemistry happening in the gas-phase, the inten- sity of its emission lines is controlled only by electron properties in the plasma state. Argon ground state con- centration being quite precisely determined by argon partial pressure alone, which is easily measured and con- trolled. Ideally in a steady, uniform and Maxwellian plasma, by plasma density and temperature only. Then the ratio between the intensity of any emission line and that of one of the argon lines, generally nearby in wave- length, factors out the electron density, whose measure requires a plasma diagnostics. If the electron temperature variations are not large, a feature which in ICP is gener- ally satisfied, the excitation rates are fixed and in the intensity ratio they introduce only a multiplicative factor. This procedure, usually applied with noble gases in trace and called actinometry [14], provides then a measure of the relative abundances of the emitting particles. This is already useful to compare dissociation capabilities of different plasma conditions. When the electron tempera- ture and the dynamics of the excitation process is known, it is also possible to gain insight in the absolute concen- tration of the parent atoms or molecules, usually the ground state. In particular we minded the oxygen atom emission lines, which are easily detected in our spectra. The result of such an exercise is displayed in Figure 9, where the oxygen 777 nm emission line intensity was normalized against a pool of three nearby argon lines (750, 751 and 763 nm). We measured also the 844 and 615 nm lines of oxygen, obtaining similar results. Although the former is usually preferred being the least influenced by indirect excitation channels [14], we found a partial con- tamination from the close 842.5 nm emission line of argon, due to the low resolution of the spectrometer. The intensity ratio, so the atomic oxygen density, increases steadily O Copyright © 2012 SciRes. JMP 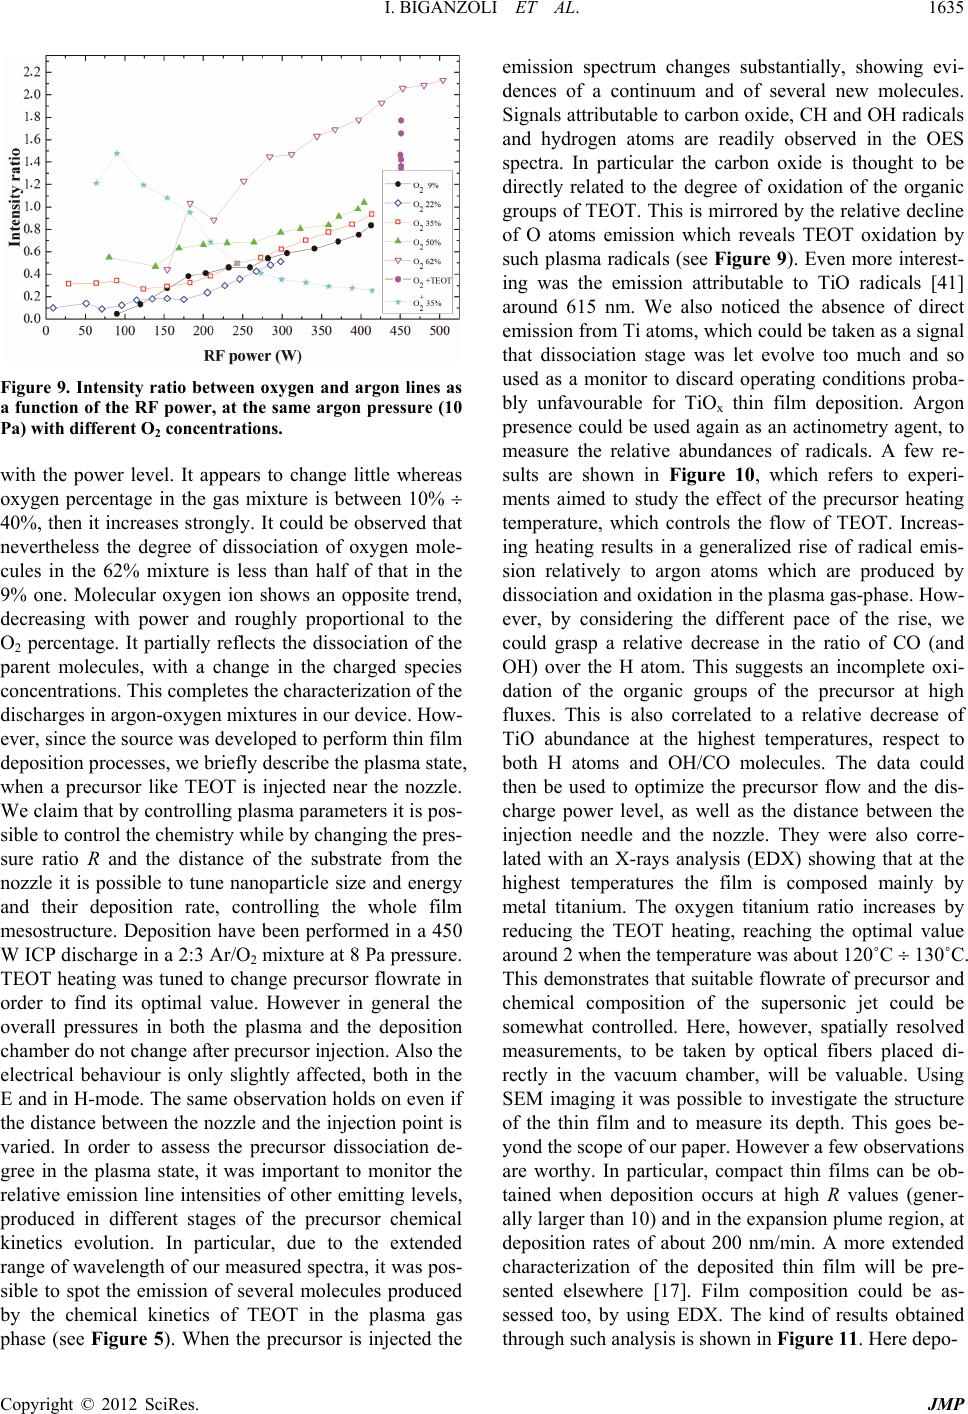 I. BIGANZOLI ET AL. 1635 Figure 9. Intensity ratio between oxygen and argon lines as a function of the RF power, at the same argon pressure (10 Pa) with different O2 concentrations. with the power level. It appears to change little whereas oxygen percentage in the gas mixture is between 10% 40%, then it increases strongly. It could be observed that nevertheless the degree of dissociation of oxygen mole- cules in the 62% mixture is less than half of that in the 9% one. Molecular oxygen ion shows an opposite trend, decreasing with power and roughly proportional to the O2 percentage. It partially reflects the dissociation of the parent molecules, with a change in the charged species concentrations. This completes the characterization of the discharges in argon-oxygen mixtures in our device. How- ever, since the source was developed to perform thin film deposition processes, we briefly describe the plasma state, when a precursor like TEOT is injected near the nozzle. We claim that by controlling plasma parameters it is pos- sible to control the chemistry while by changing the pres- sure ratio R and the distance of the substrate from the nozzle it is possible to tune nanoparticle size and energy and their deposition rate, controlling the whole film mesostructure. Deposition have been performed in a 450 W ICP discharge in a 2:3 Ar/O2 mixture at 8 Pa pressure. TEOT heating was tuned to change precursor flowrate in order to find its optimal value. However in general the overall pressures in both the plasma and the deposition chamber do not change after precursor injection. Also the electrical behaviour is only slightly affected, both in the E and in H-mode. The same observation holds on even if the distance between the nozzle and the injection point is varied. In order to assess the precursor dissociation de- gree in the plasma state, it was important to monitor the relative emission line intensities of other emitting levels, produced in different stages of the precursor chemical kinetics evolution. In particular, due to the extended range of wavelength of our measured spectra, it was pos- sible to spot the emission of several molecules produced by the chemical kinetics of TEOT in the plasma gas phase (see Figure 5). When the precursor is injected the emission spectrum changes substantially, showing evi- dences of a continuum and of several new molecules. Signals attributable to carbon oxide, CH and OH radicals and hydrogen atoms are readily observed in the OES spectra. In particular the carbon oxide is thought to be directly related to the degree of oxidation of the organic groups of TEOT. This is mirrored by the relative decline of O atoms emission which reveals TEOT oxidation by such plasma radicals (see Figure 9). Even more interest- ing was the emission attributable to TiO radicals [41] around 615 nm. We also noticed the absence of direct emission from Ti atoms, which could be taken as a signal that dissociation stage was let evolve too much and so used as a monitor to discard operating conditions proba- bly unfavourable for TiOx thin film deposition. Argon presence could be used again as an actinometry agent, to measure the relative abundances of radicals. A few re- sults are shown in Figure 10, which refers to experi- ments aimed to study the effect of the precursor heating temperature, which controls the flow of TEOT. Increas- ing heating results in a generalized rise of radical emis- sion relatively to argon atoms which are produced by dissociation and oxidation in the plasma gas-phase. How- ever, by considering the different pace of the rise, we could grasp a relative decrease in the ratio of CO (and OH) over the H atom. This suggests an incomplete oxi- dation of the organic groups of the precursor at high fluxes. This is also correlated to a relative decrease of TiO abundance at the highest temperatures, respect to both H atoms and OH/CO molecules. The data could then be used to optimize the precursor flow and the dis- charge power level, as well as the distance between the injection needle and the nozzle. They were also corre- lated with an X-rays analysis (EDX) showing that at the highest temperatures the film is composed mainly by metal titanium. The oxygen titanium ratio increases by reducing the TEOT heating, reaching the optimal value around 2 when the temperature was about 120˚C 130˚C. This demonstrates that suitable flowrate of precursor and chemical composition of the supersonic jet could be somewhat controlled. Here, however, spatially resolved measurements, to be taken by optical fibers placed di- rectly in the vacuum chamber, will be valuable. Using SEM imaging it was possible to investigate the structure of the thin film and to measure its depth. This goes be- yond the scope of our paper. However a few observations are worthy. In particular, compact thin films can be ob- tained when deposition occurs at high R values (gener- ally larger than 10) and in the expansion plume region, at deposition rates of about 200 nm/min. A more extended characterization of the deposited thin film will be pre- sented elsewhere [17]. Film composition could be as- sessed too, by using EDX. The kind of results obtained through such analysis is shown in Figure 11. Here depo- Copyright © 2012 SciRes. JMP 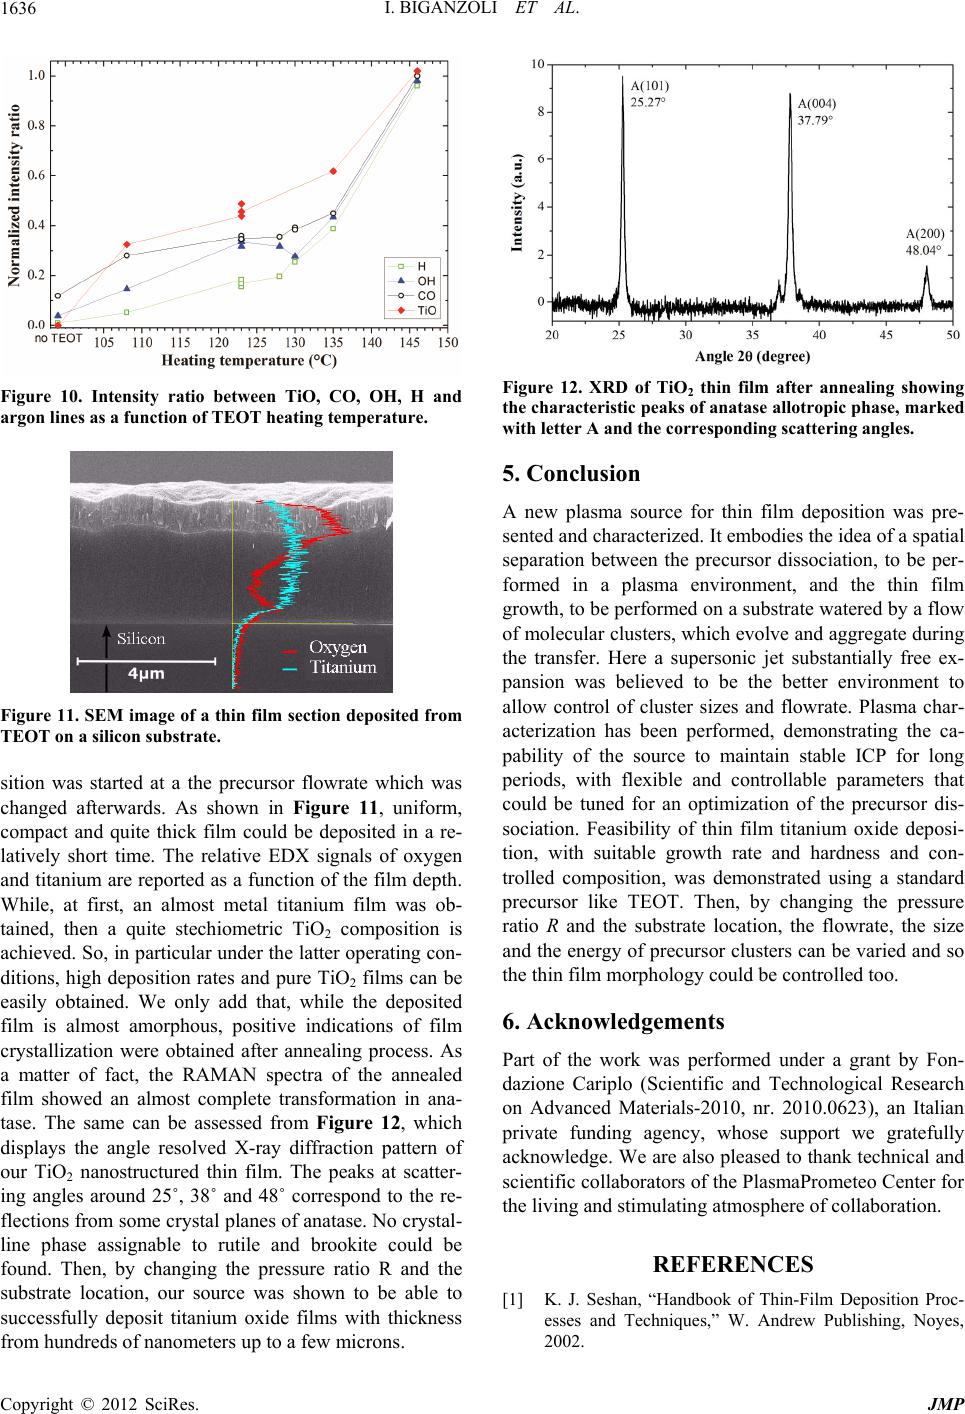 I. BIGANZOLI ET AL. 1636 Figure 10. Intensity ratio between TiO, CO, OH, H and argon lines as a function of TEOT heating temperature. Figure 11. SEM image of a thin film section deposited from TEOT on a silicon substrate. sition was started at a the precursor flowrate which was changed afterwards. As shown in Figure 11, uniform, compact and quite thick film could be deposited in a re- latively short time. The relative EDX signals of oxygen and titanium are reported as a function of the film depth. While, at first, an almost metal titanium film was ob- tained, then a quite stechiometric TiO2 composition is achieved. So, in particular under the latter operating con- ditions, high deposition rates and pure TiO2 films can be easily obtained. We only add that, while the deposited film is almost amorphous, positive indications of film crystallization were obtained after annealing process. As a matter of fact, the RAMAN spectra of the annealed film showed an almost complete transformation in ana- tase. The same can be assessed from Figure 12, which displays the angle resolved X-ray diffraction pattern of our TiO2 nanostructured thin film. The peaks at scatter- ing angles around 25˚, 38˚ and 48˚ correspond to the re- flections from some crystal planes of anatase. No crystal- line phase assignable to rutile and brookite could be found. Then, by changing the pressure ratio R and the substrate location, our source was shown to be able to successfully deposit titanium oxide films with thickness from hundreds of nanometers up to a few microns. Figure 12. XRD of TiO2 thin film after annealing showing the characteristic peaks of anatase allotropic phase, marked with letter A and the corresponding scattering angles. 5. Conclusion A new plasma source for thin film deposition was pre- sented and characterized. It embodies the idea of a spatial separation between the precursor dissociation, to be per- formed in a plasma environment, and the thin film growth, to be performed on a substrate watered by a flow of molecular clusters, which evolve and aggregate during the transfer. Here a supersonic jet substantially free ex- pansion was believed to be the better environment to allow control of cluster sizes and flowrate. Plasma char- acterization has been performed, demonstrating the ca- pability of the source to maintain stable ICP for long periods, with flexible and controllable parameters that could be tuned for an optimization of the precursor dis- sociation. Feasibility of thin film titanium oxide deposi- tion, with suitable growth rate and hardness and con- trolled composition, was demonstrated using a standard precursor like TEOT. Then, by changing the pressure ratio R and the substrate location, the flowrate, the size and the energy of precursor clusters can be varied and so the thin film morphology could be controlled too. 6. Acknowledgements Part of the work was performed under a grant by Fon- dazione Cariplo (Scientific and Technological Research on Advanced Materials-2010, nr. 2010.0623), an Italian private funding agency, whose support we gratefully acknowledge. We are also pleased to thank technical and scientific collaborators of the PlasmaPrometeo Center for the living and stimulating atmosphere of collaboration. REFERENCES [1] K. J. Seshan, “Handbook of Thin-Film Deposition Proc- esses and Techniques,” W. Andrew Publishing, Noyes, 2002. Copyright © 2012 SciRes. JMP 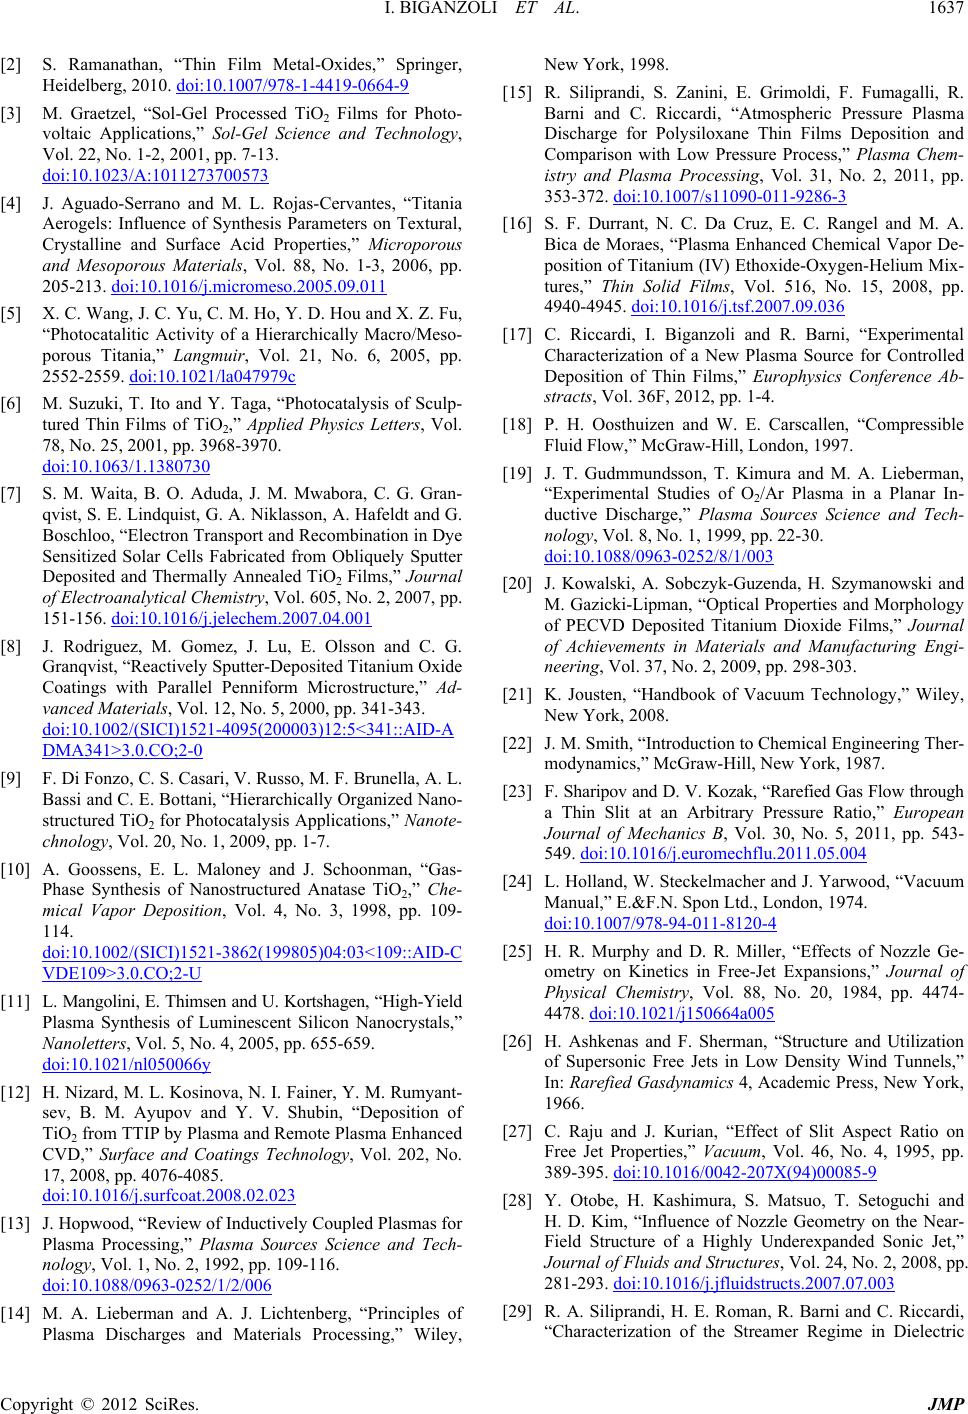 I. BIGANZOLI ET AL. 1637 [2] S. Ramanathan, “Thin Film Metal-Oxides,” Springer, Heidelberg, 2010. doi:10.1007/978-1-4419-0664-9 [3] M. Graetzel, “Sol-Gel Processed TiO2 Films for Photo- voltaic Applications,” Sol-Gel Science and Technology, Vol. 22, No. 1-2, 2001, pp. 7-13. doi:10.1023/A:1011273700573 [4] J. Aguado-Serrano and M. L. Rojas-Cervantes, “Titania Aerogels: Influence of Synthesis Parameters on Textural, Crystalline and Surface Acid Properties,” Microporous and Mesoporous Materials, Vol. 88, No. 1-3, 2006, pp. 205-213. doi:10.1016/j.micromeso.2005.09.011 [5] X. C. Wang, J. C. Yu, C. M. Ho, Y. D. Hou and X. Z. Fu, “Photocatalitic Activity of a Hierarchically Macro/Meso- porous Titania,” Langmuir, Vol. 21, No. 6, 2005, pp. 2552-2559. doi:10.1021/la047979c [6] M. Suzuki, T. Ito and Y. Taga, “Photocatalysis of Sculp- tured Thin Films of TiO2,” Applied Physics Letters, Vol. 78, No. 25, 2001, pp. 3968-3970. doi:10.1063/1.1380730 [7] S. M. Waita, B. O. Aduda, J. M. Mwabora, C. G. Gran- qvist, S. E. Lindquist, G. A. Niklasson, A. Hafeldt and G. Boschloo, “Electron Transport and Recombination in Dye Sensitized Solar Cells Fabricated from Obliquely Sputter Deposited and Thermally Annealed TiO2 Films,” Journal of Electroanalytical Chemistry, Vol. 605, No. 2, 2007, pp. 151-156. doi:10.1016/j.jelechem.2007.04.001 [8] J. Rodriguez, M. Gomez, J. Lu, E. Olsson and C. G. Granqvist, “Reactively Sputter-Deposited Titanium Oxide Coatings with Parallel Penniform Microstructure,” Ad- vanced Materials, Vol. 12, No. 5, 2000, pp. 341-343. doi:10.1002/(SICI)1521-4095(200003)12:5<341::AID-A DMA341>3.0.CO;2-0 [9] F. Di Fonzo, C. S. Casari, V. Russo, M. F. Brunella, A. L. Bassi and C. E. Bottani, “Hierarchically Organized Nano- structured TiO2 for Photocatalysis Applications,” Nanote- chnology, Vol. 20, No. 1, 2009, pp. 1-7. [10] A. Goossens, E. L. Maloney and J. Schoonman, “Gas- Phase Synthesis of Nanostructured Anatase TiO2,” Che- mical Vapor Deposition, Vol. 4, No. 3, 1998, pp. 109- 114. doi:10.1002/(SICI)1521-3862(199805)04:03<109::AID-C VDE109>3.0.CO;2-U [11] L. Mangolini, E. Thimsen and U. Kortshagen, “High-Yield Plasma Synthesis of Luminescent Silicon Nanocrystals,” Nanoletters, Vol. 5, No. 4, 2005, pp. 655-659. doi:10.1021/nl050066y [12] H. Nizard, M. L. Kosinova, N. I. Fainer, Y. M. Rumyant- sev, B. M. Ayupov and Y. V. Shubin, “Deposition of TiO2 from TTIP by Plasma and Remote Plasma Enhanced CVD,” Surface and Coatings Technology, Vol. 202, No. 17, 2008, pp. 4076-4085. doi:10.1016/j.surfcoat.2008.02.023 [13] J. Hopwood, “Review of Inductively Coupled Plasmas for Plasma Processing,” Plasma Sources Science and Tech- nology, Vol. 1, No. 2, 1992, pp. 109-116. doi:10.1088/0963-0252/1/2/006 [14] M. A. Lieberman and A. J. Lichtenberg, “Principles of Plasma Discharges and Materials Processing,” Wiley, New York, 1998. [15] R. Siliprandi, S. Zanini, E. Grimoldi, F. Fumagalli, R. Barni and C. Riccardi, “Atmospheric Pressure Plasma Discharge for Polysiloxane Thin Films Deposition and Comparison with Low Pressure Process,” Plasma Chem- istry and Plasma Processing, Vol. 31, No. 2, 2011, pp. 353-372. doi:10.1007/s11090-011-9286-3 [16] S. F. Durrant, N. C. Da Cruz, E. C. Rangel and M. A. Bica de Moraes, “Plasma Enhanced Chemical Vapor De- position of Titanium (IV) Ethoxide-Oxygen-Helium Mix- tures,” Thin Solid Films, Vol. 516, No. 15, 2008, pp. 4940-4945. doi:10.1016/j.tsf.2007.09.036 [17] C. Riccardi, I. Biganzoli and R. Barni, “Experimental Characterization of a New Plasma Source for Controlled Deposition of Thin Films,” Europhysics Conference Ab- stracts, Vol. 36F, 2012, pp. 1-4. [18] P. H. Oosthuizen and W. E. Carscallen, “Compressible Fluid Flow,” McGraw-Hill, London, 1997. [19] J. T. Gudmmundsson, T. Kimura and M. A. Lieberman, “Experimental Studies of O2/Ar Plasma in a Planar In- ductive Discharge,” Plasma Sources Science and Tech- nology, Vol. 8, No. 1, 1999, pp. 22-30. doi:10.1088/0963-0252/8/1/003 [20] J. Kowalski, A. Sobczyk-Guzenda, H. Szymanowski and M. Gazicki-Lipman, “Optical Properties and Morphology of PECVD Deposited Titanium Dioxide Films,” Journal of Achievements in Materials and Manufacturing Engi- neering, Vol. 37, No. 2, 2009, pp. 298-303. [21] K. Jousten, “Handbook of Vacuum Technology,” Wiley, New York, 2008. [22] J. M. Smith, “Introduction to Chemical Engineering Ther- modynamics,” McGraw-Hill, New York, 1987. [23] F. Sharipov and D. V. Kozak, “Rarefied Gas Flow through a Thin Slit at an Arbitrary Pressure Ratio,” European Journal of Mechanics B, Vol. 30, No. 5, 2011, pp. 543- 549. doi:10.1016/j.euromechflu.2011.05.004 [24] L. Holland, W. Steckelmacher and J. Yarwood, “Vacuum Manual,” E.&F.N. Spon Ltd., London, 1974. doi:10.1007/978-94-011-8120-4 [25] H. R. Murphy and D. R. Miller, “Effects of Nozzle Ge- ometry on Kinetics in Free-Jet Expansions,” Journal of Physical Chemistry, Vol. 88, No. 20, 1984, pp. 4474- 4478. doi:10.1021/j150664a005 [26] H. Ashkenas and F. Sherman, “Structure and Utilization of Supersonic Free Jets in Low Density Wind Tunnels,” In: Rarefied Gasdynamics 4, Academic Press, New York, 1966. [27] C. Raju and J. Kurian, “Effect of Slit Aspect Ratio on Free Jet Properties,” Vacuum, Vol. 46, No. 4, 1995, pp. 389-395. doi:10.1016/0042-207X(94)00085-9 [28] Y. Otobe, H. Kashimura, S. Matsuo, T. Setoguchi and H. D. Kim, “Influence of Nozzle Geometry on the Near- Field Structure of a Highly Underexpanded Sonic Jet,” Journal of Fluids and Structures, Vol. 24, No. 2, 2008, pp. 281-293. doi:10.1016/j.jfluidstructs.2007.07.003 [29] R. A. Siliprandi, H. E. Roman, R. Barni and C. Riccardi, “Characterization of the Streamer Regime in Dielectric Copyright © 2012 SciRes. JMP 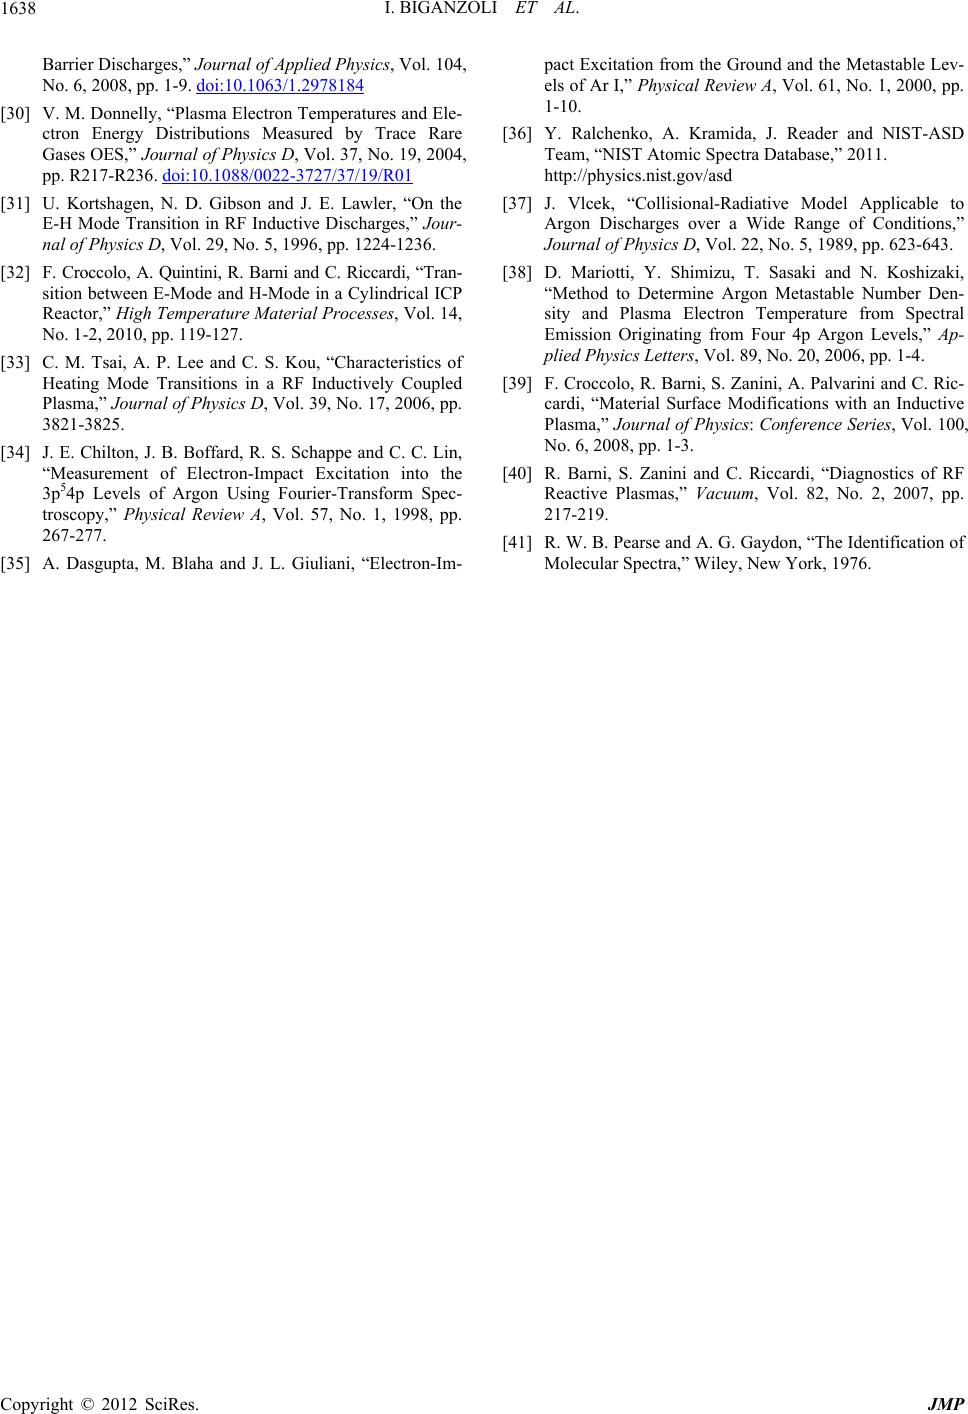 I. BIGANZOLI ET AL. Copyright © 2012 SciRes. JMP 1638 Barrier Discharges,” Journal of Applied Physics, Vol. 104, No. 6, 2008, pp. 1-9. doi:10.1063/1.2978184 [30] V. M. Donnelly, “Plasma Electron Temperatures and Ele- ctron Energy Distributions Measured by Trace Rare Gases OES,” Journal of Physics D, Vol. 37, No. 19, 2004, pp. R217-R236. doi:10.1088/0022-3727/37/19/R01 [31] U. Kortshagen, N. D. Gibson and J. E. Lawler, “On the E-H Mode Transition in RF Inductive Discharges,” Jour- nal of Physics D, Vol. 29, No. 5, 1996, pp. 1224-1236. [32] F. Croccolo, A. Quintini, R. Barni and C. Riccardi, “Tran- sition between E-Mode and H-Mode in a Cylindrical ICP Reactor,” High Temperature Material Processes, Vol. 14, No. 1-2, 2010, pp. 119-127. [33] C. M. Tsai, A. P. Lee and C. S. Kou, “Characteristics of Heating Mode Transitions in a RF Inductively Coupled Plasma,” Journal of Physics D, Vol. 39, No. 17, 2006, pp. 3821-3825. [34] J. E. Chilton, J. B. Boffard, R. S. Schappe and C. C. Lin, “Measurement of Electron-Impact Excitation into the 3p54p Levels of Argon Using Fourier-Transform Spec- troscopy,” Physical Review A, Vol. 57, No. 1, 1998, pp. 267-277. [35] A. Dasgupta, M. Blaha and J. L. Giuliani, “Electron-Im- pact Excitation from the Ground and the Metastable Lev- els of Ar I,” Physical Review A, Vol. 61, No. 1, 2000, pp. 1-10. [36] Y. Ralchenko, A. Kramida, J. Reader and NIST-ASD Team, “NIST Atomic Spectra Database,” 2011. http://physics.nist.gov/asd [37] J. Vlcek, “Collisional-Radiative Model Applicable to Argon Discharges over a Wide Range of Conditions,” Journal of Physics D, Vol. 22, No. 5, 1989, pp. 623-643. [38] D. Mariotti, Y. Shimizu, T. Sasaki and N. Koshizaki, “Method to Determine Argon Metastable Number Den- sity and Plasma Electron Temperature from Spectral Emission Originating from Four 4p Argon Levels,” Ap- plied Physics Letters, Vol. 89, No. 20, 2006, pp. 1-4. [39] F. Croccolo, R. Barni, S. Zanini, A. Palvarini and C. Ric- cardi, “Material Surface Modifications with an Inductive Plasma,” Journal of Physics: Conference Series, Vol. 100, No. 6, 2008, pp. 1-3. [40] R. Barni, S. Zanini and C. Riccardi, “Diagnostics of RF Reactive Plasmas,” Vacuum, Vol. 82, No. 2, 2007, pp. 217-219. [41] R. W. B. Pearse and A. G. Gaydon, “The Identification of Molecular Spectra,” Wiley, New York, 1976.
|