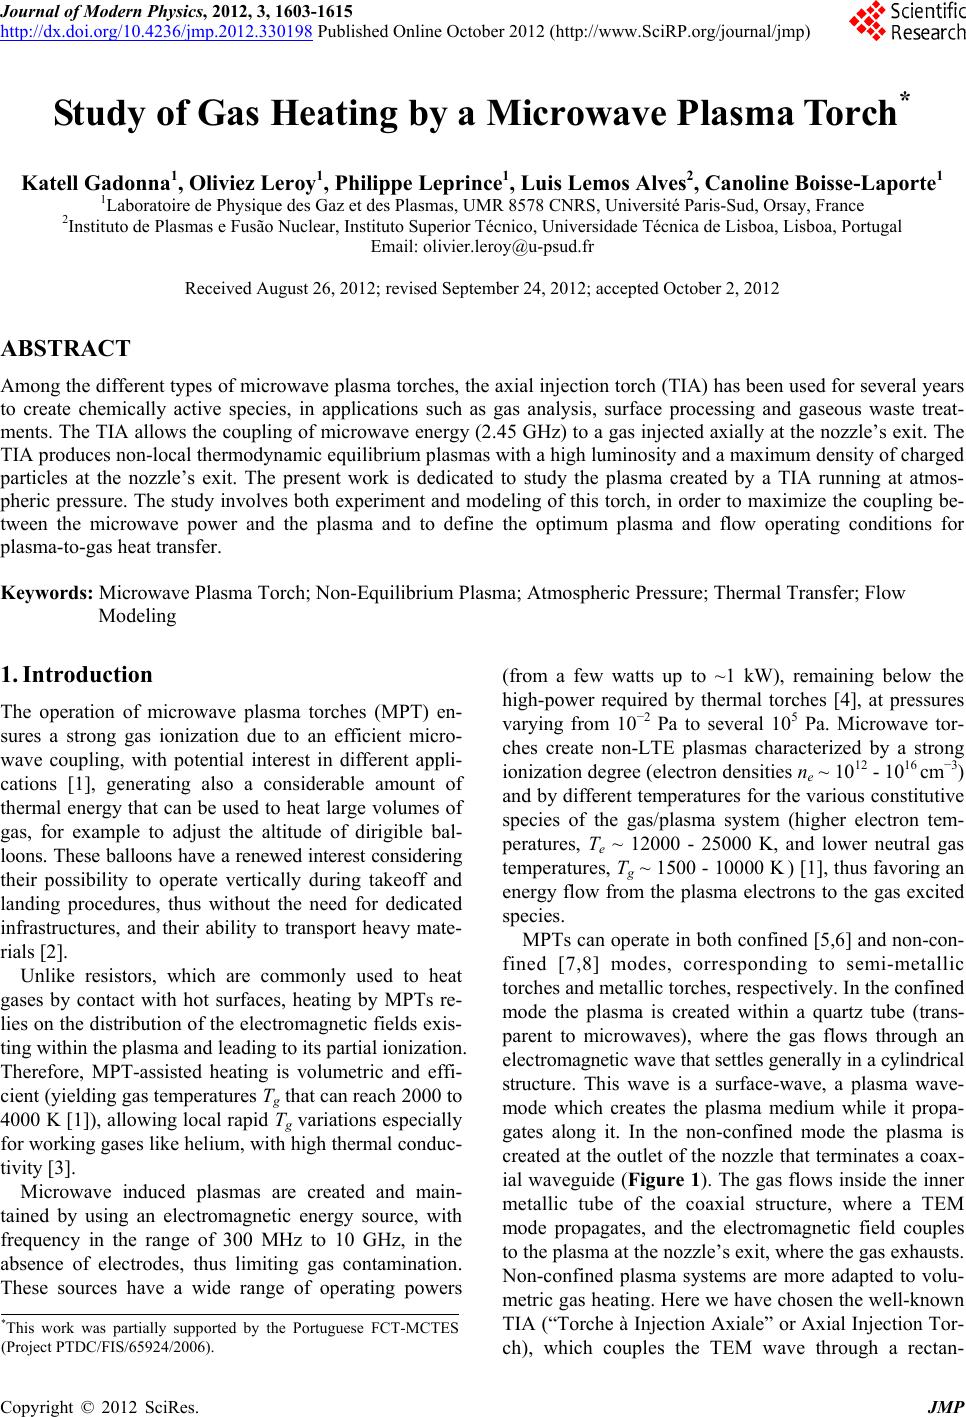
 Journal of Modern Physics, 2012, 3, 1603-1615 http://dx.doi.org/10.4236/jmp.2012.330198 Published Online October 2012 (http://www.SciRP.org/journal/jmp) Study of Gas Heating by a Microwave Plasma Torch* Katell Gadonna1, Oliviez Leroy1, Philippe Leprince1, Luis Lemos Alves2, Canoline Boisse-Laporte1 1Laboratoire de Physique des Gaz et des Plasmas, UMR 8578 CNRS, Université Paris-Sud, Orsay, France 2Instituto de Plasmas e Fusão Nuclear, Instituto Superior Técnico, Universidade Técnica de Lisboa, Lisboa, Portugal Email: olivier.leroy@u-psud.fr Received August 26, 2012; revised September 24, 2012; accepted October 2, 2012 ABSTRACT Among the different types of microwave plasma torches, the axial injection torch (TIA) has been used for several years to create chemically active species, in applications such as gas analysis, surface processing and gaseous waste treat- ments. The TIA allows the coupling of microwave energy (2.45 GHz) to a gas injected axially at the nozzle’s exit. The TIA produces non-local thermodynamic equilibrium plasmas with a high luminosity and a maximum density of charged particles at the nozzle’s exit. The present work is dedicated to study the plasma created by a TIA running at atmos- pheric pressure. The study involves both experiment and modeling of this torch, in order to maximize the coupling be- tween the microwave power and the plasma and to define the optimum plasma and flow operating conditions for plasma-to-gas heat transfer. Keywords: Microwave Plasma Torch; Non-Equilibrium Plasma; Atmospheric Pressure; Thermal Transfer; Flow Modeling 1. Introduction The operation of microwave plasma torches (MPT) en- sures a strong gas ionization due to an efficient micro- wave coupling, with potential interest in different appli- cations [1], generating also a considerable amount of thermal energy that can be used to heat large volumes of gas, for example to adjust the altitude of dirigible bal- loons. These balloons have a renewed interest considering their possibility to operate vertically during takeoff and landing procedures, thus without the need for dedicated infrastructures, and their ability to transport heavy mate- rials [2]. Unlike resistors, which are commonly used to heat gases by contact with hot surfaces, heating by MPTs re- lies on the distribution of the electromagnetic fields exis- ting within the plasma and leading to its partial ionization. Therefore, MPT-assisted heating is volumetric and effi- cient (yielding gas temperatures Tg that can reach 2000 to 4000 K [1]), allowing local rapid Tg variations especially for working gases like helium, with high thermal conduc- tivity [3]. Microwave induced plasmas are created and main- tained by using an electromagnetic energy source, with frequency in the range of 300 MHz to 10 GHz, in the absence of electrodes, thus limiting gas contamination. These sources have a wide range of operating powers (from a few watts up to ~1 kW), remaining below the high-power required by thermal torches [4], at pressures varying from 10−2 Pa to several 105 Pa. Microwave tor- ches create non-LTE plasmas characterized by a strong ionization degree (electron densities ne ~ 1012 - 1016 cm−3) and by different temperatures for the various constitutive species of the gas/plasma system (higher electron tem- peratures, Te ~ 12000 - 25000 K, and lower neutral gas temperatures, Tg ~ 1500 - 10000 K ) [1], thus favoring an energy flow from the plasma electrons to the gas excited species. MPTs can operate in both confined [5,6] and non-con- fined [7,8] modes, corresponding to semi-metallic torches and metallic torches, respectively. In the confined mode the plasma is created within a quartz tube (trans- parent to microwaves), where the gas flows through an electromagnetic wave that settles generally in a cylindrical structure. This wave is a surface-wave, a plasma wave- mode which creates the plasma medium while it propa- gates along it. In the non-confined mode the plasma is created at the outlet of the nozzle that terminates a coax- ial waveguide (Figure 1). The gas flows inside the inner metallic tube of the coaxial structure, where a TEM mode propagates, and the electromagnetic field couples to the plasma at the nozzle’s exit, where the gas exhausts. Non-confined plasma systems are more adapted to volu- metric gas heating. Here we have chosen the well-known TIA (“Torche à Injection Axiale” or Axial Injection Tor- ch), which couples the TEM wave through a rectan- *This work was partially supported by the Portuguese FCT-MCTES (Project PTDC/FIS/65924/2006). C opyright © 2012 SciRes. JMP 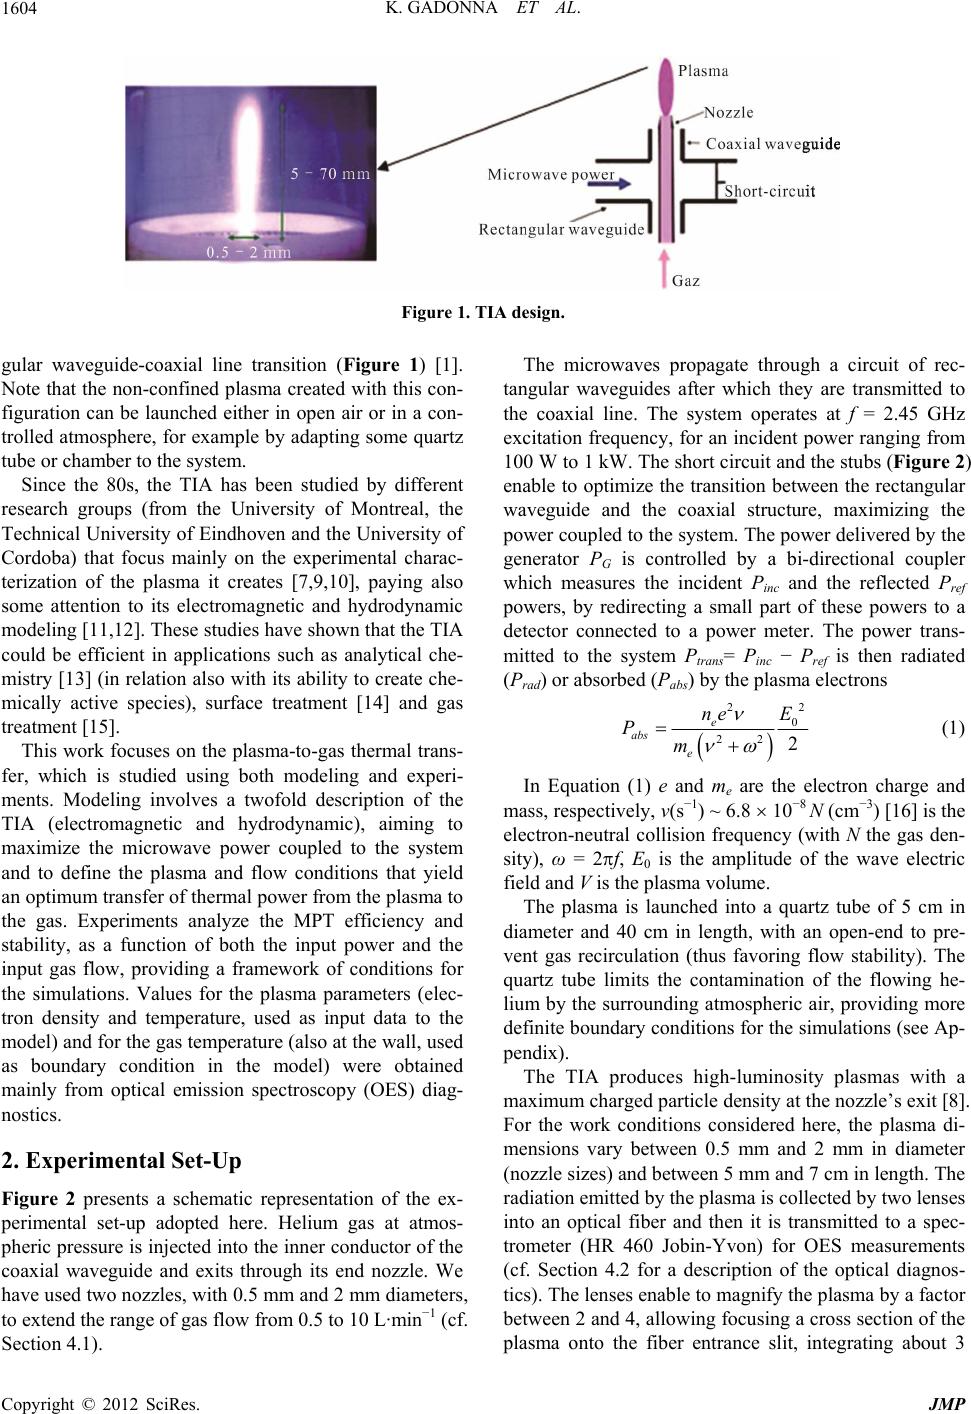 K. GADONNA ET AL. 1604 Figure 1. TIA design. gular waveguide-coaxial line transition (Figure 1) [1]. Note that the non-confined plasma created with this con- figuration can be launched either in open air or in a con- trolled atmosphere, for example by adapting some quartz tube or chamber to the system. Since the 80s, the TIA has been studied by different research groups (from the University of Montreal, the Technical University of Eindhoven and the University of Cordoba) that focus mainly on the experimental charac- terization of the plasma it creates [7,9,10], paying also some attention to its electromagnetic and hydrodynamic modeling [11,12]. These studies have shown that the TIA could be efficient in applications such as analytical che- mistry [13] (in relation also with its ability to create che- mically active species), surface treatment [14] and gas treatment [15]. This work focuses on the plasma-to-gas thermal trans- fer, which is studied using both modeling and experi- ments. Modeling involves a twofold description of the TIA (electromagnetic and hydrodynamic), aiming to maximize the microwave power coupled to the system and to define the plasma and flow conditions that yield an optimum transfer of thermal power from the plasma to the gas. Experiments analyze the MPT efficiency and stability, as a function of both the input power and the input gas flow, providing a framework of conditions for the simulations. Values for the plasma parameters (elec- tron density and temperature, used as input data to the model) and for the gas temperature (also at the wall, used as boundary condition in the model) were obtained mainly from optical emission spectroscopy (OES) diag- nostics. 2. Experimental Set-Up Figure 2 presents a schematic representation of the ex- perimental set-up adopted here. Helium gas at atmos- pheric pressure is injected into the inner conductor of the coaxial waveguide and exits through its end nozzle. We have used two nozzles, with 0.5 mm and 2 mm diameters, to extend the range of gas flow from 0.5 to 10 L·min−1 (cf. Section 4.1). The microwaves propagate through a circuit of rec- tangular waveguides after which they are transmitted to the coaxial line. The system operates at f = 2.45 GHz excitation frequency, for an incident power ranging from 100 W to 1 kW. The short circuit and the stubs (Figure 2) enable to optimize the transition between the rectangular waveguide and the coaxial structure, maximizing the power coupled to the system. The power delivered by the generator PG is controlled by a bi-directional coupler which measures the incident Pinc and the reflected Pref powers, by redirecting a small part of these powers to a detector connected to a power meter. The power trans- mitted to the system Ptrans= Pinc − Pref is then radiated (Prad) or absorbed (Pabs) by the plasma electrons 22 0 22 2 e abs e ne E Pm (1) In Equation (1) e and me are the electron charge and mass, respectively, ν(s−1) ~ 6.8 10−8 N (cm−3) [16] is the electron-neutral collision frequency (with N the gas den- sity), ω = 2f, E0 is the amplitude of the wave electric field and V is the plasma volume. The plasma is launched into a quartz tube of 5 cm in diameter and 40 cm in length, with an open-end to pre- vent gas recirculation (thus favoring flow stability). The quartz tube limits the contamination of the flowing he- lium by the surrounding atmospheric air, providing more definite boundary conditions for the simulations (see Ap- pendix). The TIA produces high-luminosity plasmas with a maximum charged particle density at the nozzle’s exit [8]. For the work conditions considered here, the plasma di- mensions vary between 0.5 mm and 2 mm in diameter (nozzle sizes) and between 5 mm and 7 cm in length. The radiation emitted by the plasma is collected by two lenses into an optical fiber and then it is transmitted to a spec- trometer (HR 460 Jobin-Yvon) for OES measurements (cf. Section 4.2 for a description of the optical diagnos- tics). The lenses enable to magnify the plasma by a factor between 2 and 4, allowing focusing a cross section of the plasma onto the fiber entrane slit, integrating about 3 c Copyright © 2012 SciRes. JMP  K. GADONNA ET AL. 1605 Figure 2. Schematic representation of the experimental set-up. mm of plasma height. It can be seen that the plasma de- velops about 1 mm above the nozzle outlet. 3. Modeling The complete modeling of a MPT requires the coupled description of its microwave excitation and the transport of charged and neutral particles in a flow regime. This goal can be achieved with the development of the fol- lowing three independent but complementary simulation modules (Figure 3): An electromagnetic (EM) module which solves Max- well’s equations; A hydrodynamic (HD) module which solves Navier- Stokes’ equations; A plasma (P) module which solves the electron and ion particle and energy transport equations. Figure 3 schematizes the articulation between these calculation modules. The P-module receives as input data the information obtained from the EM-module, i.e. the electric field distribution E and the power absorbed by the plasma Pabs. Reciprocally, these quantities depend on the plasma parameters (ne, Te, ν), obtained as output from the P-module, via the plasma conductivity σ [see also Equation (1)]. Figure 3. Modeling scheme of a MPT, based on the coupling of three independent simulation modules: an electroma- gnetic (EM) module, a hydrodynamic (HD) module and a plasma (P) module. 2 e e ne mj (2) Here, the electron density and the electron-neutral col- lision frequency depend on the electron temperature Te and on the gas density N (hence on its temperature Tg), which also affect the dynamics of the charged particles with the plasma. Therefore the HD-module output (v, Tg, N), where v is the gas flow velocity, are used as input to the P-module. Conversely, the plasma modifies the gas flow due to the ion drift and the gas heating, and so the plasma parameters are input to the HD-module. Overall, the interlinked P, EM and HD features of the problem require an iterative solution between the corre- sponding calculation modules. This complexity is ampli- fied by two extra difficulties: 1) the absence of closed boundaries defining the plasma geometry and 2) the multi-component features with the transport of species. The problem can nevertheless be simplified, by reducing its dimension to a 2D description (taking advantage of possible symmetries), and by imposing some work con- ditions to replace the self-consistent solution to the dif- ferent modules. In this work, we have developed the 3D EM and 2D HD modules, under the COMSOL Multiphysics platform [17], replacing the P-module (still in development) by some given conditions (both in profile and in intensity) for the plasma electron density and temperature. Details about the model equations, the calculation domains and the boundary conditions considered in this study are pre- sented in appendix as supplementary information. Our main interest concerns the heat transfer between the plasma and the gas, which justifies the investment in describing the electromagnetic and the hydrodynamic characteristics of MPTs. The goal is to define the work conditions (geometry, plasma, flow) which maximize 1) the power coupling between the microwave and the plasma and 2) the power transfer from the plasma to the gas, in order to obtain an efficient gas heating. Copyright © 2012 SciRes. JMP  K. GADONNA ET AL. 1606 4. Experiments Information on the MPT efficiency and stability, as a function of both the input power and the input gas flow, were obtained experimentally. Measurements enabled to define a framework of input data for the simulations, providing also values for the plasma parameters and the gas temperature, to be used in the model. 4.1. Work Conditions Figure 4 presents coupling efficiency diagrams, of Pref/Pinc vs. the power delivered by the generator PG and the input gas flow S, for the 2 mm (Figure 4(a)) and 0.5 mm (Figure 4(b)) nozzle diameters used here. These dia- grams define the operating conditions of the TIA. The grey areas correspond to the cases where no stable plasma is produced. In all the other areas, the plasma can be ignited with Pref/Pinc < 10%, i.e. power coupling (1 − Pref/Pinc) > 90%. The red areas are the optimum operating conditions, with power coupling >99.9%. Measurements yield a very good power coupling (>90%) for 400 to 800 W input power and 1 to 9 L·min−1 gas flow, and therefore the EM and the HD modeling will limit to these work conditions. Note that Reynolds’ number is well below 2000 for these flows, which allows adopting a laminar regime in the HD description. The diagrams of Figure 4 reveal also the advantage in using a larger nozzle diame- ter, as it enables to operate the TIA over a more extended range of parameters. Typically, a very good power coupling (>90%) is obtained at gas flows between 5 and 9 L·min−1 for the 2 mm diameter nozzle and between 1 and 3 L·min−1 for the 0.5 mm diameter nozzle. These flows correspond to the average input gas velocities given in Table 1, where it is shown that the 2 mm diameter nozzle supports higher flow rates while the 0.5 mm nozzle induces higher velo- cities. 4.2. Optical Diagnostics The gas temperature is estimated from the ro-vibrational spectrum of the 2nd positive system of nitrogen (incorpo- rated from the air envelop surrounding the helium plas- ma), assuming that these molecules are in equilibrium with the plasma gas. The experimental spectra, recorded using a CCD detector with spectral resolution of ~3 Å, are compared with simulations performed using the SPE- CAIR program [18]. Results yield Tg ~ 1500 - 3000K. The temperature on the wall of the 5 cm diameter quartz tube is measured by a thermocouple along its 40 cm length. A maximum value turns out to be around 600 K and located about 20 cm above the nozzle. The electron density is deduced from Stark broadening measurements of the Hβ line [19,20], recorded using a (a) (b) Figure 4. Coupling efficiency diagram, Pref/Pinc vs (PG, S), for TIAs with nozzle diameter of 2 mm (a) and 0.5 mm (b). PG is the microwave power in Watt delivered by the gen- erator, Pref and Pinc are respectively the reflected and inci- dent power measured with a directional couplers and S is the helium gas flow in L/min. The red areas signal the op- erating conditions for a microwave power coupling better than 99.9%. The gray areas signal the operating conditions for which no stable plasma is produced. Table 1. Gas flows and average velocities, for the nozzle diameters considered here. 2 mm diameter nozzle 0.5 mm diameter nozzle Flow (L·min−1) Velocity (m·s−1) Flow (L·min−1) Velocity (m·s−1) 5 27 1 85 7 37 2 170 9 48 3 255 Copyright © 2012 SciRes. JMP  K. GADONNA ET AL. 1607 PM detector (spectral resolution of ~1 Å). Results yield ne ~ 2 1014 - 4 1014 cm−3 for the 2 mm nozzle and ne ~ 1 1015 - 1.5 1015 cm−3 for the 0.5 mm nozzle, consis- tent with values obtained in previous studies [8-15]. The electron temperature could not be measured due to the experimental lack of precision. We estimate Te ~ 17,000 - 25,000 K, according to the work of Torres et al. [21] and Jonkers et al. [10]. 5. Results 5.1. Electromagnetic Module The EM-module was used to study the interaction be- tween the applied microwave field and the plasma. As mentioned in Section 3, the calculations were made im- posing the plasma conditions (values and profiles for the electron density and temperature), which are given in the appendix. These conditions agree with our experimental observations and are also supported by other works [9, 11,21]. The plasma impedance changes with ne and ν (see Equation (2)) [22], thus affecting the wave-plasma power coupling. Experimentally, after the plasma ignition the system can return to optimum power coupling conditions, at fixed frequency, by adjusting the short-circuit position. In the simulations, it is easier to work for a given excita- tion structure (hence a fixed short-circuit position) to obtain a frequency response at various maximum elec- tron densities neMAX. The frequency response of the power transferred to the TIA is given in Figure 5 for neMAX = 3 1014 - 12 1014 cm−3. The plasma dimensions (2 mm in diameter and 3 cm in length) correspond to those obtained with the 2 mm diameter nozzle. The first observation from this figure is that, for a device tuned in vacuum at 2.45 GHz Figure 5. Power coupled to the TIA as a function of the excitation frequency, for the following maximum electron densities (in 1014 cm−3): 3 (black curve), 6 (red), 9 (blue) and 12 (green) and for plasma dimensions of 2 mm diameter and 3 cm length. excitation frequency, the power coupling remains very good (more than 90% in all the studied cases), regardless the maximum electron density imposed. Note that al- though the resonance frequency is above 2.45 GHz with the plasma on, the maximum coupled power is shifted to lower frequencies as neMAX increases. Figure 6(a) shows the spatial distribution of the time- averaged Poynting vector intensity, corresponding to the flux of electromagnetic energy carried by the excitation wave. Note that in the central region of the device the Poynting vector is directed towards the plasma, which absorbs most of the energy. The remaining part of the energy is radiated. Figure 6(b) plots the power absorbed by the plasma as (a) (b) Figure 6. (a) Contour-plot (r,z) in mm, near the nozzle, of the decimal logarithm of the time-average intensity of the Poynting vector, at neMAX = 3 1014 cm−3; (b) Power ab- sorbed by the plasma as a function of the maximum elec- tron density. The calculations were carried out at 2.45 GHz frequency and 500 W input power and for plasma dimen- sions of 2 mm diameter and 3 cm length. Copyright © 2012 SciRes. JMP  K. GADONNA ET AL. 1608 a function of the maximum electron density. For neMAX = 3 1014 - 12 1014 cm−3 one observes an increase in Pabs, as in this case the power absorbed by the plasma con- tributes to sustain the propagation medium of the wave. Above neMAX = 12 1014 cm−3 the plasma conductivity becomes comparable to that of a metal, and its behavior is similar to a radiating antenna. The competition be- tween the power required to sustain the plasma and the power radiated by the “plasma antenna” can justify the decrease in Pabs as neMAX varies between 12 1014 and 24 1014 cm−3 [10]. Note that the energy losses by radiation can be estimated. For instance, in the case of the 2 mm nozzle, for a typical electron density of 3 1014 cm−3 we obtain at 2.45 GHz around 40% of 500 W i.e. 200 W of coupled power (see Figure 5), and since around 175 W are absorbed by the plasma (see Figure 6(b)), we can deduce that 25 W are lost by radiation, which represents less than 15% of the coupled power. 5.2. Hydrodynamic Module The HD-module was used to analyze the influence of the plasma parameters and of the inlet flow rate on the plasma-to-gas thermal transfer. 5.2.1. Influence of Plasma Parameters We remind here the main effects of the plasma parame- ters on the HD behavior of the gas/plasma system, which have been presented previously [23]. As shown in Figure 7, the gas temperature is sensitive to changes in the elec- tron density: Tg increases with ne, because the power transfer from the plasma to the gas is mainly due to elec- tron-neutral collisions, thus becoming more effective at Figure 7. Axial profile (at r = 0) of the gas temperature Tg within the plasma region for the 2 mm nozzle ( 30 mm plasma length), calculated at 5 L·min−1 input gas flow, for TeMAX = 2 × 10⁴ K and the following neMAX values (in 1014 cm−3): 3 (black curve), 6 (red), 9 (blue) and 12 (green). The solid (dashed) curves correspond to profiles calculated with (without) the ion drift terms in the HD equations. high energy-density exchange rates (see last term of Equation (ix) in the Appendix, depending on the neTeν product). The results in Figure 7 show also that intro- ducing the ion drift terms in the equations of the HD- module (see last terms of Equations (xii) and (xiii) in the Appendix) reduces the gas temperature, due to a decrease in the residence time of the heavy species for heat ex- change. 5.2.2. Influence of Inlet Flow Rate Figure 8 analyses the influence on Tg of the gas inlet flow rate, for the nozzle diameters adopted in this work. According to our experimental observations, the input (a) (b) Figure 8. Axial profile (at r = 0) of the gas temperature Tg within the plasma region, (a) calculated for the 2 mm dia- meter nozzle (30 mm plasma length) at neMAX = 3 × 1014 cm−3, TeMAX = 2 × 10⁴ K and the following input gas flows (in L·min−1): 1 (black curves), 3 (red), 5 (blue) and 7 (green); (b) calculated for the 0.5 mm diameter nozzle (10 mm plasma length) at neMAX = 12 × 1014 cm−3, TeMAX = 2 × 10⁴ K and the following input gas flows (in L·min−1): 0.25 (black curves), 0.5 (red), 0.75 (blue) and 1 (green). The solid (dashed) curves correspond to profiles calculated with (without) the ion drift terms in the HD equations. Copyright © 2012 SciRes. JMP  K. GADONNA ET AL. 1609 gas flows are lower (see Section 4.1), the maximum elec- tron density is higher and the plasma length is shorter for the smaller diameter nozzle. By analyzing each Figures 8(a) and (b) one concludes that an increase in the input gas flow reduces the effici- ency of heat transfer between the gas and the plasma, leading to longer relaxation lengths in the axial direction for the gas temperature profile and to a reduction in its maximum value. For the fixed ne and Te profiles consi- dered, the maximum gas temperature in the axial direc- tion is located around 8 - 10 mm for the 2 mm diameter nozzle and near 3 - 4 mm for the 0.5 mm diameter nozzle, after the position of neMAX (at z = 1 mm, see Appendix). By comparing Figures 8(a) and (b) one observes that the 2 mm diameter nozzle allows obtaining higher gas temperatures, although the density is lower for this noz- zle. This low neMAX value is compensated by the lower relaxation lengths (lower gas velocity, see Table 1) in this case even if the gas flow is higher, due to larger nozzle diameter, yielding an overall increase in Tg. This point will be discussed in the experimental temperature results (Section 5.3). These observations show that the HD features of the gas/plasma system, and particularly the definition of the gas temperature, are the combined result of local electron heating (via electron-neutral collisions) and non-local heat transport (via convection and ion drift effects). Note that ion drift effects are more important at low input gas flows, for which the relative influence of these terms is enhanced. 5.3. Experimental Gas Temperature Figure 9 presents experimental values of Tg, obtained by OES of the ro-vibrational band of nitrogen near the noz- zle (see Section 4.2), as a function of the input gas flow for various input powers and for the nozzle diameters considered here. An observation of this figure reveals that: 1) the gas temperature is higher when the TIA ope- rates with the larger 2 mm diameter nozzle; 2) Tg de- creases when the flow increases and/or the input power decreases. The latter results are obvious for the 0.5 mm diameter nozzle, and can be drawn also for the 2 mm one at low input gas flows, in which case there is less com- petition between the effects of the flow and the input power (or the electron density) to define the gas tem- perature value. The previous observations are in qualitative agreement with the simulation results presented in Section 5.2.2, the differences between the calculated and the measured Tg absolute values being motivated (at least partially) by the use of imposed plasma profiles in the simulations. This quantitative disagreement can introduce also a discussion about the experimental results, beyond the mere obser- vation that measurements have a significant uncertainty, confirmed by the error bars depicted in Figure 9. In fact, measurements use the nitrogen dragged into the plasma jet from the air envelope which surrounds it, meaning that probably the experimental gas temperature does not accurately account for the plasma-to-gas heat transfer occurring near the discharge axis. Note that our intention here was to probe the plasma as it is created, thus with the molecular species coming from O2, N2, …, whose presence is expected to introduce a significant difference between the OES-diagnosed ro-vibrational temperature and the pure helium gas temperature [24]. Figure 10 plots the measured gas temperature as a function of the average input gas velocity, for the two nozzle diameters adopted in this work. As mentioned in Section 5.2.1, the gas temperature values are very sen- sitive to the residence time of the heavy species for heat exchange. Therefore, an increase in the gas velocity (due to an increase in the flow and/or a reduction in the nozzle (a) (b) Figure 9. Measured gas temperature Tg vs. input gas flow S, for TIAs with nozzle diameters of 2 mm (a) and 0.5 mm (b), obtained for the following PG values (in W): 400 (green curves), 500 (blue), 600 (black) and 700 (red). Copyright © 2012 SciRes. JMP  K. GADONNA ET AL. 1610 Figure 10. Measured gas temperature Tg vs. average input gas velocity <vi>, for TIAs with nozzle diameters of 0.5 mm (dashed lines) and 2 mm (solid lines) for microwave powers of 600 W (black) and 700 W (red). diameter, see Table 1), is responsible for a decrease in the residence time (typically of ~1 ms and ~0.1 ms for the 2 mm and 0.5 mm nozzle diameters, respectively, at 5 and 1 L·min−1 input gas flow), thus for a reduction in Tg as observed in Figure 10. 6. Conclusions The work presented in this paper was devoted to the study of plasmas created by microwave (2.45 GHz fre- quency) axial injection torches (TIA), running in atmo- spheric helium in air, in order to study the plasma-to-gas energy transfer for gas heating. The work adopted two complementary approaches based on simulations and experiments. The TIA is a very complex discharge due to the many parameters involved in its operation: dimensions, gas flow, power input. The plasma obtained is not in ther- modynamic equilibrium and is very inhomogeneous. In addition, it interacts with the surrounding external me- dium (air), even if the plasma is launched into some con- finement chamber, such as a quartz tube. The present stu- dies were conducted to maximize the coupling between the microwave power and the plasma and to define the optimum plasma and flow operating conditions for plas- ma-to-gas heat transfer. Modeling involved the development of electromagnetic (EM) and hydrodynamic (HD) models to analyze the in- fluence of the plasma parameters on the microwave power absorbed by the plasma and on the gas temperature. Experiments analyzed the torch efficiency and stability, as a function of both the input power and the input gas flow, providing a framework of conditions for the simu- lations. Values for the plasma parameters (electron den- sity and temperature, used as input data to the model) and for the gas temperature (also at the wall, used as bound- ary condition in the model) were obtained mainly from optical emission spectroscopy diagnostics. Results yielded a good coupling efficiency (>90%) of the TIA for input powers of 400-800 W (corresponding to electron densities of 1014 - 1015 cm−3 and estimated elec- tron temperatures of 17,000 - 25,000 K) and for input gas flows of 5 - 9 L·min−1 (for a nozzle with 2 mm in dia- meter) and of 1 - 3 L·min−1 (for another with 0.5 mm). Under these conditions, simulations showed that the electron density affects both the power absorbed by the plasma and the gas temperature, the latter being en- hanced by higher electron energy densities transferred to the gas by electron-neutral collisions. It was also found that by reducing the input gas velocity one increases the residence time of heavy species for collisional heat ex- change, thus increasing the gas temperature. The TIA with the 2 mm diameter nozzle, for which the gas veloci- ties are lower (and thus the residence time of species is longer), favors gas heating although the electron density is lower in this case. A comparison between calculations and measurements of the gas temperature provided good qualitative agree- ment for the influence of the plasma parameters and the gas flow on results. However, model predictions for the gas temperature overestimate its measurements probably due to a combination of different reasons, such as: 1) the dimensions and parameters characterizing the plasma (density and temperature) were not self-consistently cal- culated, and remained fixed for the different work con- ditions considered (microwave power and gas flow); 2) the experimental gas temperatures were obtained from the ro-vibrational spectrum of the second positive system of N2, dragged into the helium plasma jet from its sur- rounding air envelop. The model evaluates the gas tem- perature at the plasma center (assumed hotter) and does not account for the incorporation of molecular species (which may decrease the gas temperature value). Overall, the present work reveals the high potential of microwave TIAs for gas heating, demonstrating the feasi- bility of its stable operation, at low input powers and moderate gas flows, to obtain gas temperatures of 3000 - 4000 K. REFERENCES [1] C. Tendero, C. Tixier, P. Tristant, J. Demaison and P. Leprince, “Atmospheric Pressure Plasmas: A Review,” Spectrochimica Acta Part B: Atomic Spectroscopy, Vol. 61, No. 1, 2006, pp. 2-30. doi:10.1016/j.sab.2005.10.003 [2] N. Azouz, S. Chaabani, J. Lerbet and A. Abichou, “Com- putation of the Added Masses of an Unconventional Air- ship,” Journal of Applied Mathematics, Vol. 2012, 2012, Article ID: 714627. [3] R. B. Bird, W. E. Steward and E. N. Lightfoot, “Trans- port phenomena,” John Wiley, Hoboken, 1960. [4] P. Fauchais and A. Vardelle, “Thermal Plasmas,” IEEE Copyright © 2012 SciRes. JMP  K. GADONNA ET AL. Copyright © 2012 SciRes. JMP 1611 Transactions on Plasma Science, Vol. 25, No. 6, 1997, pp. 1258-1280. doi:10.1109/27.650901 [5] E. A. H. Timmermans, J. Jonkers, I. A. J. Thomas, A. Ro- dero, M. C. Quintero, A. Sola, A. Gamero and J. A. M. van der Mullen, “The Behavior of Molecules in Micro- wave-Induced Plasmas Studied by Optical Emission Spe- ctroscopy. 1. Plasmas at Atmospheric Pressure,” Spectro- chimica Acta Part B: Atomic Spectroscopy, Vol. 53, No. 11, 1998, pp. 1553-1566. doi:10.1016/S0584-8547(98)00186-4 [6] M. Moisan, Z. Zakrzewski, R. Pantel and P. Leprince, “A Waveguide-Based Launcher to Sustain Long Plasma Co- lumns through the Propagation of an Electromagnetic Surface-Wave,” IEEE Transactions on Plasma Science, Vol. 12, No. 3, 1984, pp. 203-214. doi:10.1109/TPS.1984.4316320 [7] M. Moisan, G. Sauve, Z. Zakrzewski and J. Hubert, “An Atmospheric Pressure Waveguidefed Microwave Plasma Torch: The Tia Design,” Plasma Sources Science & Te- chnology, Vol. 3, No. 4, 1994, pp. 584-592. doi:10.1088/0963-0252/3/4/016 [8] A. Ricard, L. Stonge, H. Malvos, A. Gicquel, J. Hubert and M. Moisan, “Torche à Plasma Micro-Onde: Deux Configurations Complémentaires,” Journal de Physique III, Vol. 5, No. 8, 1995, pp. 1269-1285. doi:10.1051/jp3:1995185 [9] J. Torres, M. J. van de Sande, J. J. A. M. van der Mullen, A. Gamero and A. Sola, “Stark Broadening for Simulta- neous Diagnostics of the Electron Density and Tempera- ture in Atmospheric Microwave Discharges,” Spectrochi- mica Acta Part B: Atomic Spectroscopy, Vol. 61, No. 1, 2006, pp. 58-68. doi:10.1016/j.sab.2005.11.002 [10] J. Jonkers, J. M. deRegt, J. A. M. vanderMullen, H. P. C. Vos, F. P. J. deGroote and E. A. H. Timmermans, “On the Electron Temperatures and Densities in Plasmas Produced by the ‘Torche a Injection Axiale’,” Spectrochimica Acta Part B: Atomic Spectroscopy, Vol. 51, No. 11, 1996, pp. 1385-1392. doi:10.1016/0584-8547(96)01493-0 [11] M. Jimenez-Diaz, J. van Dijk and J. J. A. M. van der Mullen, “Effect of Remote Field Electromagnetic Bound- ary Conditions on Microwave-Induced Plasma Torches,” Journal of Physics D: Applied Physics, Vol. 44, No. 16, 2011, Article ID: 165203. doi:10.1088/0022-3727/44/16/165203 [12] L. L. Alves, R. Alvarez, L. Marques, S. J. Rubio, A. Ro- dero and M. C. Quintero, “Modeling of an Axial Injec- tion Torch,” European Physical Journal: Applied Physics, Vol. 46, No. 2, 2009, p. 21001. doi:10.1051/epjap/2009049 [13] E. A. H. Timmermans, F. P. J. de Groote, J. Jonkers, A. Gamero, A. Sola and J. J. A. M. van der Mullen, “Atomic Emission Spectroscopy for the On-Line Monitoring of In- cineration Processes,” Spectrochimica Acta Part B: Ato- mic Spectroscopy, Vol. 58, No. 5, 2003, pp. 823-836. doi:10.1016/S0584-8547(03)00017-X [14] S. S. Asad, C. Tendero, C. Dublanche-Tixier, P. Tristant, C. Boisse-Laporte, O. Leroy and P. Leprince, “Effect of Atmospheric Microwave Plasma Treatment on Organic Lubricant on a Metallic Surface,” Surface & Coatings Technology, Vol. 203, No. 13, 2009, pp. 1790-1796. doi:10.1016/j.surfcoat.2008.12.026 [15] S. J. Rubio, A. Rodero and M. C. Quintero, “Application of a Microwave Helium Plasma Torch Operating at At- mospheric Pressure to Destroy Trichloroethylene,” Plas- ma Chemistry and Plasma Processing, Vol. 28, No. 4, 2008, pp. 415-428. doi:10.1007/s11090-008-9133-3 [16] L. L. Alves and C. M. Ferreira, “Electron Kinetics in Weakly Ionized Helium under DC and HF Applied Elec- tric-fields,” Journal of Physics D: Applied Physics, Vol. 24, No. 4, 1991, pp. 581-592. doi:10.1088/0022-3727/24/4/009 [17] http://www.comsol.com [18] C. O. Laux, T. G. Spence, C. H. Kruger and R. N. Zare, “Optical Diagnostics of Atmospheric Pressure Air Plas- mas,” Plasma Sources Science & Technology, Vol. 12, 2003, pp. 125-138. [19] M. A. Gigosos and V. Cardenoso, “New Plasma Diagno- sis Tables of Hydrogen Stark Broadening Including Ion Dynamics,” Journal of Physics B: Atomic Molecular and Optical Physics, Vol. 29, No. 20, 1996, pp. 4795-4838. doi:10.1088/0953-4075/29/20/029 [20] M. A. Gigosos, M. A. Gonzalez and V. Cardenoso, “Com- puter Simulated Balmer-Alpha, -Beta and -Gamma Stark Line Profiles for Non-Equilibrium Plasmas Diagnostics,” Spectrochimica Acta Part B: Atomic Spectroscopy, Vol. 58, No. 8, 2003, pp. 1489-1504. doi:10.1016/S0584-8547(03)00097-1 [21] J. Torres, O. Carabano, M. Fernandez, S. Rubio, R. Alva- rez, A. Rodero, C. Lao, M. C. Quintero, A. Gamero and A. Sola, “The Stark-Crossing Method for the Simultane- ous Determination of the Electron Temperature and Den- sity in Plasmas,” Journal of Physics Conference Series, Vol. 44, No. 1, 2006, p. 70. doi:10.1088/1742-6596/44/1/008 [22] M. A. Heald and C. B. Wharton, “Plasma Dignotics with Microwave,” Wiley, New York, 1965. [23] K. Gadonna, O. Leroy, T. Silva, P. Leprince, C. Boisse- Laporte and L. L. Alves, “Hydrodynamic Study of a Mi- crowave Plasma Torch,” European Physics Journal of Applied Physics, Vol. 56, No. 2, 2011, p. 24008. doi:10.1051/epjap/2011110161 [24] R. P. Cardoso, T. Belmonte, P. Keravec, F. Kosior and G. Henrion, “Influence of Impurities on the Temperature of an Atmospheric Helium Plasma in Microwave Resonant Cavity,” Journal of Physics D: Applied Physics, Vol. 40, No. 5, 2007, pp. 1394-1400. doi:10.1088/0022-3727/40/5/012 [25] O. Schenk and K. Gärtner, “Solving Unsymmetric Sparse Systems of Linear Equations with PARDISO,” Journal of Future Generation Computer Systems, Vol. 20, No. 3, 2004, pp. 475-487. [26] J. P. Berenger, “Three-Dimensional Perfectly Matched Layer for the Absorption of Electromagnetic Waves,” Journal of Computational Physics, Vol. 127, No. 2, 1996, pp. 363-379. doi:10.1006/jcph.1996.0181 [27] T. Belmonte, R. P. Cardoso, G. Henrion and F. Kosior, “Collisional-Radiative Modelling of a Helium Microwave Plasma in a Resonant Cavity,” Journal of Physics D: Ap- plied Physics, Vol. 40, No. 23, 2007, pp. 7343-7356. doi:10.1088/0022-3727/40/23/015  K. GADONNA ET AL. 1612 Appendix We present here an overview of the plasma description, the domain of calculation used in the models, and equa- tions and boundary conditions used in 3D electromag- netic and 2D hydrodynamic models developed under the COMSOL Multiphysics platform [17]. A.1. Plasma Description For both electromagnetic and hydrodynamic models, the plasma is defined by imposing its dimensions (length and radius) and the axial and radial profiles of ne (r, z) = neMAX ner(r)nez(z) and Te(r, z) = TeMAXTer(r)Tez(z), shown in Figure 11. The axial profile of ne has been chosen in accordance with measurements of optical emission spectroscopy (Section 4.2). As it has been experimentally observed, the beginning of the plasma is located 1 mm above the nozzle. Te profiles are defined according to (a) (b) Figure 11. Axial (a) and radial (b) profiles of the electron density ne (black curves) and the electron temperature Te (red curves). Rp and Lp are respectively the radius and the length of the plasma. [9,21]. The studied gas is helium at atmospheric pres- sure. Note that Rp, Lp, neMAX and TeMAX are input parameters of the model. For all the simulations, we chose to fix Rp equal to the nozzle radius and to take Lp in accordance with the experiment. Typically Lp = 30 mm for the 2 mm nozzle and Lp = 10 mm for the 0.5 mm nozzle. A.2. Domain of Calculation Figure 12 shows the computational domain on which the EM and HD modules are solved. All the dimensions introduced in the model are the same than the ones used in our experiments. For the EM module, we chose to build a 3D model of the system to evaluate the coupling between the rec- tangular waveguide, the coaxial transition and the plasma. The tetrahedral meshing uses around 8 104 elements for the whole computational domain with a refinement at the nozzle exit, and in the plasma (typically 3 103 elements). For the HD module, the plasma gas is injected with a given velocity. We assumed (see Table 1) that the flow remains laminar, which reduces the computation time by adopting the axisymmetric 2D geometry in HD module. The triangular meshing uses around 4 104 elements and is refined in the plasma. The solver used is PARDISO [25]. This direct solver is widely used because of its ease in use and its robust- ness: it does not need preconditioner. The convergence criterion imposes relative errors between consecutive calculations, typically less than 10−6. A.3. Electromagnetic Module The distribution of electromagnetic field in the presence of the plasma is calculated by solving the Maxwell- Ampere and Faraday-Maxwell equations: t HE (i) t E (ii) E is the electric field [V/m], H is the magnetic field [A/m], ε is the permittivity [F/m], μ is the permeability [H/m] and σ is the conductivity of the medium [S/m]. By writing E(x, y, z, t) = E(x, y, z) exp(jωt) and H(x, y, z, t) = H(x, y, z) exp(jωt), the two laws can be combined to obtain the electric field wave equation: 2 0 0 10 r r j k EE (iii) with μ = μ0μr and ε = ε0εr, where μ0 is the vacuum permeability and ε0 the vacum permittivity. The relative u Copyright © 2012 SciRes. JMP  K. GADONNA ET AL.1613 (a) (b) Figure 12. Transverse section of the 3D (a) and 2D (b) computational domains adopted to solve the EM and HD modules, showing the waveguides (in brown), the torch (in yellow), the quartz tube (in green), Teflon (in blue) and the plasma (in red). All dimensions are in millimeters and the diagram is not to scale. The plasma is located 1 mm above the nozzle. permittivity εr, the relative permeability μr and the conductivity σ define the different environments. k0 is the wave number in vacuum. In these equations, the plasma is considered as a va- cuum environment, having a conductivity due to free charges (electrons), i.e.: 1 rp (iv) 2 e e ne mj p 0 nE (v) The values of permittivity, permeability and conduc- tivity of the different media used in the model are given in Table 2. The boundary conditions for the waveguide and the torch (made of brass) are those of a perfect electrical conductor (), except for the section of the guide (P.E. on Figure 12) where the microwave exci- tation is applied. At this point, a condition of port for a TE10 rectangular mode is imposed. Moreover, this confi- guration, shown in Figure 12, is surrounded by a region of PML type (Perfectly Matched Layers) [26], where boundary conditions of diffusion (non-reflective) are assumed. This consists in adding an artificial field which Table 2. Permittivity, permeability and conductivity of air, brass, teflon, quartz and plasma. εr μr σ Air 1 1 0 1.57 × 10⁷ Brass 1 1 10−22 Teflon 2.8 1 10−18 Quartz 3.8 1 σp Plasma 1 1 absorbes the waves. A.4. Hydrodynamic Module This section focuses on the transport of heavy species, neutral or ionized, whose masses are comparable. The distributions of velocities and temperatures in the pre- sence of the plasma are calculated by solving the well- known Navier-Stokes equations: 00 v (vi) 00 p vv τ (vii) Copyright © 2012 SciRes. JMP  K. GADONNA ET AL. 1614 where ρ is the gas density, v0 is the gas velocity, p is the gas pressure, is the viscosity tensor given by: τ 00 τvv 0 2 3 vI I (viii) where is the identity tensor. The viscosity tensor accounts for the dynamic visco- sity coefficient of the fluid η, which can be obtained by the Chapman-Enskog theory using Lennard-Jones para- meters [3]. The combination of the continuity Equation (vi) and the momentum Equation (vii) provides a description of the barycentric velocity, in terms of pressure gradient and viscosity. The gas flow is then completed by heat transfer using the equation of energy conservation given by: 0 03 vg e ge CT m Tp v vBeg g nkTT M (ix) where kB is the Boltzmann constant, Cv is the specific heat of gas at constant volume, λg is the thermal conduc- tivity and ν is the electron-neutral collision frequency. me, ne and Te are respectively the electron mass, density and temperature. λg depends on η [3] as following: 15 4 g k (x) where Mg is the mass of the gas neutrals (here helium). Each term in Equation (ix) describes the different means of energy exchange, i.e. from left to right of equa- tion: convective processes (density difference, temperature difference); heat conduction processes (collisions between par- ticles of the same type); work of pressure forces; collisions between different particles (here heating of helium gas by the electrons). The energy Equation (ix) describes and predicts the temperature of the flowing gas. It is coupled to the Navier-Stokes Equations (vi) and(vii), which describe the velocity fields. This coupling occurs through the con- vective term and the work of pressure forces that involve velocities. The Navier-Stokes equations are also coupled to the energy equation because the gas properties (den- sity, viscosity) depend on temperature. All these equations have been established without taking into account the helium ions whose mass is of the same order than neutrals. As the ionisation degree is not negligible in MPTs, we add the influence of ions on the transport of heavy particles and the heat transfer to gas. Equations (vi), (vii) and (ix) are then rewritten as fol- lowing: 00 v (xi) 00 idc pen vv τ (xii) 00 i 3 vggg e eBegdc g CT Tp mnk TTe M vv Γ en (xiii) The ions influence occurs in the momentum equation (Equation (xii)) with the ionic force term idc and in the energy equation (Equation (xiii)) with the Joule heat- ing term idc e Γ. dc , ni and i are respectively the space charge field, the ion density and the ion flow. They are calcu- lated for ambipolar conditions: Γ ee dc e kT n en E ie nn ie an D (xiii) (xiv) Γ (xv) with aBei DkTeu (xvi) the ambipolar diffusion coefficient and μiN the reduced ion mobility. In high temperature gas, both He+ and 2 He are present ([2 He /He+] ~ 0.55 [27]). For simplification and as a first approach we consider a single type of ion, He2+ (μiN = 4.49 × 10²⁰ V−1·cm−1·s−1 [16]). Equations (xi)-(xiii) are solved in order to study the heat transfer from the plasma to the gas taking into ac- Figure 13. Temperature profile imposed at r = 25 mm. For 0 mm ≤ z ≤ 525 mm: Tg(z) = 0.8 + 1.9z [m] – 4.3z [m]2. For z ≥ 525 mm, Tg = 290 K. Copyright © 2012 SciRes. JMP  K. GADONNA ET AL. Copyright © 2012 SciRes. JMP 1615 n At the exit (at the exit of the quartz tube z = (570 − 45) = 525 mm): p = 1 atm and Tg = 290K; count the influence of ions. We compared these results with the ones obtained without the ions terms. The boundary conditions used to solve the HD-module are the following: Temperature of the quartz tube, taken as boundary value for Tg at r = 25 mm, has been experimentally measured using a thermocouple (Section 4.2) all along the tube length (570 − 45) = 525 mm. It has been found that this profile is quite the same for all experimental conditions. A unique profile has been then used as boundary condition for Tg at r = 25 mm. This profile is shown in Figure 13. The TgMax value is varying with experimental conditions. But, as it has been found that it has not a great influence on model results, it has been fixed to 600 K. on the axis (r = 0): axisymmetric conditions; kT (convective flux) on the metallic parts of the torch; v = 0 (“no-slip” condition) on all the walls; At the entrance (z = −45 mm, bottom left of Figure 12.b)), Tg is considered equals to room temperature (290K) and the gas velocity is given by: 2 0 z p r R 45 21 zi vr v (xvii)
|