 Advances in Bioscience and Biotechnology, 2012, 3, 770-781 ABB http://dx.doi.org/10.4236/abb.2012.326097 Published Online October 2012 (http://www.SciRP.org/journal/abb/) Characterization of macrophage mutants established by their resistance to LPS and cycloheximide-induced apopotic cell death Fumio Amano1,2*, Shoko Tsukabe1, Reiko Teshima1, Keiko Waku1, Kiyoko Kohama1 1Laboratory of Biodefense & Regulation, Osaka University of Pharmaceutical Sciences, Osaka, Japan 2Department of Biochemistry and Cell Biology, National Institute of Infectious Diseases, Tokyo, Japan Email: *amano@gly.oups.ac.jp Received 24 August 2012; revised 29 September 2012; accepted 5 October 2012 ABSTRACT Macrophages are activated by bacterial lipopolysac- charide (LPS) to produce inflammatory cytokines such as TNF-α or reactive oxygen species such as ni- tric oxide or superoxide anion. However, in the pres- ence of an inhibitor of protein synthesis, cyclo- heximide (CHX), at 10 μg/mL, LPS at 100 μg/mL in- duced macrophage apoptosis rapidly without pro- ducing phenotypes of activated macrophages. In or- der to understand the mechanism underlying LPS- induced cytotoxicity toward macrophages, we isolated mutant cells from a macrophage-like cell line, J774.1, as clones resistant against the cytotoxic effects of LPS + CHX by using a somatic cell genetics protocol. All of the mutant clones, designated as LCR mutants, showed resistance to the cell death induced by LPS + CHX as well as to that induced by higher doses of LPS alone, as did the LPS1916 mutant cell line, which had been previously established by its resistance to 100 μg/mL LPS. Characterization of the activated macrophage phenotypes revealed that these mutants showed reduced production of TNF-α and nitric oxide in response to LPS. Further analysis showed a much reduced amount of [125I]LPS-binding and lower CD14 expression on the cell surface, in spite of an adequate intracellular expression of CD14 molecules. Besides, the molecular weight of CD14 on these mutants was around 40 - 48 kDa, smaller than that of the wild-type JA-4 cells (around 50 - 55 kDa), suggesting impaired CD14 maturation in these mutants. However, expres- sion of Toll-like receptor 4 (TLR4) and Myd 88 on the cell surface was not different between the wild type and the mutant cells. These results suggest that LCR mutants have common phenotypes of mal-expression of CD14 molecules on the macrophage cell surface, leading to not only reduced responses to LPS-medi- ated macrophage activation but acquisition of resis- tance to LPS-induced apoptotic cell death in the pre- sence of CHX. Keywords: Macrophage; J774.1 Cell Line; LPS; Apoptosis; CD14 1. INTRODUCTION Macrophages are known to be activated by bacterial lipopolysaccharides (LPS; [1,2]), and the activated macrophages produce reactive oxygen species (ROS) such as superoxide anion (2), hydrogen peroxide (H2O2), and nitric oxide (NO), or prostaglandins and inflammatory cytokines such as TNF-α, IL-1β, and so on [3,4]. It is also known that high concentrations of LPS lead to macrophage dysfunction and death [5,6] probably through certain products from such activated macro- phages [6,7]. In macrophages, expression of LPS binding due to lymphokines or gamma interferon (IFN-γ) seems to be closely correlated with the LPS-induced cytotoxic effects of macrophages toward tumor cells [8]. However, little is known about the precise mechanisms underlying these cytotoxic effects of LPS on macrophages. To elu- cidate the mechanisms of the LPS action on macro- phages and to investigate the correlation between LPS- induced activation of macrophages and LPS-induced cytotoxicity toward macrophages, we isolated LPS-re- sistant mutants from the J774.1 macrophage-like cell line with altered activated macrophage phenotypes [9,10]. As shown at the right side of Figure 1, one of the typical mutants, the LPS1916 cell line [9], shows very high re- sistance to LPS with a much reduced ability to produce ROS in response to LPS [9,11]. Later, as shown at the left side of Figure 1, we found a novel cytotoxic effect of LPS toward macrophages in the presence of a protein synthesis inhibitor, cycloheximide (CHX), which was proved to be induced without activated macrophage O *Corresponding author. OPEN ACCESS 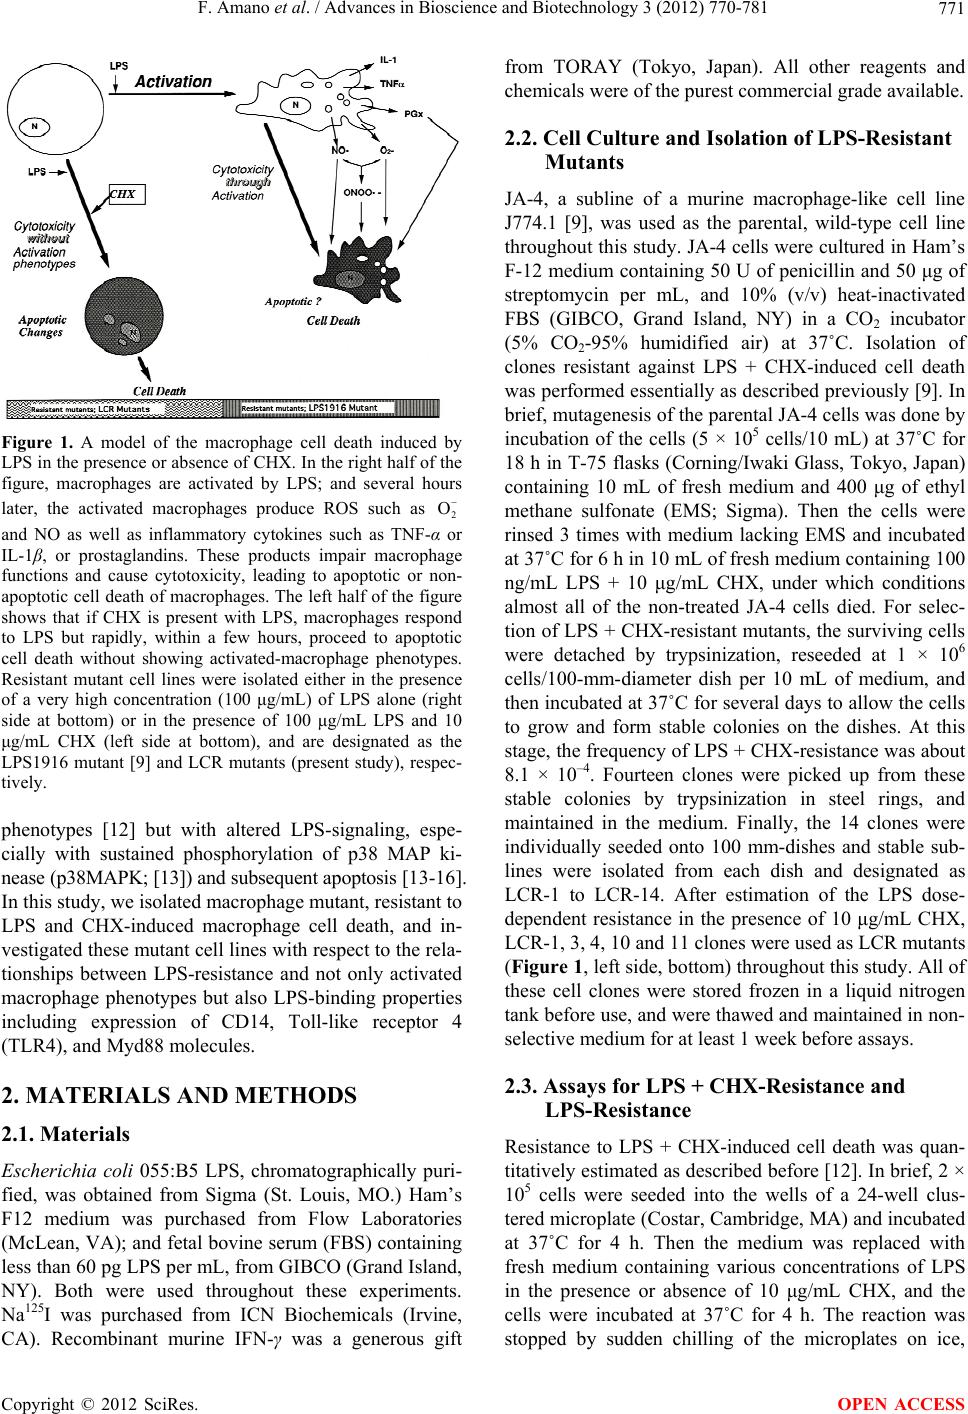 F. Amano et al. / Advances in Bioscience and Biotechnology 3 (2012) 770-781 771 Figure 1. A model of the macrophage cell death induced by LPS in the presence or absence of CHX. In the right half of the figure, macrophages are activated by LPS; and several hours later, the activated macrophages produce ROS such as 2 O and NO as well as inflammatory cytokines such as TNF-α or IL-1β, or prostaglandins. These products impair macrophage functions and cause cytotoxicity, leading to apoptotic or non- apoptotic cell death of macrophages. The left half of the figure shows that if CHX is present with LPS, macrophages respond to LPS but rapidly, within a few hours, proceed to apoptotic cell death without showing activated-macrophage phenotypes. Resistant mutant cell lines were isolated either in the presence of a very high concentration (100 μg/mL) of LPS alone (right side at bottom) or in the presence of 100 μg/mL LPS and 10 μg/mL CHX (left side at bottom), and are designated as the LPS1916 mutant [9] and LCR mutants (present study), respec- tively. phenotypes [12] but with altered LPS-signaling, espe- cially with sustained phosphorylation of p38 MAP ki- nease (p38MAPK; [13]) and subsequent apoptosis [13-16]. In this study, we isolated macrophage mutant, resistant to LPS and CHX-induced macrophage cell death, and in- vestigated these mutant cell lines with respect to the rela- tionships between LPS-resistance and not only activated macrophage phenotypes but also LPS-binding properties including expression of CD14, Toll-like receptor 4 (TLR4), and Myd88 molecules. 2. MATERIALS AND METHODS 2.1. Materials Escherichia coli 055:B5 LPS, chromatographically puri- fied, was obtained from Sigma (St. Louis, MO.) Ham’s F12 medium was purchased from Flow Laboratories (McLean, VA); and fetal bovine serum (FBS) containing less than 60 pg LPS per mL, from GIBCO (Grand Island, NY). Both were used throughout these experiments. Na125I was purchased from ICN Biochemicals (Irvine, CA). Recombinant murine IFN-γ was a generous gift from TORAY (Tokyo, Japan). All other reagents and chemicals were of the purest commercial grade available. 2.2. Cell Culture and Isolation of LPS-Resistant Mutants JA-4, a subline of a murine macrophage-like cell line J774.1 [9], was used as the parental, wild-type cell line throughout this study. JA-4 cells were cultured in Ham’s F-12 medium containing 50 U of penicillin and 50 μg of streptomycin per mL, and 10% (v/v) heat-inactivated FBS (GIBCO, Grand Island, NY) in a CO2 incubator (5% CO2-95% humidified air) at 37˚C. Isolation of clones resistant against LPS + CHX-induced cell death was performed essentially as described previously [9]. In brief, mutagenesis of the parental JA-4 cells was done by incubation of the cells (5 × 10⁵ cells/10 mL) at 37˚C for 18 h in T-75 flasks (Corning/Iwaki Glass, Tokyo, Japan) containing 10 mL of fresh medium and 400 μg of ethyl methane sulfonate (EMS; Sigma). Then the cells were rinsed 3 times with medium lacking EMS and incubated at 37˚C for 6 h in 10 mL of fresh medium containing 100 ng/mL LPS + 10 μg/mL CHX, under which conditions almost all of the non-treated JA-4 cells died. For selec- tion of LPS + CHX-resistant mutants, the surviving cells were detached by trypsinization, reseeded at 1 × 10⁶ cells/100-mm-diameter dish per 10 mL of medium, and then incubated at 37˚C for several days to allow the cells to grow and form stable colonies on the dishes. At this stage, the frequency of LPS + CHX-resistance was about 8.1 × 10⁻⁴. Fourteen clones were picked up from these stable colonies by trypsinization in steel rings, and maintained in the medium. Finally, the 14 clones were individually seeded onto 100 mm-dishes and stable sub- lines were isolated from each dish and designated as LCR-1 to LCR-14. After estimation of the LPS dose- dependent resistance in the presence of 10 μg/mL CHX, LCR-1, 3, 4, 10 and 11 clones were used as LCR mutants (Figure 1, left side, bottom) throughout this study. All of these cell clones were stored frozen in a liquid nitrogen tank before use, and were thawed and maintained in non- selective medium for at least 1 week before assays. 2.3. Assays for LPS + CHX-Resistance and LPS-Resistance Resistance to LPS + CHX-induced cell death was quan- titatively estimated as described before [12]. In brief, 2 × 10⁵ cells were seeded into the wells of a 24-well clus- tered microplate (Costar, Cambridge, MA) and incubated at 37˚C for 4 h. Then the medium was replaced with fresh medium containing various concentrations of LPS in the presence or absence of 10 μg/mL CHX, and the cells were incubated at 37˚C for 4 h. The reaction was stopped by sudden chilling of the microplates on ice, Copyright © 2012 SciRes. OPEN ACCESS 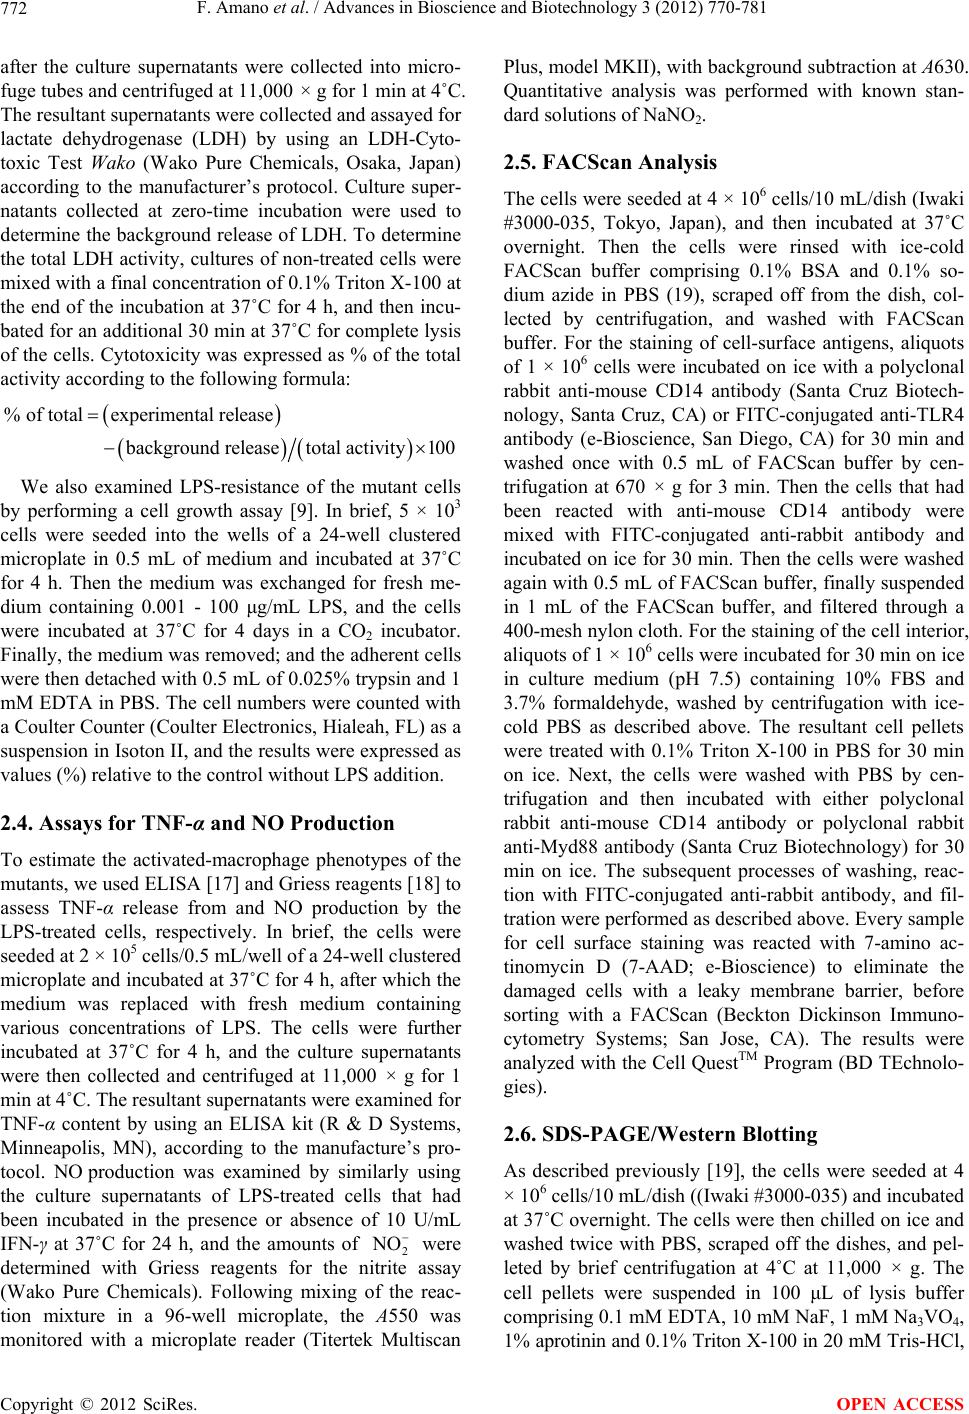 F. Amano et al. / Advances in Bioscience and Biotechnology 3 (2012) 770-781 772 after the culture supernatants were collected into micro- fuge tubes and centrifuged at 11,000 × g for 1 min at 4˚C. The resultant supernatants were collected and assayed for lactate dehydrogenase (LDH) by using an LDH-Cyto- toxic Test Wako (Wako Pure Chemicals, Osaka, Japan) according to the manufacturer’s protocol. Culture super- natants collected at zero-time incubation were used to determine the background release of LDH. To determine the total LDH activity, cultures of non-treated cells were mixed with a final concentration of 0.1% Triton X-100 at the end of the incubation at 37˚C for 4 h, and then incu- bated for an additional 30 min at 37˚C for complete lysis of the cells. Cytotoxicity was expressed as % of the total activity according to the following formula: % of totalexperimental release ackground releasetotal activity100 We also examined LPS-resistance of the mutant cells by performing a cell growth assay [9]. In brief, 5 × 10³ cells were seeded into the wells of a 24-well clustered microplate in 0.5 mL of medium and incubated at 37˚C for 4 h. Then the medium was exchanged for fresh me- dium containing 0.001 - 100 μg/mL LPS, and the cells were incubated at 37˚C for 4 days in a CO2 incubator. Finally, the medium was removed; and the adherent cells were then detached with 0.5 mL of 0.025% trypsin and 1 mM EDTA in PBS. The cell numbers were counted with a Coulter Counter (Coulter Electronics, Hialeah, FL) as a suspension in Isoton II, and the results were expressed as values (%) relative to the control without LPS addition. 2.4. Assays for TNF-α and NO Production To estimate the activated-macrophage phenotypes of the mutants, we used ELISA [17] and Griess reagents [18] to assess TNF-α release from and NO production by the LPS-treated cells, respectively. In brief, the cells were seeded at 2 × 10⁵ cells/0.5 mL/well of a 24-well clustered microplate and incubated at 37˚C for 4 h, after which the medium was replaced with fresh medium containing various concentrations of LPS. The cells were further incubated at 37˚C for 4 h, and the culture supernatants were then collected and centrifuged at 11,000 × g for 1 min at 4˚C. The resultant supernatants were examined for TNF-α content by using an ELISA kit (R & D Systems, Minneapolis, MN), according to the manufacture’s pro- tocol. NO production was examined by similarly using the culture supernatants of LPS-treated cells that had been incubated in the presence or absence of 10 U/mL IFN-γ at 37˚C for 24 h, and the amounts of 2 NO were determined with Griess reagents for the nitrite assay (Wako Pure Chemicals). Following mixing of the reac- tion mixture in a 96-well microplate, the A550 was monitored with a microplate reader (Titertek Multiscan Plus, model MKII), with background subtraction at A630. Quantitative analysis was performed with known stan- dard solutions of NaNO2. 2.5. FACScan Analysis The cells were seeded at 4 × 10⁶ cells/10 mL/dish (Iwaki #3000-035, Tokyo, Japan), and then incubated at 37˚C overnight. Then the cells were rinsed with ice-cold FACScan buffer comprising 0.1% BSA and 0.1% so- dium azide in PBS (19), scraped off from the dish, col- lected by centrifugation, and washed with FACScan buffer. For the staining of cell-surface antigens, aliquots of 1 × 10⁶ cells were incubated on ice with a polyclonal rabbit anti-mouse CD14 antibody (Santa Cruz Biotech- nology, Santa Cruz, CA) or FITC-conjugated anti-TLR4 antibody (e-Bioscience, San Diego, CA) for 30 min and washed once with 0.5 mL of FACScan buffer by cen- trifugation at 670 × g for 3 min. Then the cells that had been reacted with anti-mouse CD14 antibody were mixed with FITC-conjugated anti-rabbit antibody and incubated on ice for 30 min. Then the cells were washed again with 0.5 mL of FACScan buffer, finally suspended in 1 mL of the FACScan buffer, and filtered through a 400-mesh nylon cloth. For the staining of the cell interior, aliquots of 1 × 10⁶ cells were incubated for 30 min on ice in culture medium (pH 7.5) containing 10% FBS and 3.7% formaldehyde, washed by centrifugation with ice- cold PBS as described above. The resultant cell pellets were treated with 0.1% Triton X-100 in PBS for 30 min on ice. Next, the cells were washed with PBS by cen- trifugation and then incubated with either polyclonal rabbit anti-mouse CD14 antibody or polyclonal rabbit anti-Myd88 antibody (Santa Cruz Biotechnology) for 30 min on ice. The subsequent processes of washing, reac- tion with FITC-conjugated anti-rabbit antibody, and fil- tration were performed as described above. Every sample for cell surface staining was reacted with 7-amino ac- tinomycin D (7-AAD; e-Bioscience) to eliminate the damaged cells with a leaky membrane barrier, before sorting with a FACScan (Beckton Dickinson Immuno- cytometry Systems; San Jose, CA). The results were analyzed with the Cell QuestTM Program (BD TEchnolo- gies). 2.6. SDS-PAGE/Western Blotting As described previously [19], the cells were seeded at 4 × 10⁶ cells/10 mL/dish ((Iwaki #3000-035) and incubated at 37˚C overnight. The cells were then chilled on ice and washed twice with PBS, scraped off the dishes, and pel- leted by brief centrifugation at 4˚C at 11,000 × g. The cell pellets were suspended in 100 μL of lysis buffer comprising 0.1 mM EDTA, 10 mM NaF, 1 mM Na3VO4, 1% aprotinin and 0.1% Triton X-100 in 20 mM Tris-HCl, Copyright © 2012 SciRes. OPEN ACCESS  F. Amano et al. / Advances in Bioscience and Biotechnology 3 (2012) 770-781 773 pH 7.5. After having been stood on ice for 30 min, the cells were centrifuged at 11,000 × g for 1 min at 4˚C, and the resultant supernatant was used as the cell extract. For SDS-PAGE/Western blotting, 50 μg aliquots of the cell extracts were treated with the SDS-sample buffer and then boiled at 95˚C for 5 min. Samples were loaded onto a 5% - 20% gradient Slab gel (ATTO, Tokyo, Japan), electrophoresed in a discontinuous buffer system of Laemli [20], and then electro-transferred to an Immo- bilon PVDF membrane (Millipore, Billerica, MA) at 30 V overnight and then at 100 V for 30 min. After blocking of the filter with 30 mg/mL milk casein (Snow Brand, Sapporo) in a rinse buffer comprising 0.1% Triton X-100, 0.1 mM EDTA, and 0.8% NaCl in 10 mMTris-HCl buffer, pH7.5, the proteins on the filter were reacted with polyclonal rabbit antibody against mouse CD14 (Santa Cruz) at 37˚C for 2 h, and then the membrane filter was rinsed 3 times with the rinse buffer. Next, the membrane was reacted with an HRP-conjugated anti-rabbit IgG (Cell Signaling Technology, Danvers, MA) at room tem- perature for 1 h. The immune complexes on the mem- brane were detected by the addition of luminol (Cell Sig- naling Technology) and H2O2, according to the manu- facturer’s protocol. The intensity of the reaction products was determined by use of an LAS2000 image analyzer (Fuji Film, Tokyo, Japan), and the results were analyzed with Multi Gauge v2.2 (Fuji Film, Tokyo, Japan). 2.7. Preparation of [125I]-LPS and Binding of [125I]-LPS to Cell Monolayers [125I]-LPS (E. coli O55:B5) was prepared as described previously [10] by using a variation of the procedure of Ulevitch [21]. The specific activity of the labeled LPS varied from preparation to preparation, ranging from 0.1 to 1.2 μCi/μg LPS; and the approximate mean value was 0.3 μCi/μg LPS. The LPS binding assay was performed according to the method described before [10] with slight modifications. In brief, cells were seeded at 2 × l05 cells/well of a 24-well microplate containing 0.5 ml of the culture medium. After preculturing overnight, the medium was changed to that containing 10%FBS, and then the cells were cooled on ice at 4˚C for 15 min. Next, the cells were incubated with 100 ng/mL [125I]-LPS in the presence or absence of 5 μg/mL of non-labeled LPS at 4˚C for 6 h. The binding incubations were terminated by rapid and repeated washing 3 times of each well with 0.5 mL of the buffers, composed of 0.02% (w/v) BSA in PBS. Finally, the cells were lysed with 0.5 mL of 0.1 N NaOH and transferred to a counting tube, and then the radioactivity was measured with an auto-well γ-counter (Aloka, Tokyo, Japan). The results were expressed as specific binding activity of LPS (ng/well/2 × l05 cells) after calculation by subtraction of non-specific activity (radioactivity bound in the presence of 5 μg/mL non- labeled LPS) from the total activity (radioactivity bound in the absence of 5 μg/mL of non-labeled LPS). 2.8. Morphologic Observation Cells were observed under a phase-contrast microscope (Diamat; Nikon, Tokyo, Japan), and photographs were taken with black and white film (Neopan F; Fuji Film, Tokyo, Japan) with a Nikon FE camera. 3. RESULTS 3.1. Resistance of Mutant Cells against the LPS and CHX-Induced Cytotoxicity We examined the resistance of the mutant cell lines against the LPS and CHX-induced cytotoxicity. LCR-1 and LCR-3 cell lines, representative LCR mutant cell lines isolated by using a somatic cell genetics protocol to select for cells resistant to LPS and CHX-induced cyto- toxicity (Figure 1, left side at bottom), showed little change after incubation with 100 ng/mL LPS + 10 μg/mL CHX (Figures 2(f) and (h)). However, the JA-4 cell line, i.e., the parental, wild-type cell line, exhibited severe cell damage including evidence of apoptosis as well as a swollen, necrotic morphology under the same conditions (Figure 2(b)). The LPS1916 cell line, isolated previously [9] by its resistance to high-dose LPS (Figure 1, right side at bottom) showed little cell damage after LPS + CHX-treatment (Figure 2(d)). However, all of these cell lines showed intact cell morphology with adherent and a round shape, if the cells were incubated without LPS + CHX-treatment (Figures 2(a), (c), (e) and (g)). Similar results were obtained with other LCR mutants, i.e., LCR- 4, 10 and 11 in the presence or absence of LPS + CHX (data not shown). These results show that the LCR mu- tant cell lines, as well as the LPS1916 cell line, were re- sistant to the cytotoxic effects of LPS + CHX on macro- phages [12]. To examine the extent of the resistance of LCR mu- tants quantitatively, we next examined the LPS dose- dependent release of LDH in the presence or absence of CHX (Figure 3). JA-4 cells released LDH dependent on the LPS dose in the presence of CHX. They released significant amounts of LDH at and more than 1 ng/mL LPS, and exhibited maximal release of around 66% at and more than 10 ng/mL (Figure 3(a)). However, none of the LCR mutants or LPS1916 cells showed LDH re- lease in the presence of CHX, even at 1000 ng/mL LPS. In the absence of CHX, JA-4, LCR, and LPS1916 cell lines showed no LDH release in response to LPS (Figure 3(b)), indicating that LCR mutant cell lines had acquired high resistance to LPS + CHX-induced macrophage cell Copyright © 2012 SciRes. OPEN ACCESS 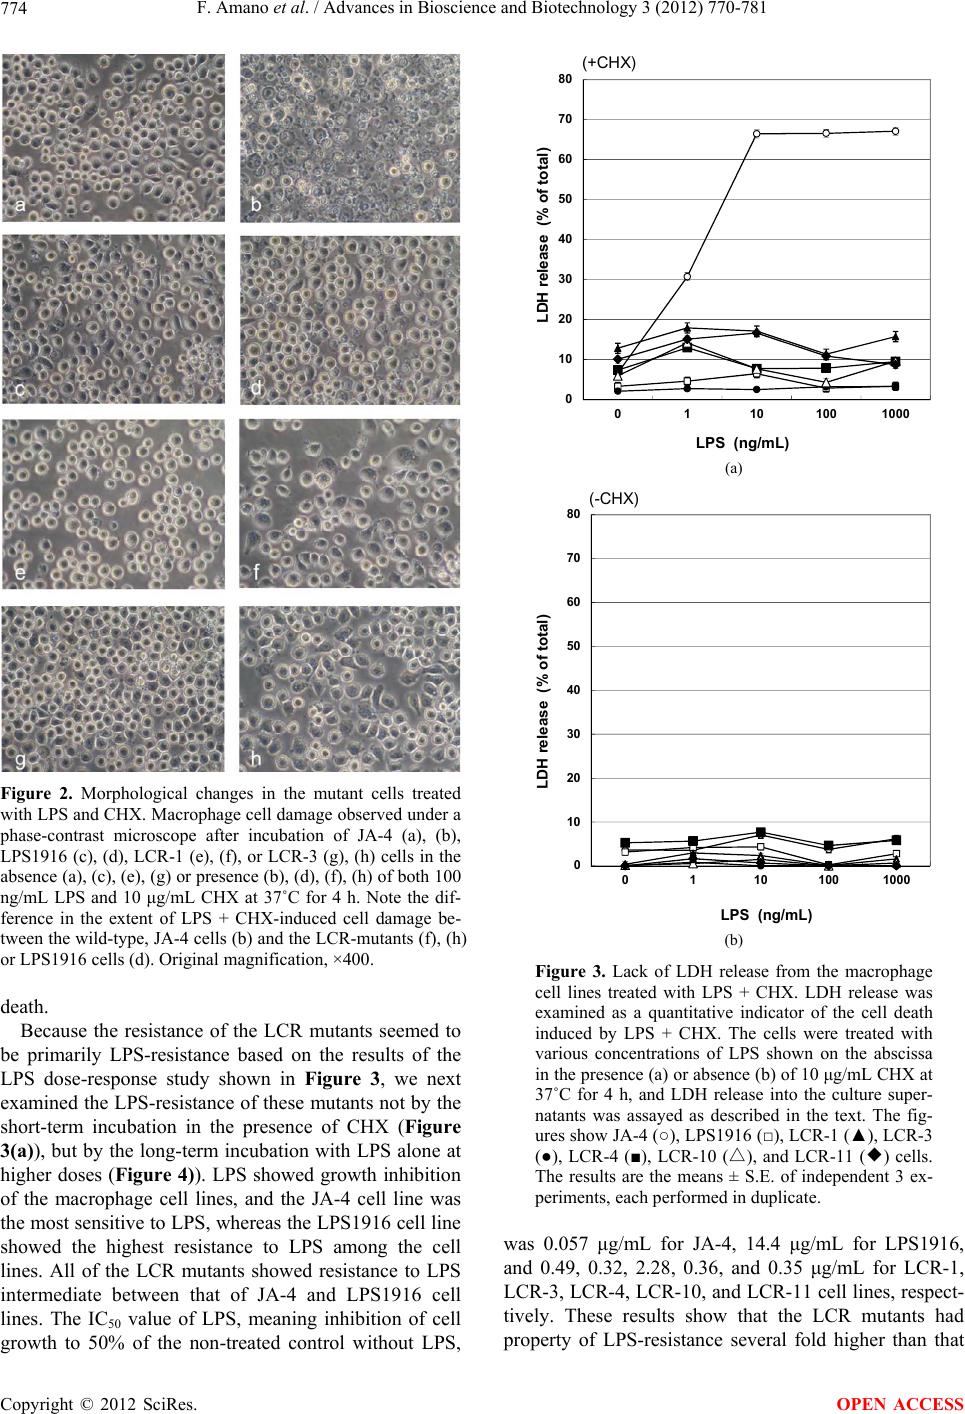 F. Amano et al. / Advances in Bioscience and Biotechnology 3 (2012) 770-781 774 Figure 2. Morphological changes in the mutant cells treated with LPS and CHX. Macrophage cell damage observed under a phase-contrast microscope after incubation of JA-4 (a), (b), LPS1916 (c), (d), LCR-1 (e), (f), or LCR-3 (g), (h) cells in the absence (a), (c), (e), (g) or presence (b), (d), (f), (h) of both 100 ng/mL LPS and 10 μg/mL CHX at 37˚C for 4 h. Note the dif- ference in the extent of LPS + CHX-induced cell damage be- tween the wild-type, JA-4 cells (b) and the LCR-mutants (f), (h) or LPS1916 cells (d). Original magnification, ×400. death. Because the resistance of the LCR mutants seemed to be primarily LPS-resistance based on the results of the LPS dose-response study shown in Figure 3, we next examined the LPS-resistance of these mutants not by the short-term incubation in the presence of CHX (Figure 3(a)), but by the long-term incubation with LPS alone at higher doses (Figure 4)). LPS showed growth inhibition of the macrophage cell lines, and the JA-4 cell line was the most sensitive to LPS, whereas the LPS1916 cell line showed the highest resistance to LPS among the cell lines. All of the LCR mutants showed resistance to LPS intermediate between that of JA-4 and LPS1916 cell lines. The IC50 value of LPS, meaning inhibition of cell growth to 50% of the non-treated control without LPS, 0 10 20 30 40 50 60 70 80 01101001000 LDH release (% of total) LPS (ng/mL) (+CHX) (a) 0 10 20 30 40 50 60 70 80 0110100 1000 LDH release (% of total) LPS n /mL (-CHX) (b) Figure 3. Lack of LDH release from the macrophage cell lines treated with LPS + CHX. LDH release was examined as a quantitative indicator of the cell death induced by LPS + CHX. The cells were treated with various concentrations of LPS shown on the abscissa in the presence (a) or absence (b) of 10 μg/mL CHX at 37˚C for 4 h, and LDH release into the culture super- natants was assayed as described in the text. The fig- ures show JA-4 (○), LPS1916 (□), LCR-1 (▲), LCR-3 (●), LCR-4 (■), LCR-△ 10 (), and LCR-◆ 11 () cells. The results are the means ± S.E. of independent 3 ex- periments, each performed in duplicate. was 0.057 μg/mL for JA-4, 14.4 μg/mL for LPS1916, and 0.49, 0.32, 2.28, 0.36, and 0.35 μg/mL for LCR-1, LCR-3, LCR-4, LCR-10, and LCR-11 cell lines, respect- tively. These results show that the LCR mutants had property of LPS-resistance several fold higher than that Copyright © 2012 SciRes. OPEN ACCESS 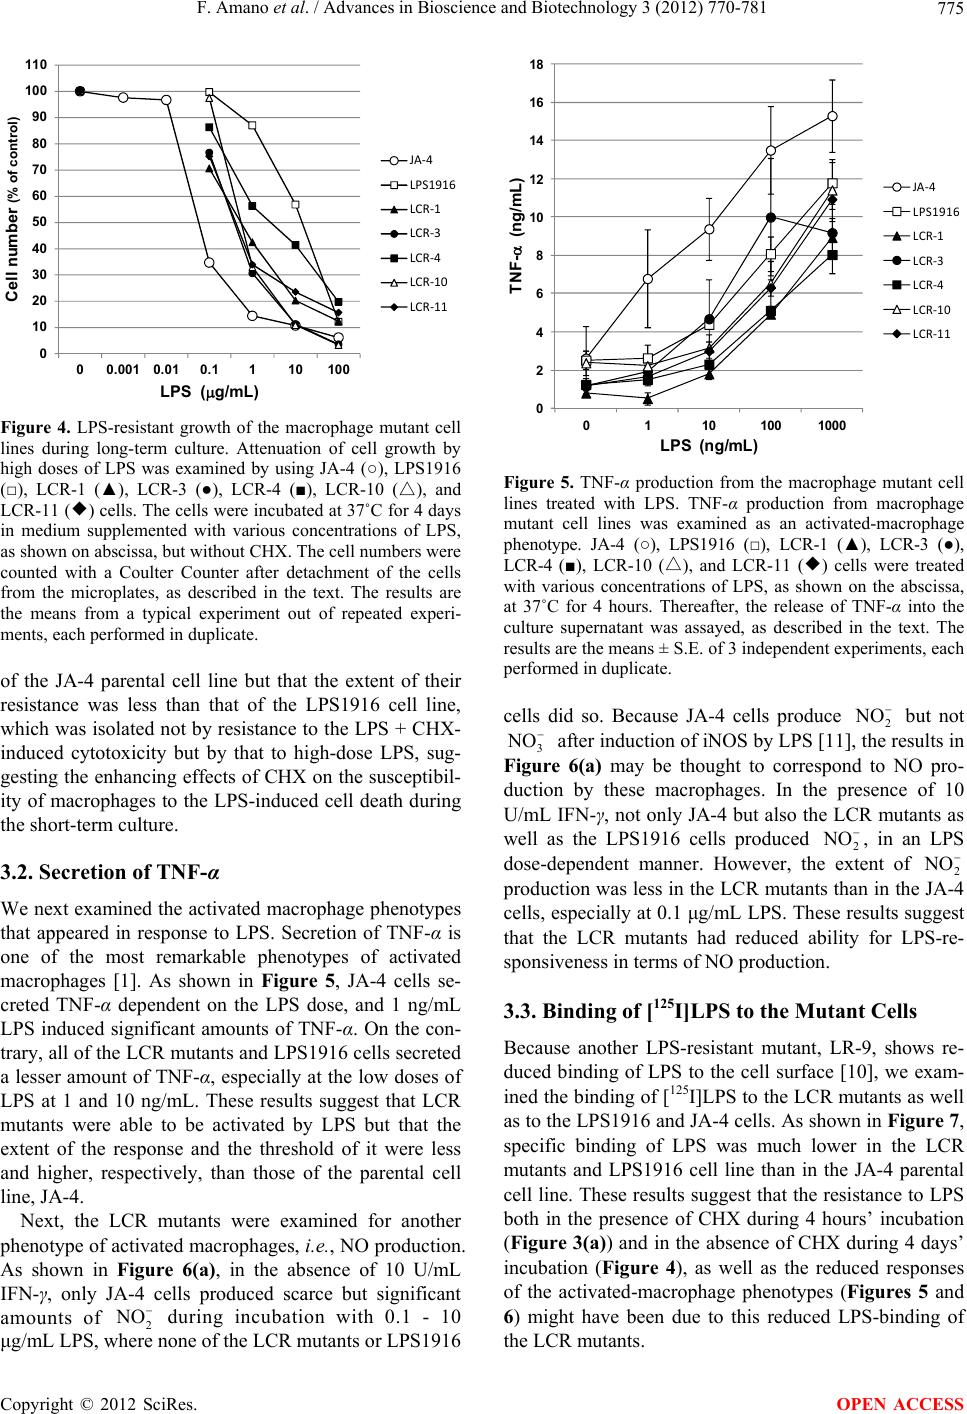 F. Amano et al. / Advances in Bioscience and Biotechnology 3 (2012) 770-781 775 0 10 20 30 40 50 60 70 80 90 100 110 00.001 0.010.1110100 Cell number (% of contro l) LPS (g/mL) JA‐4 LPS1916 LCR‐1 LCR‐3 LCR‐4 LCR‐10 LCR‐11 Figure 4. LPS-resistant growth of the macrophage mutant cell lines during long-term culture. Attenuation of cell growth by high doses of LPS was examined by using JA-4 (○), LPS1916 (□), LCR-1 (▲), LCR-3 (●), LCR-4 (■), LCR-△ 10 (), and LCR- ◆ 11 () cells. The cells were incubated at 37˚C for 4 days in medium supplemented with various concentrations of LPS, as shown on abscissa, but without CHX. The cell numbers were counted with a Coulter Counter after detachment of the cells from the microplates, as described in the text. The results are the means from a typical experiment out of repeated experi- ments, each performed in duplicate. of the JA-4 parental cell line but that the extent of their resistance was less than that of the LPS1916 cell line, which was isolated not by resistance to the LPS + CHX- induced cytotoxicity but by that to high-dose LPS, sug- gesting the enhancing effects of CHX on the susceptibil- ity of macrophages to the LPS-induced cell death during the short-term culture. 3.2. Secretion of TNF-α We next examined the activated macrophage phenotypes that appeared in response to LPS. Secretion of TNF-α is one of the most remarkable phenotypes of activated macrophages [1]. As shown in Figure 5, JA-4 cells se- creted TNF-α dependent on the LPS dose, and 1 ng/mL LPS induced significant amounts of TNF-α. On the con- trary, all of the LCR mutants and LPS1916 cells secreted a lesser amount of TNF-α, especially at the low doses of LPS at 1 and 10 ng/mL. These results suggest that LCR mutants were able to be activated by LPS but that the extent of the response and the threshold of it were less and higher, respectively, than those of the parental cell line, JA-4. Next, the LCR mutants were examined for another phenotype of activated macrophages, i.e., NO production. As shown in Figure 6(a), in the absence of 10 U/mL IFN-γ, only JA-4 cells produced scarce but significant amounts of 2 during incubation with 0.1 - 10 μg/mL LPS, where none of the LCR mutants or LPS1916 NO 0 2 4 6 8 10 12 14 16 18 0110100 1000 TNF-(ng/mL) LPS ( ng/mL) JA‐4 LPS1916 LCR‐1 LCR‐3 LCR‐4 LCR‐10 LCR‐11 Figure 5. TNF-α production from the macrophage mutant cell lines treated with LPS. TNF-α production from macrophage mutant cell lines was examined as an activated-macrophage phenotype. JA-4 (○), LPS1916 (□), LCR-1 (▲), LCR-3 (●), LCR-4 (■), LCR-△ 10 (), and LCR-◆ 11 () cells were treated with various concentrations of LPS, as shown on the abscissa, at 37˚C for 4 hours. Thereafter, the release of TNF-α into the culture supernatant was assayed, as described in the text. The results are the means ± S.E. of 3 independent experiments, each performed in duplicate. cells did so. Because JA-4 cells produce 2 NO but not 3 NO after induction of iNOS by LPS [11], the results in Figure 6(a) may be thought to correspond to NO pro- duction by these macrophages. In the presence of 10 U/mL IFN-γ, not only JA-4 but also the LCR mutants as well as the LPS1916 cells produced 2, in an LPS dose-dependent manner. However, the extent of 2 NO NO production was less in the LCR mutants than in the JA-4 cells, especially at 0.1 μg/mL LPS. These results suggest that the LCR mutants had reduced ability for LPS-re- sponsiveness in terms of NO production. 3.3. Binding of [125I]LPS to the Mutant Cells Because another LPS-resistant mutant, LR-9, shows re- duced binding of LPS to the cell surface [10], we exam- ined the binding of [125I]LPS to the LCR mutants as well as to the LPS1916 and JA-4 cells. As shown in Figure 7, specific binding of LPS was much lower in the LCR mutants and LPS1916 cell line than in the JA-4 parental cell line. These results suggest that the resistance to LPS both in the presence of CHX during 4 hours’ incubation (Figure 3(a)) and in the absence of CHX during 4 days’ incubation (Figure 4), as well as the reduced responses of the activated-macrophage phenotypes (Figures 5 and 6) might have been due to this reduced LPS-binding of the LCR mutants. Copyright © 2012 SciRes. OPEN ACCESS 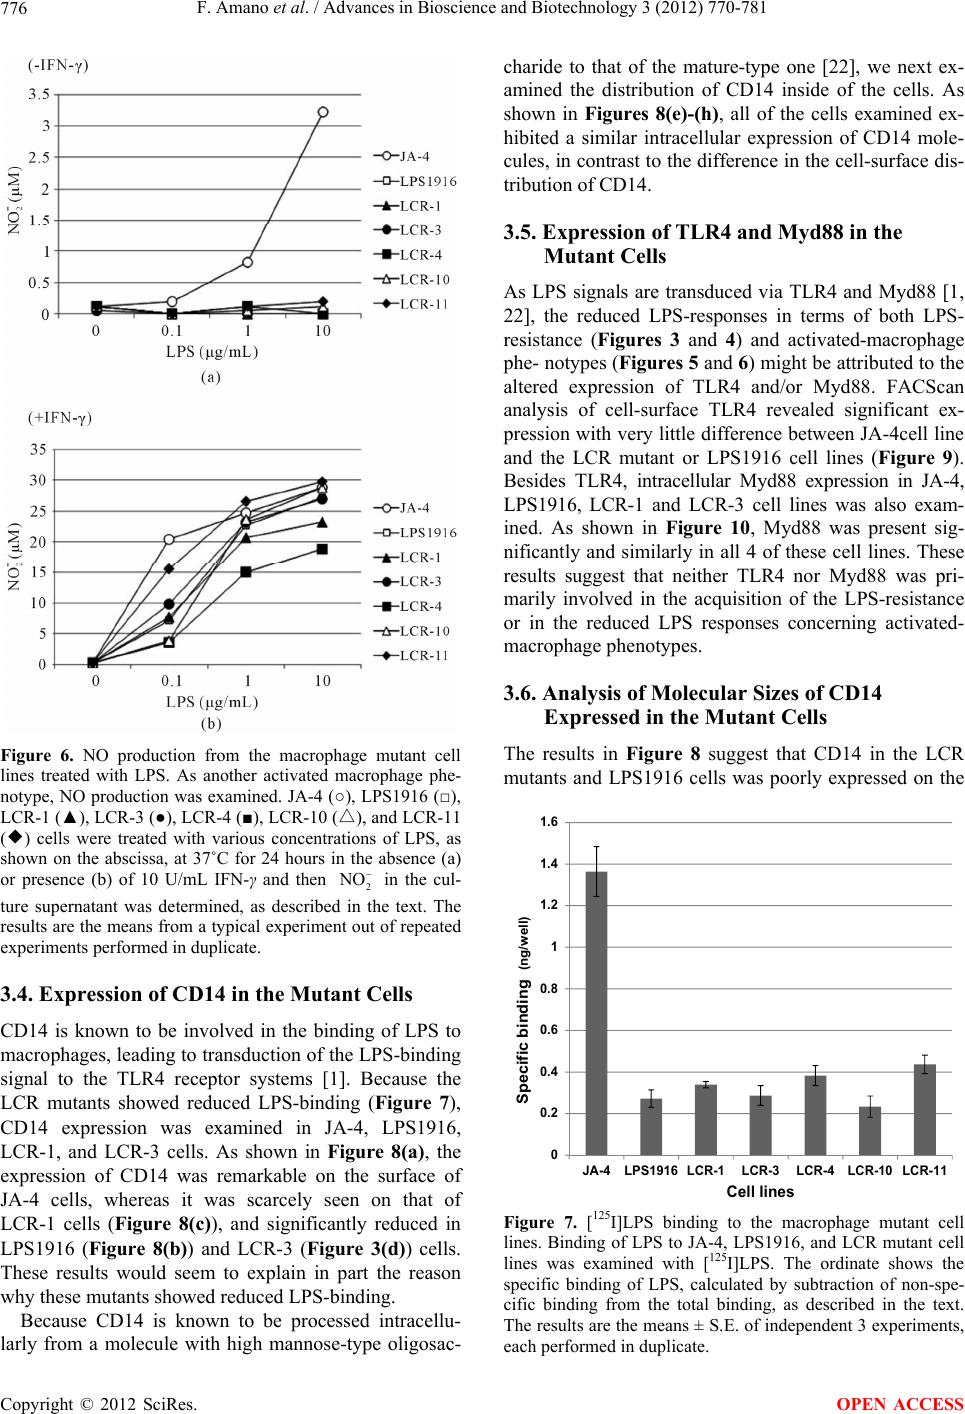 F. Amano et al. / Advances in Bioscience and Biotechnology 3 (2012) 770-781 776 Figure 6. NO production from the macrophage mutant cell lines treated with LPS. As another activated macrophage phe- notype, NO production was examined. JA-4 (○), LPS1916 (□), LCR-1 (▲), LCR-3 (●), LCR-4 (■), LCR-△ 10 (), and LCR-11 ◆ () cells were treated with various concentrations of LPS, as shown on the abscissa, at 37˚C for 24 hours in the absence (a) or presence (b) of 10 U/mL IFN-γ and then in the cul- ture supernatant was determined, as described in the text. The results are the means from a typical experiment out of repeated experiments performed in duplicate. 2 NO 3.4. Expression of CD14 in the Mutant Cells CD14 is known to be involved in the binding of LPS to macrophages, leading to transduction of the LPS-binding signal to the TLR4 receptor systems [1]. Because the LCR mutants showed reduced LPS-binding (Figure 7), CD14 expression was examined in JA-4, LPS1916, LCR-1, and LCR-3 cells. As shown in Figure 8(a), the expression of CD14 was remarkable on the surface of JA-4 cells, whereas it was scarcely seen on that of LCR-1 cells (Figure 8(c)), and significantly reduced in LPS1916 (Figure 8(b)) and LCR-3 (Figure 3(d)) cells. These results would seem to explain in part the reason why these mutants showed reduced LPS-binding. Because CD14 is known to be processed intracellu- larly from a molecule with high mannose-type oligosac- charide to that of the mature-type one [22], we next ex- amined the distribution of CD14 inside of the cells. As shown in Figures 8(e)-(h), all of the cells examined ex- hibited a similar intracellular expression of CD14 mole- cules, in contrast to the difference in the cell-surface dis- tribution of CD14. 3.5. Expression of TLR4 and Myd88 in the Mutant Cells As LPS signals are transduced via TLR4 and Myd88 [1, 22], the reduced LPS-responses in terms of both LPS- resistance (Figures 3 and 4) and activated-macrophage phe- notypes (Figures 5 and 6) might be attributed to the altered expression of TLR4 and/or Myd88. FACScan analysis of cell-surface TLR4 revealed significant ex- pression with very little difference between JA-4cell line and the LCR mutant or LPS1916 cell lines (Figure 9). Besides TLR4, intracellular Myd88 expression in JA-4, LPS1916, LCR-1 and LCR-3 cell lines was also exam- ined. As shown in Figure 10, Myd88 was present sig- nificantly and similarly in all 4 of these cell lines. These results suggest that neither TLR4 nor Myd88 was pri- marily involved in the acquisition of the LPS-resistance or in the reduced LPS responses concerning activated- macrophage phenotypes. 3.6. Analysis of Molecular Sizes of CD14 Expressed in the Mutant Cells The results in Figure 8 suggest that CD14 in the LCR mutants and LPS1916 cells was poorly expressed on the 0 0.2 0.4 0.6 0.8 1 1.2 1.4 1.6 JA-4LPS1916LCR-1 LCR-3 LCR-4LCR-10LCR-11 Specific bindi ng (ng/well) Cell lines Figure 7. [ 125I]LPS binding to the macrophage mutant cell lines. Binding of LPS to JA-4, LPS1916, and LCR mutant cell lines was examined with [125I]LPS. The ordinate shows the specific binding of LPS, calculated by subtraction of non-spe- cific binding from the total binding, as described in the text. The results are the means ± S.E. of independent 3 experiments, each performed in duplicate. Copyright © 2012 SciRes. OPEN ACCESS 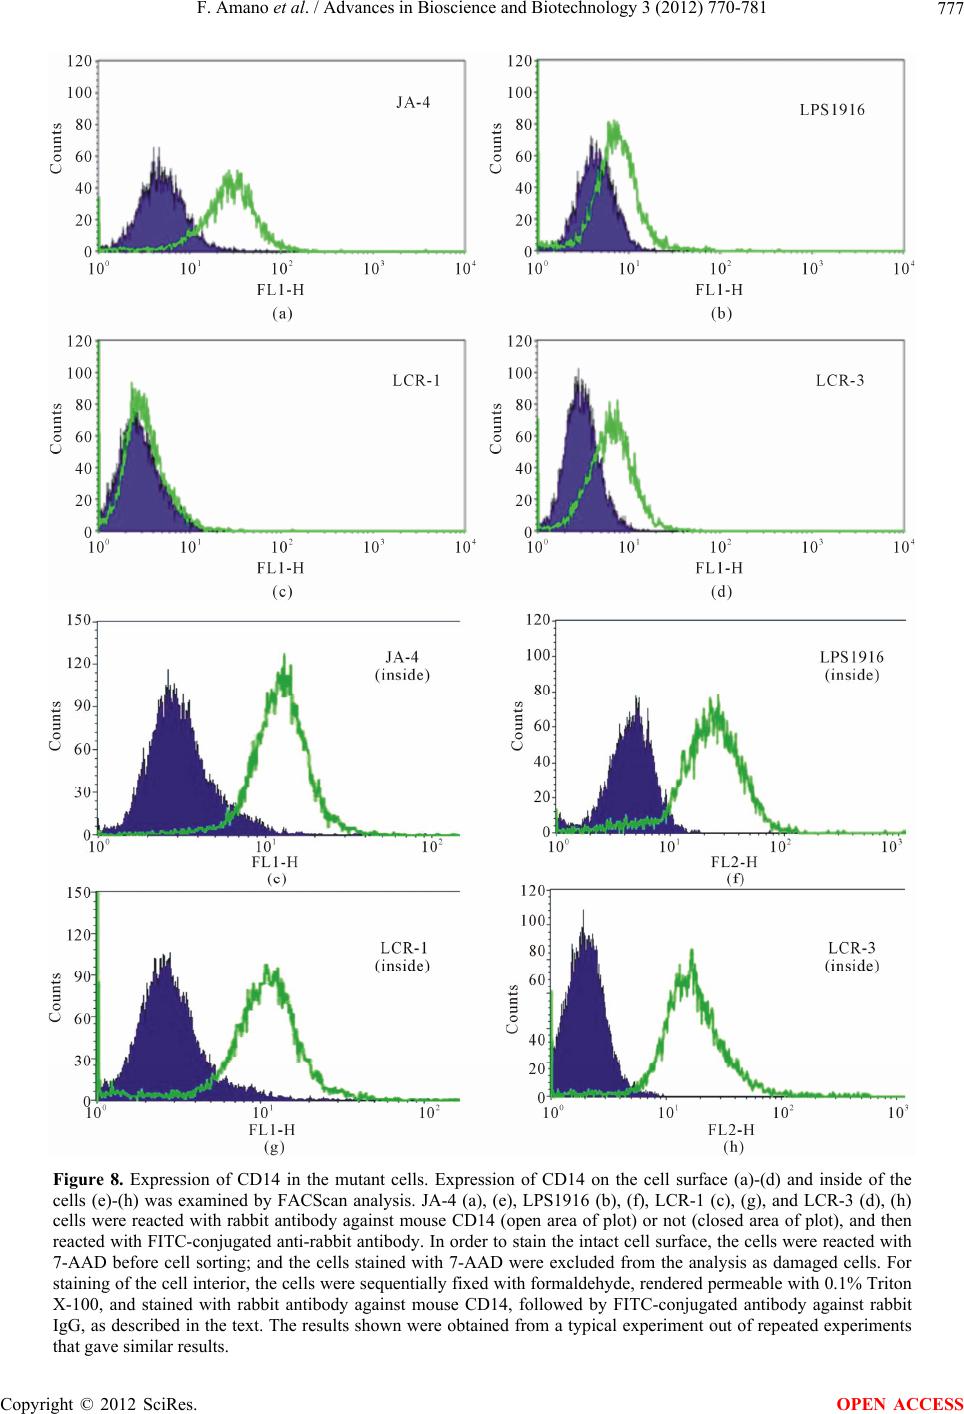 F. Amano et al. / Advances in Bioscience and Biotechnology 3 (2012) 770-781 Copyright © 2012 SciRes. 777 Figure 8. Expression of CD14 in the mutant cells. Expression of CD14 on the cell surface (a)-(d) and inside of the cells (e)-(h) was examined by FACScan analysis. JA-4 (a), (e), LPS1916 (b), (f), LCR-1 (c), (g), and LCR-3 (d), (h) cells were reacted with rabbit antibody against mouse CD14 (open area of plot) or not (closed area of plot), and then reacted with FITC-conjugated anti-rabbit antibody. In order to stain the intact cell surface, the cells were reacted with 7-AAD before cell sorting; and the cells stained with 7-AAD were excluded from the analysis as damaged cells. For staining of the cell interior, the cells were sequentially fixed with formaldehyde, rendered permeable with 0.1% Triton X-100, and stained with rabbit antibody against mouse CD14, followed by FITC-conjugated antibody against rabbit IgG, as described in the text. The results shown were obtained from a typical experiment out of repeated experiments that gave similar results. OPEN ACCESS 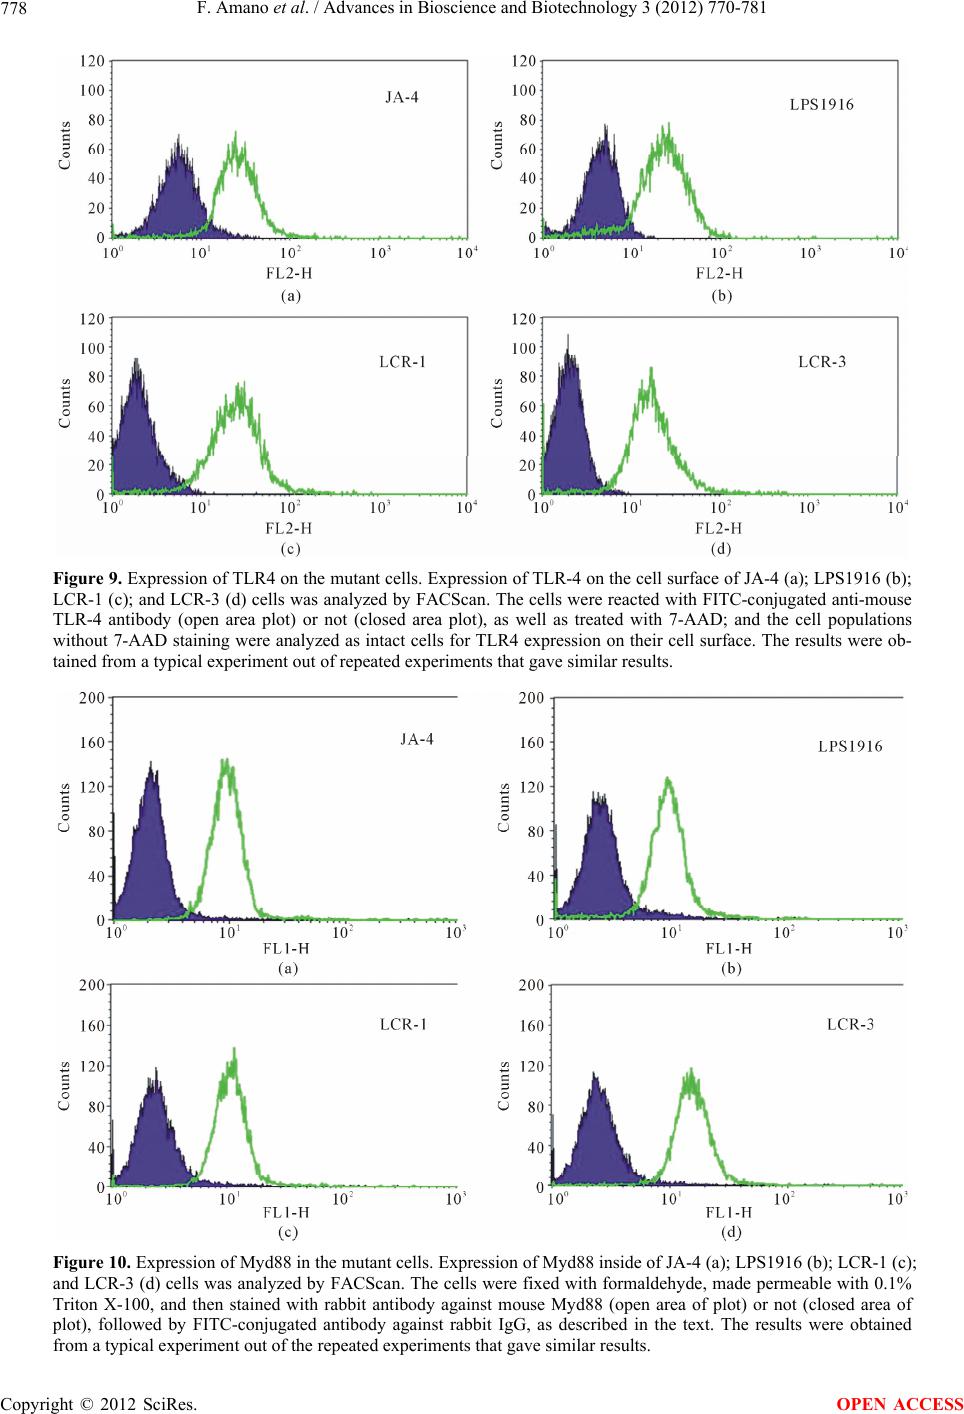 F. Amano et al. / Advances in Bioscience and Biotechnology 3 (2012) 770-781 778 Figure 9. Expression of TLR4 on the mutant cells. Expression of TLR-4 on the cell surface of JA-4 (a); LPS1916 (b); LCR-1 (c); and LCR-3 (d) cells was analyzed by FACScan. The cells were reacted with FITC-conjugated anti-mouse TLR-4 antibody (open area plot) or not (closed area plot), as well as treated with 7-AAD; and the cell populations without 7-AAD staining were analyzed as intact cells for TLR4 expression on their cell surface. The results were ob- tained from a typical experiment out of repeated experiments that gave similar results. Figure 10. Expression of Myd88 in the mutant cells. Expression of Myd88 inside of JA-4 (a); LPS1916 (b); LCR-1 (c); and LCR-3 (d) cells was analyzed by FACScan. The cells were fixed with formaldehyde, made permeable with 0.1% Triton X-100, and then stained with rabbit antibody against mouse Myd88 (open area of plot) or not (closed area of plot), followed by FITC-conjugated antibody against rabbit IgG, as described in the text. The results were obtained from a typical experiment out of the repeated experiments that gave similar results. Copyright © 2012 SciRes. OPEN ACCESS 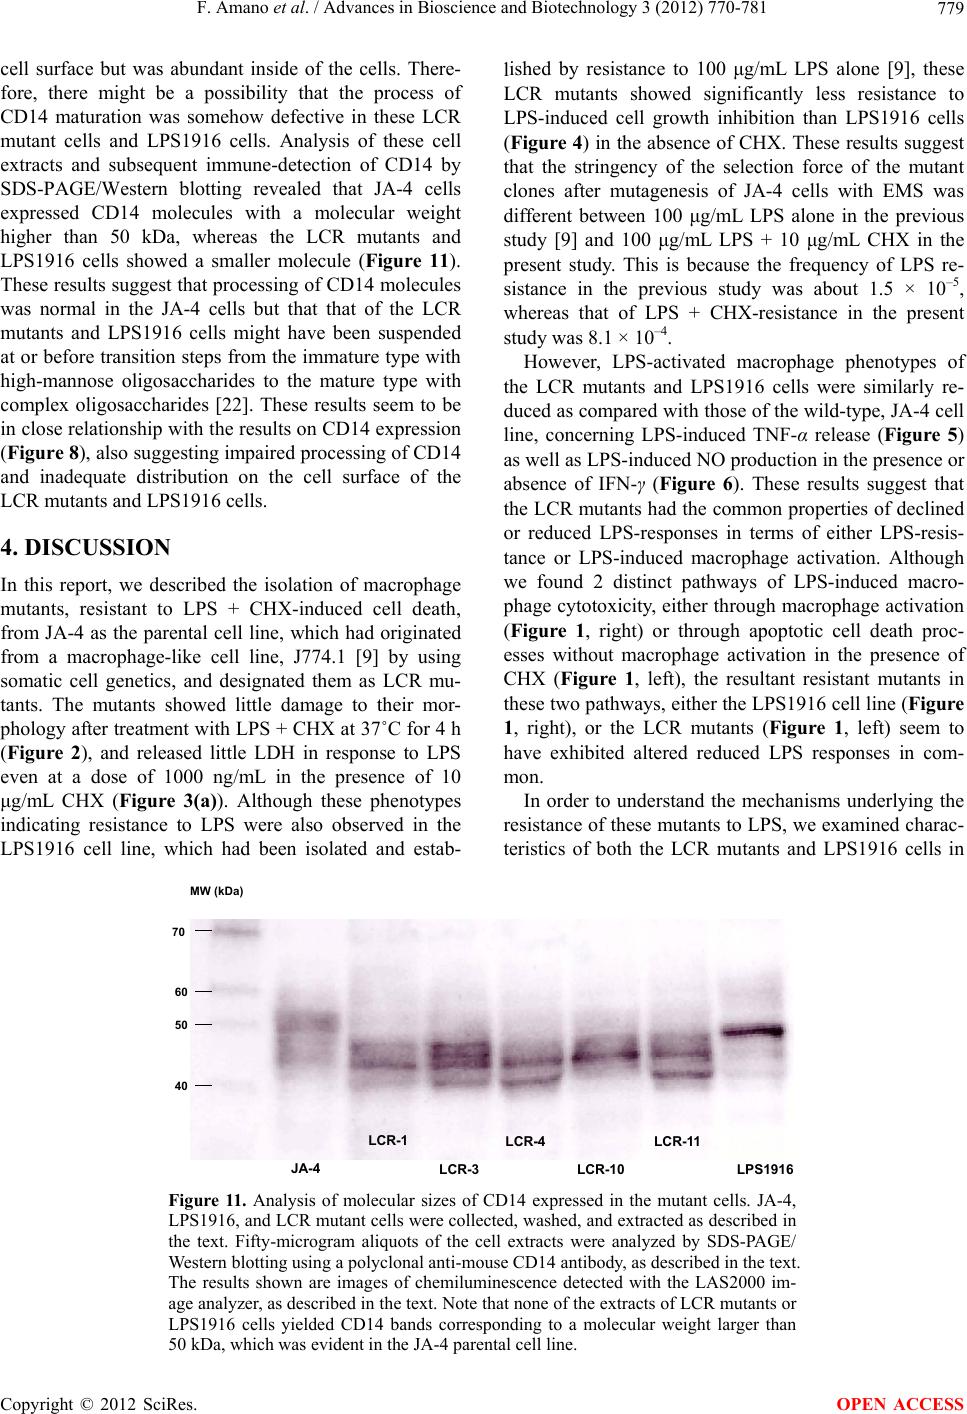 F. Amano et al. / Advances in Bioscience and Biotechnology 3 (2012) 770-781 Copyright © 2012 SciRes. 779 cell surface but was abundant inside of the cells. There- fore, there might be a possibility that the process of CD14 maturation was somehow defective in these LCR mutant cells and LPS1916 cells. Analysis of these cell extracts and subsequent immune-detection of CD14 by SDS-PAGE/Western blotting revealed that JA-4 cells expressed CD14 molecules with a molecular weight higher than 50 kDa, whereas the LCR mutants and LPS1916 cells showed a smaller molecule (Figure 11). These results suggest that processing of CD14 molecules was normal in the JA-4 cells but that that of the LCR mutants and LPS1916 cells might have been suspended at or before transition steps from the immature type with high-mannose oligosaccharides to the mature type with complex oligosaccharides [22]. These results seem to be in close relationship with the results on CD14 expression (Figure 8), also suggesting impaired processing of CD14 and inadequate distribution on the cell surface of the LCR mutants and LPS1916 cells. lished by resistance to 100 μg/mL LPS alone [9], these LCR mutants showed significantly less resistance to LPS-induced cell growth inhibition than LPS1916 cells (Figure 4) in the absence of CHX. These results suggest that the stringency of the selection force of the mutant clones after mutagenesis of JA-4 cells with EMS was different between 100 μg/mL LPS alone in the previous study [9] and 100 μg/mL LPS + 10 μg/mL CHX in the present study. This is because the frequency of LPS re- sistance in the previous study was about 1.5 × 10⁻⁵, whereas that of LPS + CHX-resistance in the present study was 8.1 × 10⁻⁴. However, LPS-activated macrophage phenotypes of the LCR mutants and LPS1916 cells were similarly re- duced as compared with those of the wild-type, JA-4 cell line, concerning LPS-induced TNF-α release (Figure 5) as well as LPS-induced NO production in the presence or absence of IFN-γ (Figure 6). These results suggest that the LCR mutants had the common properties of declined or reduced LPS-responses in terms of either LPS-resis- tance or LPS-induced macrophage activation. Although we found 2 distinct pathways of LPS-induced macro- phage cytotoxicity, either through macrophage activation (Figure 1, right) or through apoptotic cell death proc- esses without macrophage activation in the presence of CHX (Figure 1, left), the resultant resistant mutants in these two pathways, either the LPS1916 cell line (Figure 1, right), or the LCR mutants (Figure 1, left) seem to have exhibited altered reduced LPS responses in com- mon. 4. DISCUSSION In this report, we described the isolation of macrophage mutants, resistant to LPS + CHX-induced cell death, from JA-4 as the parental cell line, which had originated from a macrophage-like cell line, J774.1 [9] by using somatic cell genetics, and designated them as LCR mu- tants. The mutants showed little damage to their mor- phology after treatment with LPS + CHX at 37˚C for 4 h (Figure 2), and released little LDH in response to LPS even at a dose of 1000 ng/mL in the presence of 10 μg/mL CHX (Figure 3(a)). Although these phenotypes indicating resistance to LPS were also observed in the LPS1916 cell line, which had been isolated and estab- In order to understand the mechanisms underlying the resistance of these mutants to LPS, we examined charac- teristics of both the LCR mutants and LPS1916 cells in 70 60 50 40 MW (kDa) JA-4 LCR-1 LCR-3 LCR-4 LCR-10 LCR-11 LPS1916 Figure 11. Analysis of molecular sizes of CD14 expressed in the mutant cells. JA-4, LPS1916, and LCR mutant cells were collected, washed, and extracted as described in the text. Fifty-microgram aliquots of the cell extracts were analyzed by SDS-PAGE/ Western blotting using a polyclonal anti-mouse CD14 antibody, as described in the text. The results shown are images of chemiluminescence detected with the LAS2000 im- age analyzer, as described in the text. Note that none of the extracts of LCR mutants or LPS1916 cells yielded CD14 bands corresponding to a molecular weight larger than 50 kDa, which was evident in the JA-4 parental cell line. OPEN ACCESS 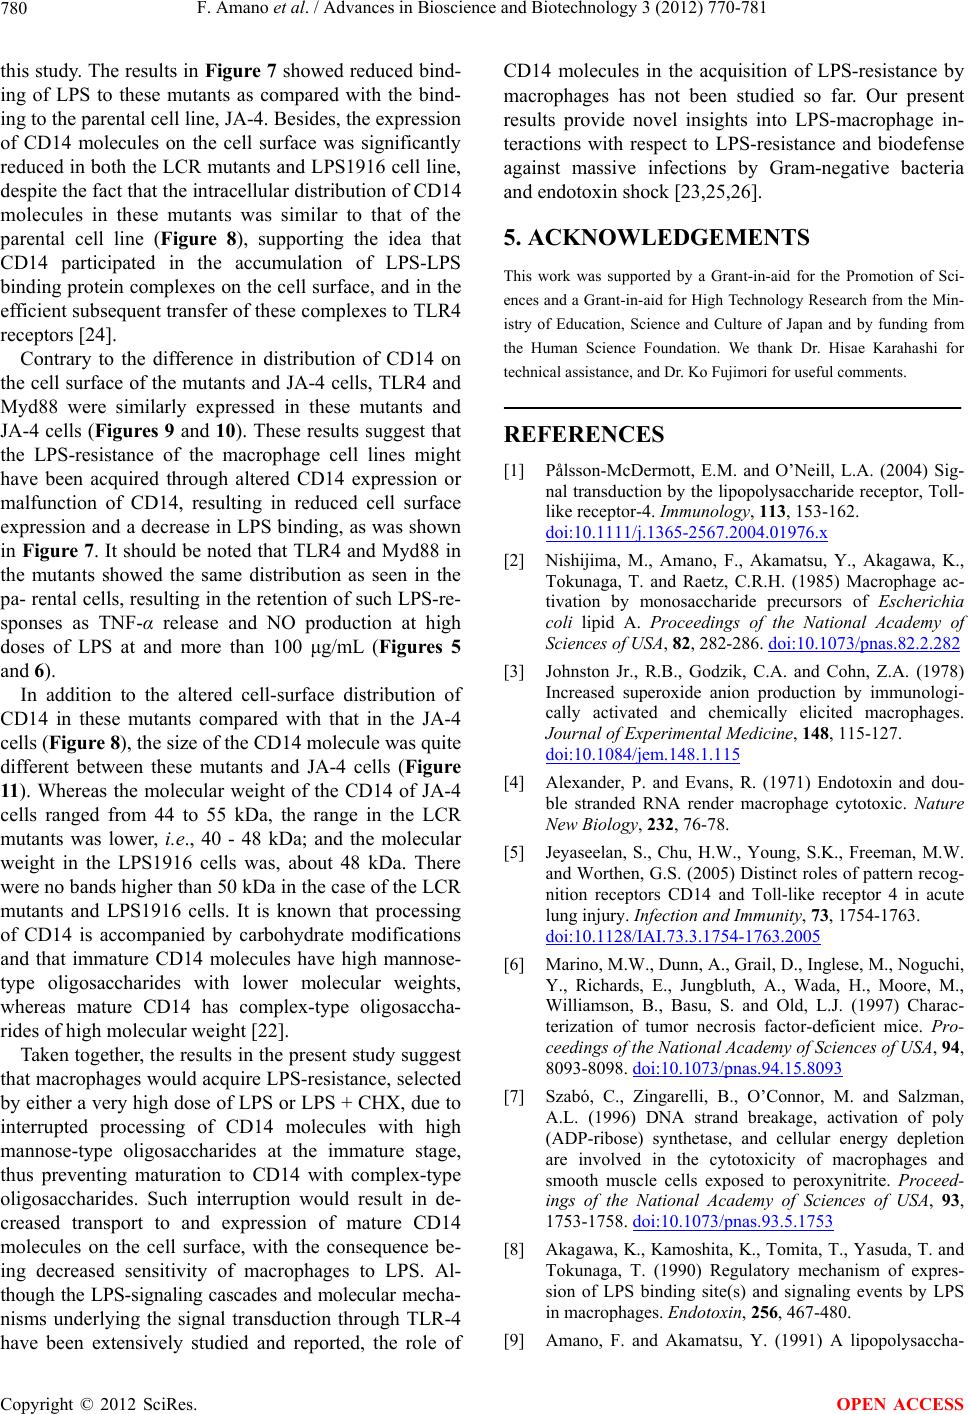 F. Amano et al. / Advances in Bioscience and Biotechnology 3 (2012) 770-781 780 this study. The results in Figure 7 showed reduced bind- ing of LPS to these mutants as compared with the bind- ing to the parental cell line, JA-4. Besides, the expression of CD14 molecules on the cell surface was significantly reduced in both the LCR mutants and LPS1916 cell line, despite the fact that the intracellular distribution of CD14 molecules in these mutants was similar to that of the parental cell line (Figure 8), supporting the idea that CD14 participated in the accumulation of LPS-LPS binding protein complexes on the cell surface, and in the efficient subsequent transfer of these complexes to TLR4 receptors [24]. Contrary to the difference in distribution of CD14 on the cell surface of the mutants and JA-4 cells, TLR4 and Myd88 were similarly expressed in these mutants and JA-4 cells (Figures 9 and 10). These results suggest that the LPS-resistance of the macrophage cell lines might have been acquired through altered CD14 expression or malfunction of CD14, resulting in reduced cell surface expression and a decrease in LPS binding, as was shown in Figure 7. It should be noted that TLR4 and Myd88 in the mutants showed the same distribution as seen in the pa- rental cells, resulting in the retention of such LPS-re- sponses as TNF-α release and NO production at high doses of LPS at and more than 100 μg/mL (Figures 5 and 6). In addition to the altered cell-surface distribution of CD14 in these mutants compared with that in the JA-4 cells (Figure 8), the size of the CD14 molecule was quite different between these mutants and JA-4 cells (Figure 11). Whereas the molecular weight of the CD14 of JA-4 cells ranged from 44 to 55 kDa, the range in the LCR mutants was lower, i.e., 40 - 48 kDa; and the molecular weight in the LPS1916 cells was, about 48 kDa. There were no bands higher than 50 kDa in the case of the LCR mutants and LPS1916 cells. It is known that processing of CD14 is accompanied by carbohydrate modifications and that immature CD14 molecules have high mannose- type oligosaccharides with lower molecular weights, whereas mature CD14 has complex-type oligosaccha- rides of high molecular weight [22]. Taken together, the results in the present study suggest that macrophages would acquire LPS-resistance, selected by either a very high dose of LPS or LPS + CHX, due to interrupted processing of CD14 molecules with high mannose-type oligosaccharides at the immature stage, thus preventing maturation to CD14 with complex-type oligosaccharides. Such interruption would result in de- creased transport to and expression of mature CD14 molecules on the cell surface, with the consequence be- ing decreased sensitivity of macrophages to LPS. Al- though the LPS-signaling cascades and molecular mecha- nisms underlying the signal transduction through TLR-4 have been extensively studied and reported, the role of CD14 molecules in the acquisition of LPS-resistance by macrophages has not been studied so far. Our present results provide novel insights into LPS-macrophage in- teractions with respect to LPS-resistance and biodefense against massive infections by Gram-negative bacteria and endotoxin shock [23,25,26]. 5. ACKNOWLEDGEMENTS This work was supported by a Grant-in-aid for the Promotion of Sci- ences and a Grant-in-aid for High Technology Research from the Min- istry of Education, Science and Culture of Japan and by funding from the Human Science Foundation. We thank Dr. Hisae Karahashi for technical assistance, and Dr. Ko Fujimori for useful comments. REFERENCES [1] Pålsson-McDermott, E.M. and O’Neill, L.A. (2004) Sig- nal transduction by the lipopolysaccharide receptor, Toll- like receptor-4. Immunology, 113, 153-162. doi:10.1111/j.1365-2567.2004.01976.x [2] Nishijima, M., Amano, F., Akamatsu, Y., Akagawa, K., Tokunaga, T. and Raetz, C.R.H. (1985) Macrophage ac- tivation by monosaccharide precursors of Escherichia coli lipid A. Proceedings of the National Academy of Sciences of USA, 82, 282-286. doi:10.1073/pnas.82.2.282 [3] Johnston Jr., R.B., Godzik, C.A. and Cohn, Z.A. (1978) Increased superoxide anion production by immunologi- cally activated and chemically elicited macrophages. Journal of Experimental Medicine, 148, 115-127. doi:10.1084/jem.148.1.115 [4] Alexander, P. and Evans, R. (1971) Endotoxin and dou- ble stranded RNA render macrophage cytotoxic. Nature New Biology, 232, 76-78. [5] Jeyaseelan, S., Chu, H.W., Young, S.K., Freeman, M.W. and Worthen, G.S. (2005) Distinct roles of pattern recog- nition receptors CD14 and Toll-like receptor 4 in acute lung injury. Infection and Immunity, 73, 1754-1763. doi:10.1128/IAI.73.3.1754-1763.2005 [6] Marino, M.W., Dunn, A., Grail, D., Inglese, M., Noguchi, Y., Richards, E., Jungbluth, A., Wada, H., Moore, M., Williamson, B., Basu, S. and Old, L.J. (1997) Charac- terization of tumor necrosis factor-deficient mice. Pro- ceedings of the National Academy of Sciences of USA, 94, 8093-8098. doi:10.1073/pnas.94.15.8093 [7] Szabó, C., Zingarelli, B., O’Connor, M. and Salzman, A.L. (1996) DNA strand breakage, activation of poly (ADP-ribose) synthetase, and cellular energy depletion are involved in the cytotoxicity of macrophages and smooth muscle cells exposed to peroxynitrite. Proceed- ings of the National Academy of Sciences of USA, 93, 1753-1758. doi:10.1073/pnas.93.5.1753 [8] Akagawa, K., Kamoshita, K., Tomita, T., Yasuda, T. and Tokunaga, T. (1990) Regulatory mechanism of expres- sion of LPS binding site(s) and signaling events by LPS in macrophages. Endotoxin, 256, 467-480. [9] Amano, F. and Akamatsu, Y. (1991) A lipopolysaccha- Copyright © 2012 SciRes. OPEN ACCESS  F. Amano et al. / Advances in Bioscience and Biotechnology 3 (2012) 770-781 781 ride (LPS)-resistant mutant isolated from a macrophage- like cell line, J774.1, exhibits an altered activated- macrophage phenotype in response to LPS. Infection and Immunity, 59, 2166-2174. [10] Hara-Kuge, S., Amano, F., Nishijima, M. and Akamatsu, Y. (1990) Isolation of an LPS-resistant mutant, with de- fective LPS binding, of cultured macrophage-like cells. Journal of Biological Chemistry, 265, 6606-6610. [11] Noda, T. and Amano, F. (1998) Defect in induction of nitric oxide synthase by lipopolysaccharide (LPS) in an LPS-resistant mutant of a murine macrophage-like cell line, J774.1. Biological and Pharmaceutical Bulletin, 21, 673-677. doi:10.1248/bpb.21.673 [12] Amano, F. and Karahashi, H. (1996) A cytotoxic effect of lipopolysaccharide (LPS) on a macrophage-like cell line, J774.1, in the presence of cycloheximide. Journal of En- dotoxin Research, 3, 415-423. [13] Karahashi, H., Nagata, K., Ishii, K. and Amano, F. (2000) A selective inhibitor of p38 MAP kinase, SB202190, in- duced apoptotic cell death of a lipopolysaccharide (LPS)- treated macrophage-like cell line, J774.1. Biochimica et Biophysica Acta, 1502, 207-223. doi:10.1016/S0925-4439(00)00045-4 [14] Karahashi, H. and Amano, F. (1998) Apoptotic changes preceding necrosis in lipopolysaccharide-treated macro- phages in the presence of cycloheximide. Experimental Cell Research, 241, 373-383. doi:10.1006/excr.1998.4062 [15] Karahashi, H. and Amano, F. (1999) LPS-induced signals in activation of a caspase-3-like protease, a key enzyme regulating apoptotic cell damage to a macrophage-like cell line, J774.1, in the presence of cycloheximide. Jour- nal of Leukocyte Biology, 66, 689-696. [16] Karahashi, H. and Amano, F. (2000) Changes of caspase activities involved in apoptosis of a macrophage-like cell line, J774.1/JA-4 treated with LPS and cycloheximide. Biological and Pharmaceutical Bulletin, 23, 140-144. doi:10.1248/bpb.23.140 [17] Karahashi, H. and Amano, F. (1998) Structure-activity relationships of lipopolysaccharide (LPS) in tumor necro- sis factor-α (TNF-α) production and induction of macro- phage cell death in the presence of cycloheximide (CHX) in a murine macrophage-like cell line, J774.1. Biological and Pharmaceutical Bulletin, 21, 1102-1105. [18] Amano, F. and Noda, T. (1995) Improved detection of nitric oxide radical (NO・) production in an activated macrophage culture with a radical scavenger, carboxy PTIO, and Griess reagent. FEBS Letters, 368, 425-428. doi:10.1016/0014-5793(95)00700-J [19] Karahashi, H. and Amano, F. (2003) Endotoxin-tolerance to the cytotoxicity toward a macrophage-like cell line, J774.1, induced by lipopolysaccharide and cycloheximide: Role of p38 MAPK in induction of the cytotoxicity. Bio- logical and Pharmaceutical Bulletin, 26, 1249-1259. doi:10.1248/bpb.26.1249 [20] Laemmli, U.K. (1970) Cleavage of structural proteins during the assembly of the head of bacteriophage T4. Nature, 227, 680-685. doi:10.1038/227680a0 [21] Ulevitch, R.J. (1978) The preparation and characteriza- tion of a radio-iodinated bacterial lipopolysaccharide. Immunochemistry, 15, 157-164. doi:10.1016/0161-5890(78)90144-X [22] Frey, T. and De Maio, A. (2009) The antifungal agent itraconazole induces the accumulation of high mannose glycoproteins in macrophages. Journal of Biological Che- mistry, 284, 16882-16890. doi:10.1074/jbc.M109.007609 [23] Miller, S.I., Ernst, R.K. and Bader, M.W. (2005) LPS, TLR4 and infectious disease diversity. Nature Reviews Microbiology, 3, 36-46. doi:10.1038/nrmicro1068 [24] Schumann, R.R., Rietschel, E.T. and Loppnow, H. (1994) The role of CD14 and lipopolysaccharide-binding protein (LBP) in the activation of different cell types by en- dotoxin. Medical Microbiology and Immunology, 183, 279-297. doi:10.1007/BF00196679 [25] Kitchens, R.L. and Munford, R.S. (1998) CD14-depen- dent internalization of bacterial lipopolysaccharide (LPS) is strongly influenced by LPS aggregation but not by cel- lular responses to LPS. Journal of Immunology, 160, 1920-1928. [26] Triantafilou, K., Triantafilou, M. and Dedrick, R.L. (2001) Interactions of bacterial lipopolysaccharide and pepti- doglycan with a 70 kDa and an 80 kDa protein on the cell surface of CD14+ and CD14− cells. Human Immunology, 62, 50-63. doi:10.1016/S0198-8859(00)00222-6. Copyright © 2012 SciRes. OPEN ACCESS
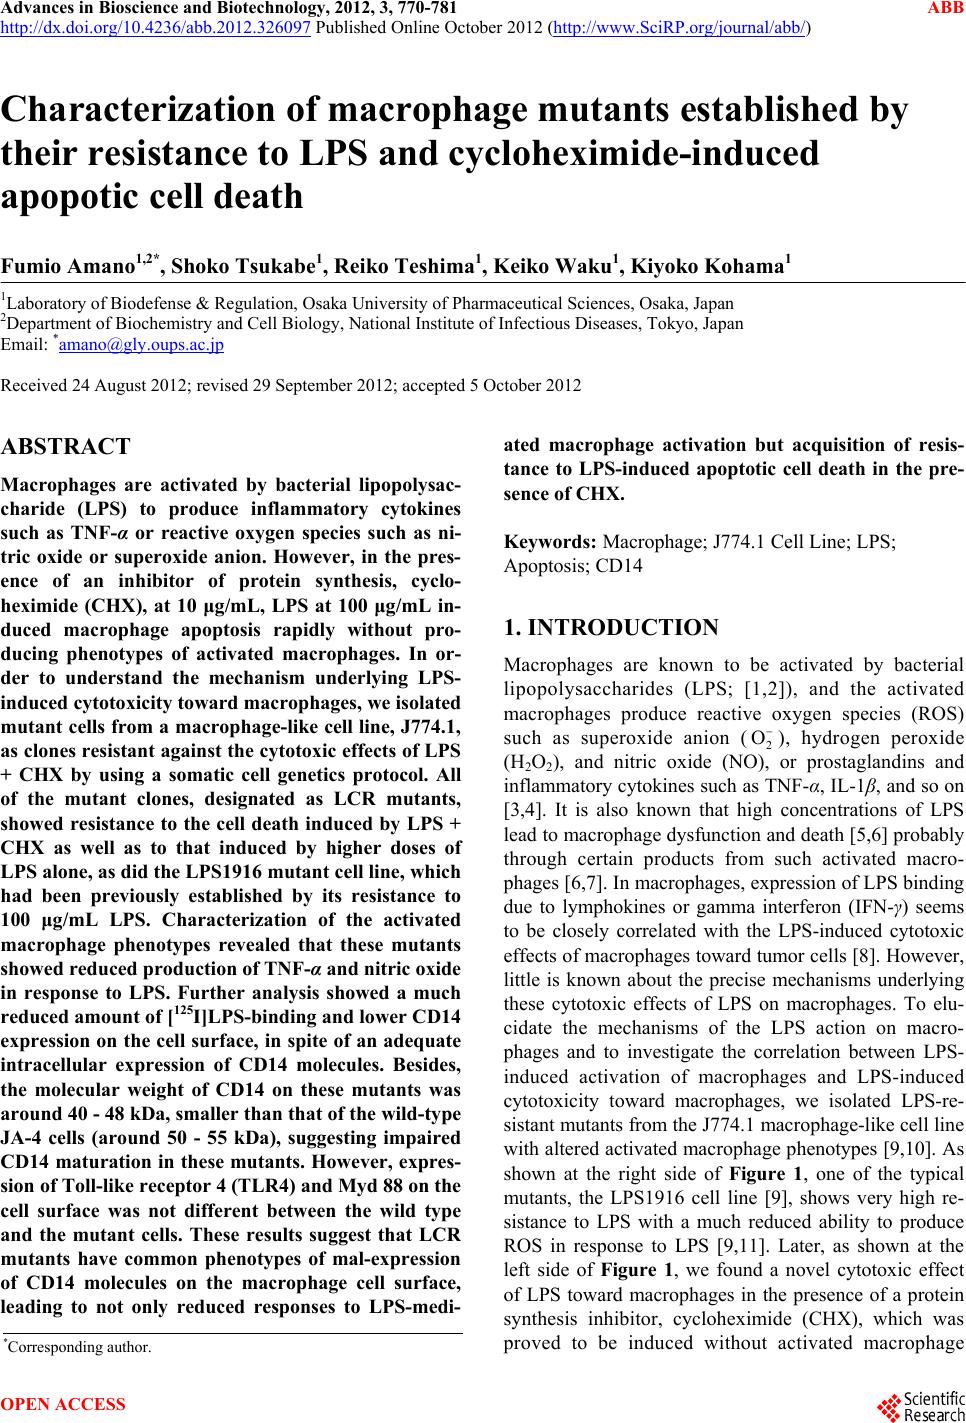
|