 Vol.3, No.6, 806-815 (2012) Agricultural Sciences http://dx.doi.org/10.4236/as.2012.36098 Swine waste as a source of natural products: A carotenoid antioxidant Lawrence B. Cahoon1*, Christopher J. Halkides2, Bongkeun Song3, C. Michael Williams4, George R. Dubay5, Alexandra Fries6, Johanna Farmer7, William Fridrich8, Charles Brookshire9 1Department of Biology and Marine Biology, UNC Wilmington, Wilmington, USA; *Corresponding Author: Cahoon@uncw.edu 2Department of Chemistry and Biochemistry, UNC Wilmington, Wilmington, USA; Halkidesc@uncw.edu 3Center for Marine Science, UNC Wilmington, Wilmington, USA; Songb@uncw.edu 4Animal and Poultry Waste Management Center, N.C. State University, Raleigh, USA; cmw@ncsu.edu 5Department of Chemistry, French Family Science Center, Duke University, Durham, USA; George.dubay@duke.edu 6Integration and Application Network, University of Maryland Center for Environmental Science, Cambridge, USA; afries@umces.edu 7Ecotoxicology Lab, BLD 218, Department of Biology, University of Louisiana at Lafayette, Lafayette, USA; jjf9423@louisiana.edu 81918 Princess Street, Wilmington, USA; william@fridrichdesign.com 9209 Stonewall Jackson Drive, Wilmington, USA; cdbrooks2@gmail.com Received 28 June 2012; revised 31 July 2012; accepted 9 August 2012 ABSTRACT Development of Environmentally Superior Tech- nologies for swine waste management has fo- cused on extraction of products with relatively low unit values. Analyses of the bacterial com- position of swine waste lagoon samples con- firmed the presence of several purple non-sulfur bacteria (PNSB) species known to produce a variety of carotenoids. We examined a carote- noid naturally abundant in North Carolina swine waste lagoons dominated by PNSB. Analytical methods including high performance liquid ch- romatography (HPLC), mass spectrometry, and nuclear magnetic resonance (NMR) confirmed the identity of the dominant carotenoid as spi- rilloxanthin, C42H60O2, with 13 conjugated double bonds. This structure confers antioxidant prop- erties as good as those of carotenoids currently marketed as antioxidants. Visual estimates of the “redness” of swine waste lagoon liquids were highly correlated with carotenoid content. Spirilloxanthin concentrations in a lagoon with a strong PNSB bloom were approximately 0.5 grams·m−3. These results support further inves- tigations into the potential for extracting com- mercially valuable natural products from swine waste lagoons. Keywords: Swine Waste; Purple Ph ototrophic Bacteria; Carotenoids; Spirilloxanthin 1. INTRODUCTION Intensive swine production has created several sig- nificant environmental challenges, particularly through widespread use of anaerobic waste storage lagoons and land application of lagoon liquids. This waste treatment approach can cause air quality problems with odors [1], gaseous ammonia emissions [2], greenhouse gas emis- sions (particularly methane), and airborne transport of particulates and aerosols [3], surface water quality prob- lems via lagoon breaches [4], nutrient export from spray fields [5] and downwind wet and dry aerial deposition [6], and groundwater contamination, particularly by ex- cess nitrate [7]. Disputes over these issues in North Carolina led to an agreement among government, indus- try, and university researchers to seek alternative waste treatment systems, leading to development of several Environmentally Superior Technology (EST) methods [8, 9] and subsequent second generation versions of these methods [10]. Similar challenges are being addressed by researchers elsewhere [11-13]. The primary consideration in development of ESTs is minimization at economically feasible costs of environ- mental problems associated with conventional waste treatment methods. Most alternative waste treatment systems focus on methods of recovering bulk commodi- ties, e.g., nutrients and bio-solids, or of converting waste into usable sources of energy, directly through methane generation and capture or via biological and chemical transformations into biofuels [14]. Economic benefits to swine producers were also an important consideration; North Carolina’s process of EST development has not yet Copyright © 2012 SciRes. OPEN ACCESS  L. B. Cahoon et al. / Agricultural Sciences 3 (2012) 806-815 807 created an economically viable alternative to conven- tional methods. Moreover, the products of these EST systems have relatively low market value, owing partly to low prices for these commodities, geographically con- centrated production in excess of local demand, and rela- tively high costs of transport to export markets. Conse- quently, in 2007 the North Carolina legislature stipulated use of EST waste treatment systems by new or expanded swine production operations, but left intact the use of conventional lagoon-spray field waste treatment systems by the approximately 2300 existing swine concentrated animal feeding operations (CAFOs) in North Carolina [15]. The problem with North Carolina’s approach may have been, as Kronenberg and Winkler [16] argued, a focus on process rather than outcome. We consider here the potential for utilization of natu- rally dominant microflora in conventional swine waste lagoons as potential sources of valuable natural products [17]. Swine waste management experts have recognized the importance of microbial assemblages in anaerobic waste treatment, and have provided recommendations for loading rates that support dominance by the purple non- sulfur bacteria (PNSB) that metabolize swine waste con- stituents particularly well [18-20]. These bacteria are metabolically versatile [21], are capable of photosyn- thetic and heterotrophic production, use reduced com- pounds, including many odorants [20,22], as electron donors, and biosynthesize a variety of potentially useful natural products [23]. We focus on one natural product, a carotenoid, from the PNSB that naturally dominate a significant number of swine lagoons in North Carolina, conferring a pink-purple color to them at least seasonally. The pink-purple color of this PNSB assemblage is con- ferred primarily by carotenoids of the spirilloxanthin and lycopene synthesis series [24,25]. Lycopene is currently marketed as a dietary supplement for its potent anti- oxidant properties [26]. The primary chromophore of these carotenoids is a long conjugated double bond sys- tem (11 - 13 carbon-carbon double bonds), which also confers antioxidant properties of potential commercial interest [27]. We report here the isolation, identification, quantification, and characterization of a carotenoid com- pound, spirilloxanthin, from swine waste lagoons in southeastern North Carolina. 2. MATERIALS AND METHODS 2.1. Sample Collection Swine lagoon samples were obtained in bulk quantities (5 - 10 L) for identification of the dominant carotenoid as needed from a cooperating swine producer in Pender County, NC, whose lagoon was dominated by PNSB year-round. Samples were retrieved in sterile, 1-L screw cap bottles and stored in refrigerators at 4˚C. Experience showed that PNSB concentrations were stable for 1 - 2 months under these conditions, and that the bacteria would float to the top over time, facilitating their re- moval for analytical work. Lagoon liquid is a complex matrix of bacteria, other organisms, other particulate matter, and numerous dissolved constituents. The domi- nant purple phototrophic bacteria in the samples ana- lyzed contained substantial amounts of carotenoids, bac- teriochlorophylls, and other lipid compounds that re- quired development of extraction and separation tech- niques suitable for this material. Consequently, identifi- cation of the principal carotenoid in waste lagoon liquid employed extraction and liquid chromatographic separa- tion procedures followed by mass spectrometry and nu- clear magnetic resonance (NMR) analyses. Additional sets of swine waste lagoon samples were obtained through North Carolina State University’s Animal and Poultry Waste Management Center from swine producers and from a cooperating swine integrator company on several occasions as part of their regular quarterly waste sampling and analysis program using sterile 0.5 L bottles. These samples were also refrigerated until sub-samples were withdrawn (after mixing the contents thoroughly) for use in analyses comparing various properties among lagoons. 2.2. Sample Preparation Samples for analysis of total solids concentrations were mixed thoroughly before decanting known volumes, freezing, lyophilizing, and weighing dried solids to ±1 mg on a Denver Instruments A-160 electro-balance. Floating material with high contents of purple phototro- phic bacteria was decanted from sample bottles, frozen at −80˚C, and lyophilized using a Virtis Benchtop Freeze Drier. The resulting purple powder was stored at −4˚C. The initial extraction protocol utilized a modified caro- tenoid extraction procedure from De Leenheer and Nellis [28], in which 3 - 4 washes of material with a mixture of reagent-grade KOH (60%) and methanol (MeOH) (1:10 ratio by volume) were used to saponify and remove lip- ids and bacteriochlorophylls. Following centrifugation, the supernatant was decanted and the remaining solid material was washed 2× with water, then extracted for 2 - 4 hours in 100% high performance liquid chromatogra- phy (HPLC) grade acetone. This extract was then filtered (0.2 µm) and cleaned by solid phase extraction (SPE). The filtered acetone extract was diluted to ~80% with deionized water, then drawn through a Fisher Sep-Pak reversed phase C18 SPE column that had been condi- tioned with 100% acetone and water. Retained carote- noids yielded an orange-red color in the column packing. Following a wash step with 100% methanol, carotenoids were eluted with a 60:40 mixture of HPLC-grade methyl Copyright © 2012 SciRes. OPEN ACCESS  L. B. Cahoon et al. / Agricultural Sciences 3 (2012) 806-815 808 tert-butyl ether (MTBE) and MeOH. These cleaned ca- rotenoid extracts were used immediately in HPLC sepa- rations and analyses. 2.3. Analytical Methods-Carotenoid The method of Niedzwiedzki et al. [29] was used with modifications to prepare pigment samples for mass spec- tral analysis. Cells were mixed with 30 ml of MeOH/ acetone 1:1 and centrifuged in Corex glass tubes at 6000 g for 5 min in a Sorvall SS34 rotor. The supernatant con- taining a mixture of bacteriochlorophyll and carotenoids was collected and dried using a rotary evaporator. The dry residue was dissolved in ~200 ml of MeOH/petro- leum ether (9:1) and saponified using 5% w/v KOH to decompose the bacteriochlorophyll. The solution was then washed with water in a separatory funnel and the ether layer containing the carotenoids was collected and dried using a stream of nitrogen gas. The final step was chromatography over silica using 85% hexanes/15% acetone as the isocratic mobile phase. The sample eluted in bands of distinct colors, with the first fraction being dark orange. This fraction was stored at −80˚C under N2 for subsequent mass spectral analysis. Alternately, the method of Komori et al. [30] was used with modifica- tions for mass spectral sample preparation. The bulk of the bacteriochlorophyll was removed by a single extrac- tion with ~200 ml MeOH. Dehydrated pellets were ex- tracted 3X with 200 ml acetone. N-hexane (1 volume) and water (1 volume) were added to the pooled acetone extract (1 volume) to transfer the pigments to the n- hexane layer. The n-hexane fraction was dried in vacuo. The final step was chromatography over silica, as above. Samples for NMR analyses were prepared according to [28] with modifications. Liquid waste was sampled from the lagoon and placed in volumetric flasks for sev- eral days. The pinkish material that floated to the top was lyophilized. In a typical procedure about 1 g of the ly- ophilized powder was treated with 60% KOH for two hours in the dark with occasional swirling. The solution was diluted six-fold with water and then centrifuged at 16,000 - 17,000 rpm in a Beckman JA-20 rotor for 45 - 60 minutes at about 10˚C. The supernatant was discarded and the jelly-like pellet was extracted with 10 ml of phenol using a tissue homogenizer. The phenol solution was extracted using a 50/50 mixture of dichloromethane and cyclohexane as the organic phase and 10% KOH/5% NaCl as the aqueous phase. If an emulsion formed it was broken by filtration using celite. The organic layer was dried with MgSO4 and the solvent was removed by ro- tary evaporation. The solid was taken up in approxi- mately 25 ml of hexane and 10 ml of MeOH and trans- ferred to a separatory funnel and shaken. The methanol layer was extracted twice more with portions of hexane. The combined hexane layers were extracted with a fresh portion of MeOH, and the second portion of MeOH was extracted with 2 - 3 portions of hexane. Hexane was re- moved with rotary evaporation. The final purification step was reversed phase HPLC (RP-HPLC) using a Hewlett Packard HP 1100 system with photo-diode array UV-Vis detection, column tem- perature set at 25˚C, and a semi-preparatory C-30 col- umn (NEST group; a Maccel 150 × 10.4 mm 200-5-C30 column, 5 µm particle size and 200 Å pore size). The mobile phase was 60% MTBE and 40% MeOH, and the flow rate was 5 ml per minute. The MTBE had been treated with alumina to remove peroxides then decanted and filtered as usual. The solid was dissolved in the mo- bile phase plus 10% CH2Cl2, passed through a syringe filter, and loaded onto a 2.0 ml sample loop. Compounds were detected by monitoring at 210, 495, and 700 nm using diode array detection. The last compound to elute was the carotenoid of interest, although at least four other carotenoids were present in smaller amounts. The volume of the combined fractions was noted, and the absorbance spectrum (300 - 700 nm) was taken to esti- mate the amount of carotenoid. The column was peri- odically cleaned using a gradient of MeOH and chloro- form, with an additional cleaning step using hexane also performed in some instances. Smaller samples were typically purified using a 150 × 4.6 mm column of the same stationary phase at a flow rate of 1.0 ml/min. Sample fractions corresponding to the dominant caro- tenoid peak fraction were analyzed by mass spectrometry and NMR. High resolution mass spectrometers were used in analyses of separate carotenoid fraction samples: an Applied Biosystems Q-trap 2000 LC-MS system at UNC Wilmington’s Center for Marine Science, and a JEOL JMS-SX102A HRMS system and an Agilent 6224 LCMS-TOF system with an Agilent series 1200 LC at the Department of Chemistry at Duke University. NMR data were acquired on a Varian Inova 800 MHz NMR equipped with a cryoprobe at the Duke Magnetic Reso- nance Spectroscopy Center. Standard 1D 1H, 1H/1H COSY (correlated spectroscopy), 1H/1H TOCSY (total correlation spectroscopy), 1H/13C HSQC (heteronuclear single quantum coherence), and 1H/13C HMBC (hetero- nuclear multiple bond coherence) spectra were obtained at room temperature in 99.96% CDCl3 (Cambridge Iso- tope Laboratories, Andover, MA). The program WINDNMR-pro (Hans J. Reich) was used for spectral simulations. 2.4. Comparisons among Lagoon Samples Properties of samples from a variety of swine waste lagoons analyzed and reported include total carotenoid and bacteriochlorophyll contents and visible color spec- Copyright © 2012 SciRes. OPEN ACCESS  L. B. Cahoon et al. / Agricultural Sciences 3 (2012) 806-815 809 trum. Total carotenoid content in swine waste samples was measured as absorbance at 495 nm in acetone ex- tracts of materials filtered onto Gelman A/E glass fiber filters. Typical filtered volumes were 2 - 4 ml/sample. Bacteriochlorophyll content was measured as absorbance at 780 nm for the same extracted samples. The visible color of swine waste lagoon samples was analyzed using a digital (2 MB) photograph of each waste lagoon sample in a clear polystyrene Petri plate. Each of the images (124 total) was produced identically in focus, size and resolution with a custom camera mount, and included a white/gray/black color target to allow exact color temperature matching among the individual photographs. Each image was sampled and ordinated according to its measured hue value (most red to least red) expressed in degrees (0˚ - 360˚) in the standard HSV (Hue, Saturation, and Value or Brightness, HSB) color space. The red primary area in the color space was ap- proximately 350˚ to 10˚. The color study representation may be seen here: http ://gallery.me.com/williamfridrich# 100282. For information on HSV see: http://en.wikipedia. org/wiki/HSL_color_space. 2.5. Antioxidant Capacity Analyses The anti-oxidant properties of the principal carotenoid isolated from swine lagoon waste were further analyzed using two different published assays for lipophilic anti- oxidants [31,32]. Purified fractions of swine waste caro- tenoid were prepared by HPLC using a semi-preparatory C30 column and isocratic 60:40 MTBE:MeOH elution as above. These purified fractions were assayed using the ABTS procedure of Re et al. [31] and the DPPH method of Brand-Williams et al. [32] with some modifications. ABTS (2,2’-azinobis(3-ethylbenzothiazoline-6-sulfonic acid) diammonium salt; Sigma) was dissolved in water to 7 mM concentration (5 tablets of ABTS as supplied dis- solved in 13 ml DI water). Potassium persulfate solution (2.4 ml @ 2.45 mM) was mixed with ABTS solution and allowed to react for 24 h in the dark to form a stable, highly colored free radical solution. To prepare the final ABTS solution for the assay, 1 ml of ABTS was diluted with 19 ml ethanol to obtain an absorbance of approxi- mately 0.70 at 734 nm. For each reaction 150 μl of stan- dard carotenoid (lycopene and beta-carotene) or swine waste carotenoid solution was added to 2.85 ml of the final ABTS solution. The absorbance at 734 nm was taken using a spectrophotometer each minute for 6 min. The absorbance values decreased for the duration of the reaction due to reduction of the ABTS pre-formed radical cation by hydrogen donation of the antioxidant com- pound in question. As ABTS is a decolorization assay, the degree of color reduction during the reaction corre- sponded with the antioxidant power of the carotenoid. Molar concentrations of respective carotenoids were de- termined by published values for molar absorptivities in known solvents [33]. Decolorization was expressed as change in absorbance nmol−1 of carotenoid, with higher values corresponding to greater antioxidant capacity. DPPH (2,2-diphenyl-1-picrylhydrazyl) is another stable, highly colored free radical in solution. A stock solution was prepared by dissolving 24 mg DPPH in 100 ml MeOH and stored at −10˚C. The working solution was acquired by adding 10 ml of stock solution to 45 ml MeOH to obtain an absorbance reading of approximately 1.1 at 515 nm. For each reaction 150 μl of standard caro- tenoid or swine waste carotenoid was added to 2.85 ml of the DPPH solution and allowed to react for 24 h in the dark. Absorbance readings were then measured at 515 nm. Subsequent to the reaction, the absorbance values decreased due to the reduction of the DPPH free radical by the donation of hydrogen ions from the carotenoid. Molar concentrations of respective carotenoids were de- termined as above, and antioxidant capacity of each ca- rotenoid was expressed as change in absorbance nmol−1. 2.6. Bacterial Community Composition Bacterial composition in a lagoon slurry was deter- mined with triplicate samples collected from the Pender County lagoon. A serial dilution from 1:1 to 1:1000 was made from the swine lagoon slurry and 50 µl of each dilution was spread onto R2A agar plates in duplicate. The plates were placed in a 30˚C incubator and allowed to grow for 3 days. Isolates that resulted in pigment for- mation were transferred to fresh R2A plates and incu- bated for 24 h. Genomic DNA from the hog lagoon iso- lates was extracted using the Gentra Puregene DNA Purification Kit (Gentra Systems, Inc.; Minneapolis, MN). 16S rRNA genes were amplified using 27F and 685R primers [34] and Promega GoTaq Master Mix (Promega Corporation; Madison, WI) according to ma- nufacturer’s protocol with a 55˚C primer annealing in a 50 µl reaction volume. Polymerase chain reaction (PCR) amplicons with the 1542 base pair (bp) size were deter- mined by agarose gel electrophoresis (1% (wt/vol)) and were purified using the Promega Wizard SV Gel and PCR Clean-Up System (Promega Corporation; Madison, WI). The purified products were sequenced using the ABI Prism® 3100 Genetic Analyzer (Applied Biosystems; Foster City, CA). The sequences obtained were BLAST- searched (http://www.ncbi.nih.gov/) to determine the closest matched bacterial species. 3. RESULTS 3.1 Bacterial Community Composition Bacterial isolates from the swine lagoon samples were Copyright © 2012 SciRes. OPEN ACCESS  L. B. Cahoon et al. / Agricultural Sciences 3 (2012) 806-815 810 selected based on the differences in colony colors and shapes. Fifty three isolates were obtained and identified using 16S rRNA gene sequences (Ta b l e 1 ). Twenty two isolates produced visible pigments based on the growth on R2A plates. Among them, 7 isolates generating red pigments belong to the genera of Rhodococcus, Rhodo- bacter, Pseudomonas, or Thermomo nas (Tab le 1), which include species capable of synthesizing spirilloxanthin [24]. Tab le 1. Bacterial isolates from swine waste lagoons and taxo- nomic identification based on 16S rRNA gene sequences. Bacterial Isolate Colony Color Bacterial Identification HL1/HL7/HL9 Red Thermomonas sp. HL 10 White Nocardiopsis sp. HL11 White Bacillus sp. HL 13 Orange Deinococcus sp. HL14/HL41 Cream Pseudomonas sp. HL15/HL28/HL45 White Acinetobacter sp. HL16 Cream Psychrobacter sp. HL17/HL39/HL43 Yellow Flavobacterium sp. HL19 Cream Proteus sp. HL2/HL18 Yellow Sphingobacterium sp. HL20 Clear Corynebacterium sp. HL21 White Imtechium sp. HL22/HL31/HL48/ HL49/HL50/HL51 Yellow Comamonas sp. HL27 White Rhizobium sp. HL29 Yellow Chryseobacterium sp. HL3/HL4/HL8/HL30 White Alcaligenes sp. HL32/HL36/HL53 Clear Hydrogenophaga sp. HL33 Yellow Arcobacter sp. HL34/HL40/HL42 Clear Azonexus sp. HL35 Clear Acidovorax sp. HL37 Red Rhodobacter sp. HL38 White Dechloromonas sp. HL44 White Porphyromonadaceae sp. HL46 Green Acidovorax sp. HL47 Red Pseudomonas sp. HL5/HL6 Red Rhodococcus sp. HL52 Yellow Kocuria sp. 3.2. Carotenoid Identification HPLC separation of swine waste bacterial pigments yielded chromatograms that typically exhibited a rapidly eluted peak identified by its absorbance spectrum as bacteriochlorophyll, followed by a series of peaks with absorbance spectra consistent with carotenoids. The last eluting and usually largest peak had an absorbance spec- trum in HPLC eluent that closely matched literature val- ues for spirilloxanthin (Figure 1, Table 2). Mass spectrometry of an HPLC eluent fraction corre- sponding to the largest HPLC peak using the Applied Biosystems Q-trap 2000 LC-MS system yielded peaks with mass estimates of 596.8 and 597.7 amu and tenta- tive molecular formula of C42H60O2, both consistent with published values for spirilloxanthin [36]. DART-MS spectra obtained from a carotenoid fraction that had been purified over silica yielded an exact mass of 596.4585 amu, which is 0.5 ppm from the calculated mass 596.4588 amu for C42H60O2. The result using EI on the JEOL SX-102 was also within the 5.0 ppm criterion for accurate mass confirmation. These results are consistent with spirilloxanthin. Two other carotenoids were also observed, with masses of 490.3807 and 613.4617 amu, but were not further characterized. Initial 1H NMR assignments were made on the basis of coupling constants. Initial 13C NMR assignments were made on the basis of HSQC data. COSY and HMBC spectra were used to resolve ambiguities, and the latter spectrum was also used to assign quaternary carbon at- oms. H-14 was assigned on the basis of spectral simula- tions of AA’XX’ systems, with the parameters JXX’ = 15 Hz, JAX = 11.2 Hz, and JAX’ = −3 Hz reproducing the main features of the relevant portion of the spectrum. The 3JHH coupling constants are J2,3 = 7.6 Hz, J3,4 = 15.6 Hz, J6,7 = 11.3 Hz, J7,8 = 14.9 Hz, J10,11 = 11.4 Hz, and Figure 1. Absorption spectrum of purified carotenoid in 60:40 MTBE:MeOH HPLC eluent. Copyright © 2012 SciRes. OPEN ACCESS 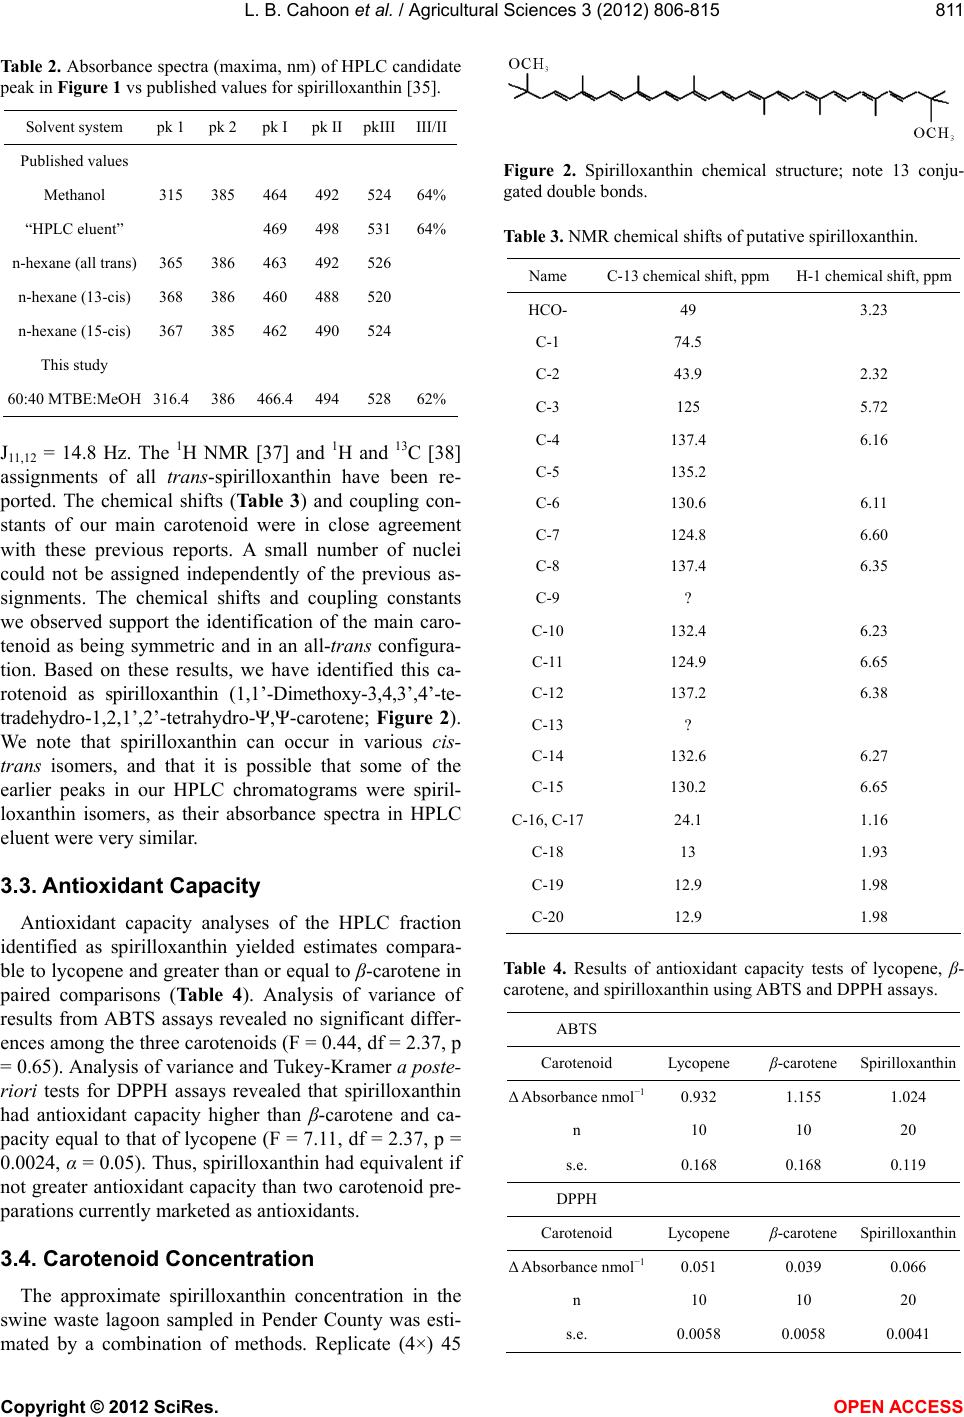 L. B. Cahoon et al. / Agricultural Sciences 3 (2012) 806-815 811 Tab le 2 . Absorbance spectra (maxima, nm) of HPLC candidate peak in Figure 1 vs published values for spirilloxanthin [35]. Solvent system pk 1 pk 2pk I pk II pkIIIIII/II Published values Methanol 315 385 464 492 52464% “HPLC eluent” 469 498 53164% n-hexane (all trans) 365 386 463 492 526 n-hexane (13-cis) 368 386 460 488 520 n-hexane (15-cis) 367 385 462 490 524 This study 60:40 MTBE:MeOH 316.4 386 466.4 494 52862% J11,12 = 14.8 Hz. The 1H NMR [37] and 1H and 13C [38] assignments of all trans -spirilloxanthin have been re- ported. The chemical shifts (Ta b l e 3 ) and coupling con- stants of our main carotenoid were in close agreement with these previous reports. A small number of nuclei could not be assigned independently of the previous as- signments. The chemical shifts and coupling constants we observed support the identification of the main caro- tenoid as being symmetric and in an all-trans configura- tion. Based on these results, we have identified this ca- rotenoid as spirilloxanthin (1,1’-Dimethoxy-3,4,3’,4’-te- tradehydro-1,2,1’,2’-tetrahydro-Ψ,Ψ-carotene; Figure 2). We note that spirilloxanthin can occur in various cis- trans isomers, and that it is possible that some of the earlier peaks in our HPLC chromatograms were spiril- loxanthin isomers, as their absorbance spectra in HPLC eluent were very similar. 3.3. Antioxidant Capacity Antioxidant capacity analyses of the HPLC fraction identified as spirilloxanthin yielded estimates compara- ble to lycopene and greater than or equal to β-carotene in paired comparisons (Table 4). Analysis of variance of results from ABTS assays revealed no significant differ- ences among the three carotenoids (F = 0.44, df = 2.37, p = 0.65). Analysis of variance and Tukey-Kramer a poste- riori tests for DPPH assays revealed that spirilloxanthin had antioxidant capacity higher than β-carotene and ca- pacity equal to that of lycopene (F = 7.11, df = 2.37, p = 0.0024, α = 0.05). Thus, spirilloxanthin had equivalent if not greater antioxidant capacity than two carotenoid pre- parations currently marketed as antioxidants. 3.4. Carotenoid Concentration The approximate spirilloxanthin concentration in the swine waste lagoon sampled in Pender County was esti- mated by a combination of methods. Replicate (4×) 45 Figure 2. Spirilloxanthin chemical structure; note 13 conju- gated double bonds. Table 3. NMR chemical shifts of putative spirilloxanthin. Name C-13 chemical shift, ppm H-1 chemical shift, ppm HCO- 49 3.23 C-1 74.5 C-2 43.9 2.32 C-3 125 5.72 C-4 137.4 6.16 C-5 135.2 C-6 130.6 6.11 C-7 124.8 6.60 C-8 137.4 6.35 C-9 ? C-10 132.4 6.23 C-11 124.9 6.65 C-12 137.2 6.38 C-13 ? C-14 132.6 6.27 C-15 130.2 6.65 C-16, C-1724.1 1.16 C-18 13 1.93 C-19 12.9 1.98 C-20 12.9 1.98 Table 4. Results of antioxidant capacity tests of lycopene, β- carotene, and spirilloxanthin using ABTS and DPPH assays. ABTS Carotenoid Lycopene β-carotene Spirilloxanthin Δ Absorbance nmol−10.932 1.155 1.024 n 10 10 20 s.e. 0.168 0.168 0.119 DPPH Carotenoid Lycopene β-carotene Spirilloxanthin Δ Absorbance nmol−10.051 0.039 0.066 n 10 10 20 s.e. 0.0058 0.0058 0.0041 Copyright © 2012 SciRes. OPEN ACCESS 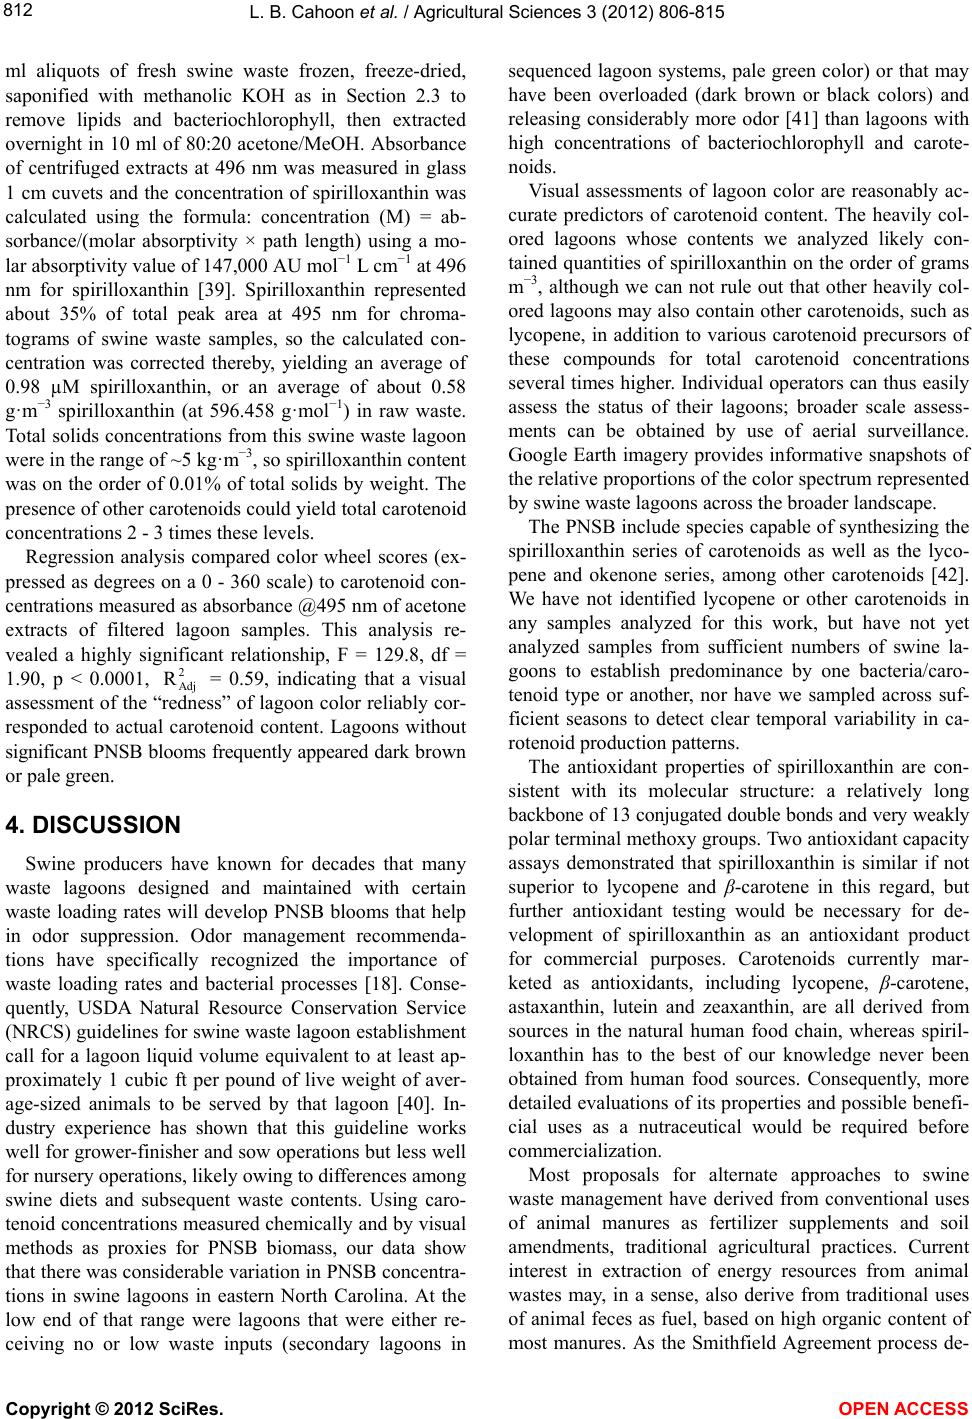 L. B. Cahoon et al. / Agricultural Sciences 3 (2012) 806-815 812 ml aliquots of fresh swine waste frozen, freeze-dried, saponified with methanolic KOH as in Section 2.3 to remove lipids and bacteriochlorophyll, then extracted overnight in 10 ml of 80:20 acetone/MeOH. Absorbance of centrifuged extracts at 496 nm was measured in glass 1 cm cuvets and the concentration of spirilloxanthin was calculated using the formula: concentration (M) = ab- sorbance/(molar absorptivity × path length) using a mo- lar absorptivity value of 147,000 AU mol−1 L cm−1 at 496 nm for spirilloxanthin [39]. Spirilloxanthin represented about 35% of total peak area at 495 nm for chroma- tograms of swine waste samples, so the calculated con- centration was corrected thereby, yielding an average of 0.98 µM spirilloxanthin, or an average of about 0.58 g·m−3 spirilloxanthin (at 596.458 g·mol−1) in raw waste. Total solids concentrations from this swine waste lagoon were in the range of ~5 kg·m−3, so spirilloxanthin content was on the order of 0.01% of total solids by weight. The presence of other carotenoids could yield total carotenoid concentrations 2 - 3 times these levels. Regression analysis compared color wheel scores (ex- pressed as degrees on a 0 - 360 scale) to carotenoid con- centrations measured as absorbance @495 nm of acetone extracts of filtered lagoon samples. This analysis re- vealed a highly significant relationship, F = 129.8, df = 1.90, p < 0.0001, = 0.59, indicating that a visual assessment of the “redness” of lagoon color reliably cor- responded to actual carotenoid content. Lagoons without significant PNSB blooms frequently appeared dark brown or pale green. 2 Adj R 4. DISCUSSION Swine producers have known for decades that many waste lagoons designed and maintained with certain waste loading rates will develop PNSB blooms that help in odor suppression. Odor management recommenda- tions have specifically recognized the importance of waste loading rates and bacterial processes [18]. Conse- quently, USDA Natural Resource Conservation Service (NRCS) guidelines for swine waste lagoon establishment call for a lagoon liquid volume equivalent to at least ap- proximately 1 cubic ft per pound of live weight of aver- age-sized animals to be served by that lagoon [40]. In- dustry experience has shown that this guideline works well for grower-finisher and sow operations but less well for nursery operations, likely owing to differences among swine diets and subsequent waste contents. Using caro- tenoid concentrations measured chemically and by visual methods as proxies for PNSB biomass, our data show that there was considerable variation in PNSB concentra- tions in swine lagoons in eastern North Carolina. At the low end of that range were lagoons that were either re- ceiving no or low waste inputs (secondary lagoons in sequenced lagoon systems, pale green color) or that may have been overloaded (dark brown or black colors) and releasing considerably more odor [41] than lagoons with high concentrations of bacteriochlorophyll and carote- noids. Visual assessments of lagoon color are reasonably ac- curate predictors of carotenoid content. The heavily col- ored lagoons whose contents we analyzed likely con- tained quantities of spirilloxanthin on the order of grams m−3, although we can not rule out that other heavily col- ored lagoons may also contain other carotenoids, such as lycopene, in addition to various carotenoid precursors of these compounds for total carotenoid concentrations several times higher. Individual operators can thus easily assess the status of their lagoons; broader scale assess- ments can be obtained by use of aerial surveillance. Google Earth imagery provides informative snapshots of the relative proportions of the color spectrum represented by swine waste lagoons across the broader landscape. The PNSB include species capable of synthesizing the spirilloxanthin series of carotenoids as well as the lyco- pene and okenone series, among other carotenoids [42]. We have not identified lycopene or other carotenoids in any samples analyzed for this work, but have not yet analyzed samples from sufficient numbers of swine la- goons to establish predominance by one bacteria/caro- tenoid type or another, nor have we sampled across suf- ficient seasons to detect clear temporal variability in ca- rotenoid production patterns. The antioxidant properties of spirilloxanthin are con- sistent with its molecular structure: a relatively long backbone of 13 conjugated double bonds and very weakly polar terminal methoxy groups. Two antioxidant capacity assays demonstrated that spirilloxanthin is similar if not superior to lycopene and β-carotene in this regard, but further antioxidant testing would be necessary for de- velopment of spirilloxanthin as an antioxidant product for commercial purposes. Carotenoids currently mar- keted as antioxidants, including lycopene, β-carotene, astaxanthin, lutein and zeaxanthin, are all derived from sources in the natural human food chain, whereas spiril- loxanthin has to the best of our knowledge never been obtained from human food sources. Consequently, more detailed evaluations of its properties and possible benefi- cial uses as a nutraceutical would be required before commercialization. Most proposals for alternate approaches to swine waste management have derived from conventional uses of animal manures as fertilizer supplements and soil amendments, traditional agricultural practices. Current interest in extraction of energy resources from animal wastes may, in a sense, also derive from traditional uses of animal feces as fuel, based on high organic content of most manures. As the Smithfield Agreement process de- Copyright © 2012 SciRes. OPEN ACCESS  L. B. Cahoon et al. / Agricultural Sciences 3 (2012) 806-815 813 termined in its final evaluation, however, most such ap- proaches are not economically feasible, as they cost more to implement than the conventional lagoon-spray field waste management system and do not yield products of sufficient value to offset those costs, particularly when transport costs are considered. The geographic concen- tration of swine waste production, e.g., predominantly in eastern North Carolina, creates a locally saturated market where the value of such products is low, while transport costs to markets at any distance would be considerable. The results of this research raise the possibility that commercially useful natural products may be obtained from swine waste lagoons, which may be viewed as large bioreactors. The full extent of the natural products that may be available from this source is yet to be determined, as are conditions and lagoon management practices that may support higher production of desirable products while performing waste treatment functions adequately. The full potential of swine waste as a source of microbial compounds thus remains to be explored. Clearly, further research is needed to address these questions. 5. ACKNOWLEDGEMENTS This research was supported by a Research Competitiveness Fund award from the University of North Carolina General Administration, by the North Carolina Pork Council, and by funds provided by UNC Wilmington. We thank the Duke Magnetic Resonance Spectroscopy Center, which is supported by the NSF, the NIH, HHMI, the North Carolina Biotechnology Center, and Duke University. We thank our Pender County collaborator for access to his swine waste lagoon, and Lynn Worley-Davis and cooperating swine producers for additional lagoon samples. We thank Nicholas Wilken and Alexander Amaya for technical assistance. REFERENCES [1] Schiffman, S.S., Bennett, J.L. and Raymer, J.H. (2001) Quantification of odors and odorants from swine opera- tions in North Carolina. Agricultural and Forest Meteor- ology, 108, 213-240. doi:10.1016/S0168-1923(01)00239-8 [2] Szogi, A.A., Vanotti, M.B. and Stansbery, A.E. (2006). Reduction of ammonia emissions from treated anaerobic swine lagoons. Trans Amer Soc Agri Biol Engin, 49, 217-225. [3] Harper, L.A., Weaver, K.H., Flesch, T.K., Wilson, J.D., Millner, P.D. and Ingram, D.T. (2005) Nitrogen and other trace-gas emissions from swine production in the central Great Basin. Final Report, USDA Agreement #58- 6612-3-234, 38 p. [4] Mallin, M.A. and Cahoon, L.B. (2003) Industrialized animal production—A major source of nutrient and mi- crobial pollution to aquatic ecosystems. Population and Environment, 24, 369-385. doi:10.1023/A:1023690824045 [5] Novak, J.M., Watts, D.W., Hunt, P.G. and Stone, K.C. (2000) Phosphorus movement through a coastal plain soil after a decade of intensive swine manure application. Journal of Environmental Quality, 29, 1310-1315. doi:10.2134/jeq2000.00472425002900040038x [6] Costanza, J.K., Marcinko, S.E., Goewert, A.E. and Mitchell, C.B. (2008) Potential geographic distribution of atmospheric nitrogen deposition from intensive livestock production in North Carolina, USA. Science of the Total Environment, 398, 76-86. doi:10.1016/j.scitotenv.2008.02.024 [7] Israel, D.W., Showers, W.J., Fountain, M. and Fountain, J. (2005) Nitrate movement in shallow ground water from swine-lagoon-effluent spray fields managed under current application regulations. Journal of Environmental Quality, 34, 1828-1842. doi:10.2134/jeq2004.0338 [8] Vanotti, M.B., Szogi, A.A., Hunt, P.G., Millner, P.D. and Humenik, F.J. (2007) Development of environmentally superior treatment system to replace anaerobic swine la- goons in the USA. Bioresource Technology, 98, 3184- 3194. doi:10.1016/j.biortech.2009.02.019 [9] Williams, C.M. (2009) Development of environmentally superior technologies in the US and policy. Bioresource Technology, 100, 5512-5518. doi:10.1016/j.biortech.2009.01.067 [10] Vanotti, M.B., Szogi, A.A., Millner, P.D. and Loughrin, J.H. (2009) Development of a second-generation envi- ronmentally superior technology for treatment of swine manure in the USA. Bioresource Technology, 100, 5406- 5416. doi:10.1016/j.biortech.2009.02.019 [11] Bernet, N. and Beline, F. (2009) Challenges and innova- tions on biological treatment of livestock effluents. Bio- resource Technology, 100, 5431-5436. doi:10.1016/j.biortech.2009.02.003 [12] Bortone, G. (2009) Integrated anaerobic/aerobic biologi- cal treatment for intensive swine production. Bioresource Technology, 100, 5424-5430. doi:10.1016/j.biortech.2008.12.005 [13] Kunz, A., Miele, M. and Steinmetz, R.L.R. (2009) Ad- vanced swine manure treatment and utilization in Brazil. Bioresource Technology, 100, 5485-5489. doi:10.1016/j.biortech.2008.10.039 [14] Cantrell, K.B., Ducey, T., Ro, K.S. and Hunt, P.G. (2008) Livestock waste-to-energy generation opportunities. Bio- resource Technology, 99, 7941-7953. doi:10.1016/j.biortech.2008.02.061 [15] General Assembly of North Carolina, Session 2007 Sen- ate Bill 1465. An act to 1) codify and make permanent the swine farm animal waste management system perform- ance standards that the general assembly enacted in 1998; 2) provide for the replacement of a lagoon that is an im- minent hazard; 3) assist farmers to voluntarily convert to innovative animal waste management systems; and 4) es- tablish the swine farm methane capture pilot program. http://www.ncleg.net/Sessions/2007/Bills/Senate/HTML/ S1465v7.html Last accessed 10/28/11 [16] Kronenberg, J. and Winkler, R. (2009) Wasted waste: An evolutionary perspective on industrial by-products. Eco- Copyright © 2012 SciRes. OPEN ACCESS  L. B. Cahoon et al. / Agricultural Sciences 3 (2012) 806-815 814 logical Economics, 68, 3026-3033. doi:10.1016/j.ecolecon.2009.07.006 [17] Cahoon, L.B. (2003) Intensive livestock production in North Carolina: Problems, progress and lessons. Pro- ceedings of the Manure Management Conference 2003, Agriculture, Food and Rural Development, Conservation and Development Branch, Edmonton, pp. 1-5 [18] Barker, J.C. (1978) Putting the lid on odor: II. Hog Farm Manage 15 June 1978. [19] Earle, J.F.K., Koopman, B. and Lincoln, E.P. (1984) Role of purple sulfur bacteria in swine waste reclamation. Ag- ricultural Wastes, 10, 297-312. doi:10.1016/0141-4607(84)90005-2 [20] Kim, M.K., Choi, K.-M., Yin, C.-R., Lee, K.-Y., Im, W.-T., Lim, J.H. and Lee, S.-T. (2004). Odorous swine wastewater treatment by purple non-sulfur bacteria, Rho- dopseudomonas palustris, isolated from eutrophicated ponds. Biotechnology Letters, 26, 819-822. doi:10.1023/B:BILE.0000025884.50198.67 [21] Imhoff, J.F. (1995) Taxonomy and physiology of photo- trophic purple bacteria and green sulfur bacteria. In: Blankenship, R.E., Madigan, M.T. and Bauer, C.E., Eds., Anoxygenic Photosynthetic Bacteria, Kluwer Academic Publishers, Dordrecht, 1-15. [22] Do, Y., Schmidt, T., Zahn, J., Boyd, E., de la Mora, A. and Dispirito, A. (2003) Role of Rhodobacter sp. strain PS9, a purple non-sulfur photosynthetic bacterium iso- lated from an anaerobic swine waste lagoon, in odor remediation. Applied and Environmental Microbiology, 69, 1710-1720. doi:10.1128/AEM.69.3.1710-1720.2003 [23] Sasaki, K., Watanabe, M., Suda, Y., Ishizuka, A. and Noparatnaraporn, N. (2005) Applications of photosyn- thetic bacteria for medical fields. Journal of Bioscience and Bioengineering, 100, 481-488. doi:10.1263/jbb.100.481 [24] Holt, J.G., Krieg, N.R., Sneath, P.H., Staley, J.T. and Wil- liams, S.T. (2003) Group 10 anoxygenic phototrophic bacteria. In: Williams, H.R., Ed., Bergey’s Manual of Determinative Bacteriology, Williams and Wilkins, Bal- timore, 353-364. [25] Chen, T., Schulte, D.D., Koelsch, R.K. and Parkhurst, A.M. (1994) Characteristics of phototrophic and non- phototrophic lagoons for swine waste. Transactions of the American Society of Agricultural Engineers, 46, 1285- 1292. [26] DiMascio, P., Kaiser, S. and Sies, H. (1989) Lycopene as the most efficient biological carotenoid singlet-oxygen quencher. Archives of Biochemistry and Biophysics, 274, 532-538. doi:10.1016/0003-9861(89)90467-0 [27] Larson, R.A. (1997) Naturally occurring antioxidants. Lewis Publishers, New York, 195 p. [28] De Leenheer, A.P. and Nelis, H.J. (1992) Profiling and quantitation of carotenoids by high-performance liquid chromatography and photodiode array detection. In: Packer, L., Ed., Carotenoids: Part A: Chemistry, Separa- tion, Quantitation, and Antioxidation. Methods in Enzy- mology, Vol. 213, 251-265. doi:10.1016/0076-6879(92)13126-I [29] Niedzwiedzki, D.M., Sandberg, D.J., Cong, H., Sandberg, M. and Gibson, G. (2009) Ultrafast time-resolved absorp- tion spectroscopy of geometric isomers of carotenoids. Chemical Physics, 357, 4-16. doi:10.1016/j.chemphys.2008.07.011 [30] Komori, M., Ghosh, R., Takaichi, S., Hu, Y. and Mizogu- chi, T. (1998). A null lesion in the rhodopin 3,4-desatu- rase of rhodospirillum rubrum unmasks a cryptic branch of the carotenoid biosynthetic pathway. Biochemistry, 37, 8987-8994. doi:10.1021/bi9730947 [31] Re, R., Pellegrini, N., Proteggente, A., Pannala, A., Yang, M. and Rice-Evans, C. (1998) Antioxidant activity ap- plying an improved ABTS radical cation decoloization assay. Free Radical Biology & Medicine, 26, 1231-1237. doi:10.1016/S0891-5849(98)00315-3 [32] Brand-Williams, W., Cuvelier, M.E. and Berset, C. (1995) Use of free radical method to evaluate antioxidant activity. Lebensmittel-Wissenschaft und-Technologie, 28, 25-30. doi:10.1016/S0023-6438(95)80008-5 [33] Britton, G., Liaaen-Jensen, S. and Pfander, H., Eds. (1995) Carotenoids. Spectroscopy, 1B, Birkhäuser Verlag, Bos- ton, 360 p. [34] Amann, R.I., Ludwig, W. and Schleifer, K.-H. (1995) Phylogenetic identification and in situ detection of indi- vidual microbial cells without cultivation. Microbiology Reviews, 59, 143-169. [35] Takaichi, S. and Shimada, K. (1992) Characterizations of carotenoids in photosynthetic bacteria. Methods in Enzy- mology, 213, 374-385. doi:10.1016/0076-6879(92)13139-O [36] Takaichi, S. (1993) Usefulness of field desorption mass spectrometry in determining molecular masses of carote- noids, natural carotenoid derivatives and their chemical derivatives. Organic Mass Spectrometry, 28, 785-788. doi:10.1002/oms.1210280711 [37] Lindal, T.-R. and Liaaen-Jensen, S. (1997) Bacterial ca- rotenoids 56. On the spirilloxanthin stereoisomeric set. Acta Chemica Scandinavica, 51, 1128-1131. doi:10.3891/acta.chem.scand.51-1128 [38] Qian, P., Mizoguchi, T., Fujii, R. and Hara, K. (2002) Conformation analysis of carotenoids in the purple bacte- rium Rhodobium marinum based on NMR spectroscopy and AM1 calculation. Journal of Chemical Information and Computer Sciences, 42, 1311-1319. doi:10.1021/ci0255230 [39] Agalidis, I., Mattioli, T. and Reiss-Husson, F. (1999) Spirilloxanthin is released by detergent from Rubrivivax gelatinosus reaction center as an aggregate with unusual spectral properties. Photosynthesis Research, 62, 31-42. doi:10.1023/A:1006384113191 [40] ASAE EP403.2 (1998) Design of anaerobic lagoons for animal waste management. In: ASAE STANDARDS, ASAE, St. Joseph, MI 49085-9659. [41] Zahn, J.A., Hatfield, J.L., Laird, D.A., Hart, T.T., Do, Y.S. and Dispirito, A.A. (2001). Functional classification of swine manure management systems based on effluent and Copyright © 2012 SciRes. OPEN ACCESS  L. B. Cahoon et al. / Agricultural Sciences 3 (2012) 806-815 Copyright © 2012 SciRes. OPEN ACCESS 815 gas emission characteristics. Journal of Environmental Quality, 30, 635-647. doi:10.2134/jeq2001.302635x [42] Bergey, D.H. and Holt, J.G. (1994) Anoxygenic photo- trophic bacteria, group10: Bergey’s manual of determina- tive microbiology. Lippincott Williams & Wilkins, Bal- timore, 353-376.
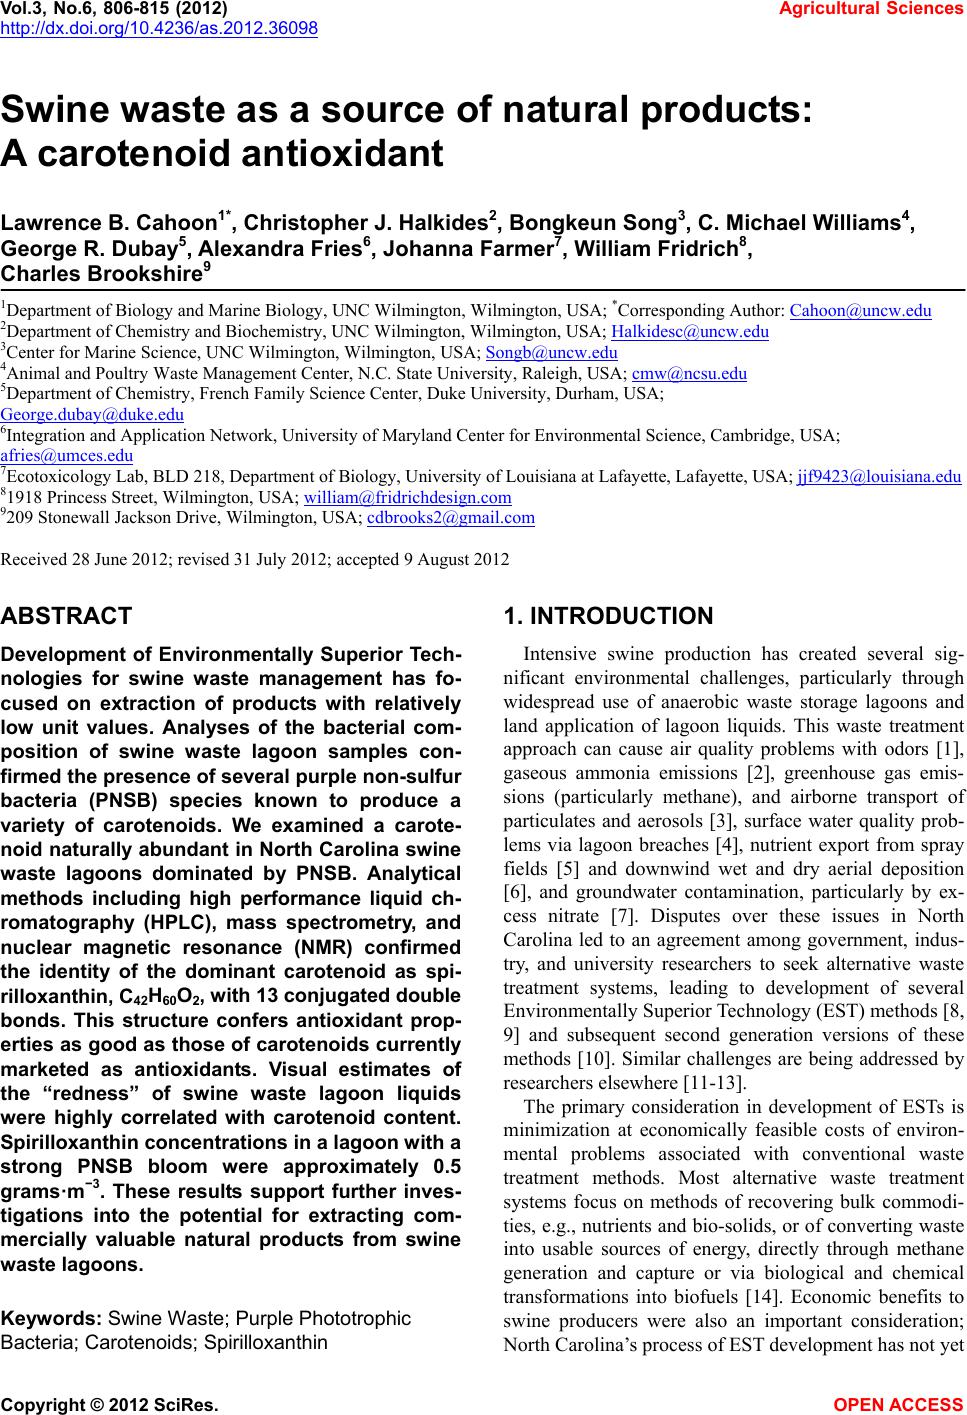
|