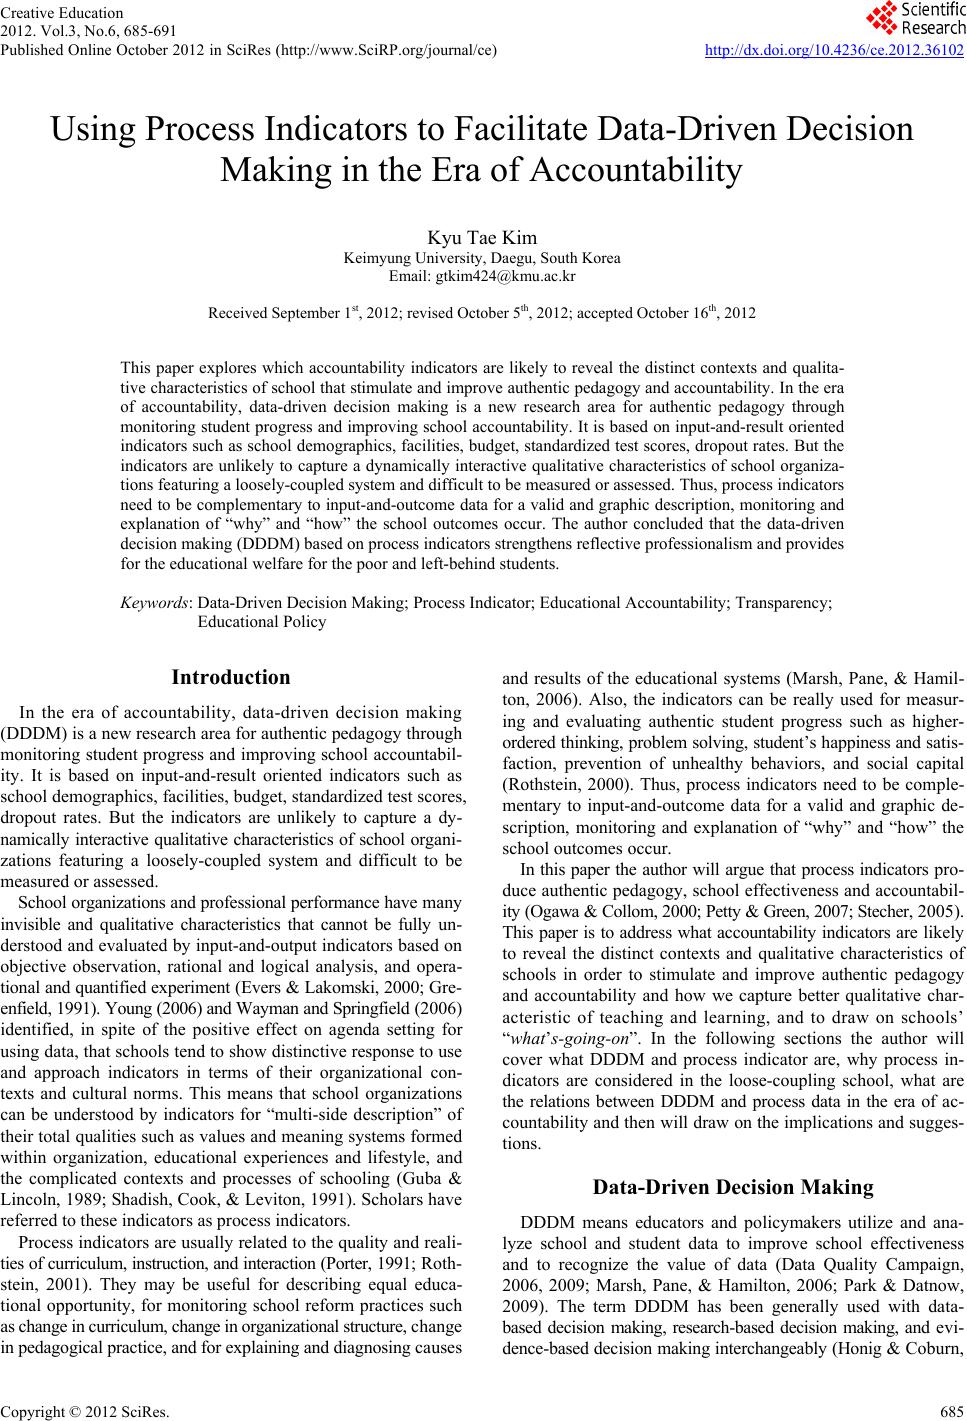
 Creative Education 2012. Vol.3, No.6, 685-691 Published Online October 2012 in SciRes (http://www.SciRP.org/journal/ce) http://dx.doi.org/10.4236/ce.2012.36102 Copyright © 2012 SciR e s . 685 Using Process Indicators to Facilitate Data-Driven Decision Making in the Era of Accountability Kyu Tae Kim Keimyung University, Daegu, South Korea Email: gtkim424@kmu.ac.kr Received September 1st, 2012; revised October 5th, 2012; accepted October 16th, 2012 This paper explores which accountability indicators are likely to reveal the distinct contexts and qualita- tive characteristics of school that stimulate and improve authentic pedagogy and accountability. In the era of accountability, data-driven decision making is a new research area for authentic pedagogy through monitoring student progress and improving school accountability. It is based on input-and-result oriented indicators such as school demographics, facilities, budget, standardized test scores, dropout rates. But the indicators are unlikely to capture a dynamically interactive qualitative characteristics of school organiza- tions featuring a loosely-coupled system and difficult to be measured or assessed. Thus, process indicators need to be complementary to input-and-outcome data for a valid and graphic description, monitoring and explanation of “why” and “how” the school outcomes occur. The author concluded that the data-driven decision making (DDDM) based on process indicators strengthens reflective professionalism and provides for the educational welfare for the poor and left-behind students. Keywords: Data-Driven Decision Making; Process Indicator; Educational Accountability; Transparency; Educational Policy Introduction In the era of accountability, data-driven decision making (DDDM) is a new research area for authentic pedagogy through monitoring student progress and improving school accountabil- ity. It is based on input-and-result oriented indicators such as school demographics, facilities, budget, standardized test scores, dropout rates. But the indicators are unlikely to capture a dy- namically interactive qualitative characteristics of school org ani- zations featuring a loosely-coupled system and difficult to be measured or assessed. School organizations a nd profe ssi onal perf ormanc e have m any invisible and qualitative characteristics that cannot be fully un- derstood and evaluated by input-and-output indicators based on objective observation, rational and logical analysis, and opera- tional and quantified experiment ( Evers & Lakomski, 2000; G re - enfield, 1991). Young (2006) and Wayman and Springfield (2006) identified, in spite of the positive effect on agenda setting for using data, that schools tend to show distinctive response to use and approach indicators in terms of their organizational con- texts and cultural norms. This means that school organizations can be understood by indicators for “multi-side description” of their total qualities such as values and meaning systems formed within organization, educational experiences and lifestyle, and the complicated contexts and processes of schooling (Guba & Lincoln, 1989; Shadish, Cook, & Leviton, 1991). Scholars have referred to these indicators as process indicators. Process indicators are usually related to the quality and reali- ties of cu rriculu m, instructi on, and i nteractio n (Porter, 1991; R o th - stein, 2001). They may be useful for describing equal educa- tional opportunity, for monitoring school reform practices such as change in curriculum, change in organizational structure, change in pedagogical practice, and for explaining and diagnosing causes and results of the educational systems (Marsh, Pane, & Hamil- ton, 2006). Also, the indicators can be really used for measur- ing and evaluating authentic student progress such as higher- ordered thinking, proble m solving, student ’s happiness and sat is - faction, prevention of unhealthy behaviors, and social capital (Rothstein, 2000). Thus, process indicators need to be comple- mentary to input-and-outcome data for a valid and graphic de- scription, monitoring and explanation of “why” and “how” the school outcomes occur. In this paper the author will argue that proce ss indicators pro- duce authentic pedagogy, school effectiveness and accountabil- ity (Ogawa & Collom, 2000; Petty & Green, 2007; Stecher, 2005). This paper is to address what accountability indicators are l ikely to reveal the distinct contexts and qualitative characteristics of schools in order to stimulate and improve authentic pedagogy and accountability and how we capture better qualitative char- acteristic of teaching and learning, and to draw on schools’ “what’s-going-on”. In the following sections the author will cover what DDDM and process indicator are, why process in- dicators are considered in the loose-coupling school, what are the relations between DDDM and process data in the era of ac- countability and then will draw on the implications and sugges- tions. Data-Driven Decision Making DDDM means educators and policymakers utilize and ana- lyze school and student data to improve school effectiveness and to recognize the value of data (Data Quality Campaign, 2006, 2009; Marsh, Pane, & Hamilton, 2006; Park & Datnow, 2009). The term DDDM has been generally used with data- based decision making, research-based decision making, and evi- dence-based decision making interchangeably (Honig & Coburn,  K. T. KIM 2008). According to Marsh, Pane and Hamilton (2006), DDDM means that schools “systematically collect and analyze various types of data, including input, process, outcome and satisfaction data, to guide a range of decisions to help improve the success of students and schools (p. 1)”. The multiple sorts of indicators include: input indicators such as school demographics of stu- dents and teachers, and expenditures; process indicators related to operation of curriculum and instruction; outcome indicators connected with dropout rates and student test scores; satisfac- tion data connected with opinions from teacher and students , etc. DDDM is a sphere of currently emergent research areas for monitoring student progress and school improvement, certify- ing educational problems and needs, and assessing program ef- fectiveness (Marsh, Pane, & Hamilton, 2006). DDDM is based on accountability indicators which refer to comprehensive sta- tistical information linked to generate and utilize the accurate information of process and performance on complex school or- ganization (Gaither, 1995; Shavelson et al., 1991). The current accountability indicators are composed of quantitative input- and-result oriented indicators such as standardized test score, dropout rates, graduation rates, and so on. They, intrinsically, may be designed to promoting the equality of educational result through the advancement of student learning and the enhance- ment of professionalism for taking care of the poor and left- behind students (Anderson, 2009). It is evident that account- ability policy can strikingly close the achievement gaps among students by paying attention to the reading and math standard and high-qualified teachers (Jones, 2007). However, school organization has both a tightly-coupled and a loosely-co upled perspective (H oy & Miskel, 2012). The t igh tl y- coupled frame highlights centralized control, coordination by written rules, vertical communication, hierarchy, supervision, compliance, efficiency, and extrinsic incentive (Firestone & H er - riott, 1982). Meanwhile, school organization is a professional organization, which provides an operational core for schooling. Also it is a loosely-coupled system in that schools can be con- ceptualized as “differentiated organizations”, or “culturally heterogeneous organizations”, which means that they have internally complex and distinctive cognitive and emotional strategies (Lima, 2007; Weick, 1976). Therefore a school is a loosely-coupled lens focused on professional organization ori- ented to educators’ professional knowledge and judgment (Dar- ling-Hammond, 1989; Day, 2002; Skyes, 1999). In this respect, school organizations are likely to interact dynamically with a variety of individual and group-level contextual factors. As Greenfield (1986) indicated, a school’s organization should be understood as “an object of understanding” (p. 72). In spite of the loosely-coupled image, as Hoy and Miskel (2012) said, the demands for accountability may make school organization more formalization, more centralization, less pro- fessionalization. The tightly coupled policy has been influenced by the government’s increasing involvement in schooling (Reyes, Wagstaff, & Fusarelli, 1999). Current educational policy was designed to improve education through “a tightly-coupled DDDM based on higher standards, testing, and accountability (Fusarelli, 2002). However, teachers mostly have worked in solitary class- rooms where they are not easily evaluated by colleagues or supervisors (Hargreaves & Goodson, 1996). Firestone and Her- riott (1982) indicated “in schools, the actual work of bringing students in contact with what is taught is done by teachers who have considerable discretion. In effect, a major portion of the school’s central purpose cannot be controlled by the adminis- trative cadre.” (p. 44) Put differently, teachers are educational critics that distinguish and evaluate their works and students’ needs in their own way within specific contexts (E isner, 2002). In an era of strict demand of accountability, top-down accou nt- ability policy is focused on students’ academic performance. However, it may need to be balanced with teacher-centered i ndi - cators focused on the active involvement of professionals and the mutual collaboration of practitioners (O’Day, 2002). O’Day (2002) indicated the importance of the rich generation, valid interpretation, and relevant circulation of information and data among accountability players because the conflicts result from the miscommunication between administrators and profession- als who have different accountability views: administrators fo- cused on students’ academic performance by state’s high-stakes test such as reading and math score, attendance rate, and gradu- ate rate; however, professionals put an emphasis on educators’ professional knowledge and judgment according to peer review and sanction (Adams & Kirst, 1999). In this respect, she argues that well-informed data catalyze as a medium of communica- tion between both sides. As O’Day (2002) indicated, the rich generation, valid inter- pretation, and relevant circulation of the proper data and infor- mation related to school reality are likely to contribute to being successful for organizational capacity and improvement. The data and information should be related to generating and focusing on information relevant to teaching and learning and to changes for the continual “calibration” and “feedback” (Honig & Coburn, 2008). They are likely to motivate educators and others to at- tend to relevant information and to expand the effort necessary to augment or change strategies in response to this information (Wayman & Springfield, 2006). Furthermore, they are able to develop the knowledge and skills to promote valid interpreta- tion of information and appropriate attribution of causality at both the individual and system levels (Wayman, Stringfield, & Yakimowski, 2004). Because the teacher-based indicators are dependent on an acquired and processed indicators by teachers who in a actual context have a sense of the operational situa- tions, problems and alternatives for enhancing school improve- ment and effectiveness (Marsh, Pane, & Hamilton, 2006). In t his vein, it is reasonable for DDDM to be based on not input-and- outcome-based indicators but pr o cess indicator s that can des cribe “contexts” and explain “causes”, in that “a snapshot of school practice is not sufficient; assessment of change is needed” (Porter, 1991: p. 15). Young (2006) and Wayman and Stringfield (2006) identified that schools show distinctive respon ses to use and approach dat a in terms of their organizational contexts and cultural norms. DDDM needs to be based on the flexible and diverse process indicators used to provide timely diagnostic information of im- provement, to capture a better qualitative characteristic of teach- ing and learning, to explain “whys” when students and schools don’t reach the standard and to provide which sup port to sc hools (Ogawa & Collom, 2000). In this respect, process indicators can be linked to substantive instruction support and curriculum provisions by calibrating through a productive and reflective “test talk” or “communication” with stakeholders (Petty & Gre e n, 2007; Stecher, 2005). By using process indicators, school-level working condition or district-level agenda setting can be related to establishing collaborative works and learning norms and cli- mate by helping to understand everyday instruction-related pra c- tices within the contexts and by helping find how to align and arrange district-driven policies with their contexts and change Copyright © 2012 SciRe s. 686  K. T. KIM endeavors (Young, 2006). Scholars suggested four types of indicators, context, input, process, and product for the decision making in terms of ac- countability (Stufflebeam, 2001; Stufflebeam & Shinkfield, 2007). In terms of context indicato rs, it would be the students’ ach ieve - ment level which needed to be improved, instructional and per- sonal barriers to study in classroom, students’ absence and drop - out rate, etc. It could be referred as input indicators: school budget and resources and time invested to solve the school problem in order to achieve educational goal, and so on. It would be con- sidered degree of the relationship and understanding between students and teachers, adequacy of time schedule, teaching activities, and school resources as process indicators. It may be thought of the output on whether learner achieved learning ob- jects and the indicators which is related to the output such as parents and students satisfaction in terms of product indicators. DDDM is based on contextual factors or school cultural and institutional factors: data quality, calibration, principal leader- ship, faculty involvement, educator collaboration, and other in- stitutional supports. First, data quality is related to keeping h igh- quality, accurate data, and an accurate and quality database. It provides the following information for educators and policy mak- ers: what programs have been provided to students and how students completed the programs, how the test result has been improved, and what teachers have used an adequate teaching method for improving student achievement by a school year. Second, calibration defined as collective reflectivity or delib- eration is combined with how educators define indicator use, how teaching conduct under these definitions, how they assess student learning, and how they react to results (Young, 2006; Wayman & Stringfield, 2006). Third, principal leadership is connected with principals’ investment and support for the use of data system. The existing research recognizes a role of prin- cipal as one of the critical factors to improve school manage- ment and student achievement (e.g., Copland, 2003). Principal is also considered as an important player in the data use (Cop- land, 2003; Marsh, Pane, & Hamilton, 2006). However, school leadership needs to be focused on distributed leadership, being stret ched over more broadly and distributed beyond individuals because the role of school principals for DDDM is limited (Copland, 2003; Park & Datnow, 2009). Fourth, faculty in- volvement has to do with teachers’ engagement and interest to the data generation, use and application for their classroom and sc hoo l pr o gra m. Acc o rd in g to Mars h , Pa ne a nd Hami lt o n (2006: p. 8), factors to promote the data use depend on accountability policies and intrinsic motivation: Federal, state, and local ac- countability policies such as incentives and pressure to use data; the internal desire of teachers to make better use of data. Fifth, collaboration is consistent with educators’ data sharing and co-using (Marsh, Pane, & Hamilton, 2006). Collaboration for DDDM in the level of school is closely related with organiza- tional culture and school leadership (Marsh, Pane, & Hamilton, 2006). Finally, institutional supports are coupled with the edu- cation authorities provide deeper and continuous professional development, establish a friendly data warehouse, and give teachers sufficient time to access and examine data (Stecher, Hamilton, & Gonzales, 2003). Based on the above discussions, as Figure 1 shows, we will elaborate on how five elements are correlated with DDDM. DDDM is divided into two parts: three basic elements and two cultural catalysts. Three basic factors are “who makes use of indicators or data for what”, referring to data or indicator, gen- Figure 1. The conceptual structure of DDDM. erating or supporting users, and calibration. Data/indicator is a connecting factor between users-generating or supporting users. Generating users are a principal, a school faculty or a school data team for exploring the problems and alternatives for school improvements and accountability in terms of school results and “what’s-going-on” through calibration. Administrative staffs, who establish database system, computer software or data ware- house, support DDDM by providing professional development program in order to collect, monitor, use, and interpret indicators of schools’ contexts, processes and results through calibration or collective thinking process for authentic pedagogy, ac- co u nta bility, and school effectiveness. Catalysts are embedded in the calibration meaning collectiv el y cognitive inquiry through the interaction between users. Cop- land (2003) pointed out that capacity building and school im- provement would bring from collective cognitive processes thr- ough organizational learning and distributed cognition (Spillane, 2006; Spillane et al., 2004). According to Spillane (2006), dis- tributed cognition works in a situation composed of routines, tools, structures, and instituti ons. A routine includes regular pr o- cedures and committee for determining activities to achieve school and team activities. A tool encompasses from the documents regarding student’s achievement to protocol (Spillane, 2006). A structure is related to a form of institution such as class teach- ers’ and regular teachers’ meeting, team structure within school organization, and committee and spontaneous forms regarding temporary team (Woods, Benett, Harver, & Wise, 2004). An institution includes vision, goal, and regulations of school or- ganization (Harris, 2008). These make a difference in that each school has a discrete calibration; so it has a distinctive mode and characteristic of leadership, collaboration, and involvement for DDDM. Therefore, the catalysts are embedded in the school situation and in each situation they are emergent for DDDM. Put differ- ently, these facilitating factors are derived from the calibration nested in interaction between users. As discussed earlier, Young (2006) and Wayman and Springfield (2006) proved that schools tend to show distinct indicator use and approach in the context of their organizational cultural features. In this respect, the cul- tural catalysts, referring to distributed leadership, collaboration and involvement, have a significant effect on “how or under what conditions users put to use indicators” in terms of leader- ship, climate and culture within a school or across schools. Process Indicators: An Essential Component Process indicators may effectively provide organizational and instructional information for describing how school has been Copyright © 2012 SciRe s . 687  K. T. KIM identifying which factors of school process and context effect on better achievement and instruction, for explaining why and how school succeed or fail, and for monitoring how to meet, implement and respond to policy agenda (Porter, 1991). Process indicators are likely to have strong effect on organizational learn- ing through collaborative inquiry and shared expertise and ex- perience among colleagues (Honig & Coburn, 2008; Knapp, 2008; Valli & Buese, 2007). Porter (1991) divided process indi- cators into two categories: organizational and instructional data. The first is composed of policies, programs, cultures, structures, and leadership at the level of school, district, state, and nation. The latter is related to curriculum content and quality, teaching quality and pedagogy methods, instructional resources, instruc- tional team, teaching planning time, and school effectiveness indicators. Oakes (1990) argued that process indicators are a necessary condition in terms of school context and organization, curriculum qua lity, t eachi ng quality , and i nstruc tional quality : 1) How safe, clean, and adequate are school facilities? 2) What kind of classroom discipline is there and what is the climate for learning? 3) What process is there toward reducing class sizes and teaching loads? 4) What is the quality and currency of textbooks and other instructional matters? 5) How many teach- ers are assigned outside their subject areas of competence? 6) How adequate are teacher evaluations and opportunities for pro- fessional improvement? 7) What is the equality of instruction and leadership? In this respect, the author will define process indicator as the data to describe, explain, and predict the local practice, that is, what’s-going-on and the quality of the core technologies of schooling such as curriculum, instruction, learning, and social interaction working within a school. An example for using process data under current account- ability system may be Data Quality Campaign (DQC). DQC is the state-level partnership endeavoring to help all stakeholders to be available to a high-quality data and to provide appropriate advice and support (DQC, 2009). DQC focused on individual students’ longitudinal data over time in order to increasingly ameliorate teacher and teacher quality (Berry, Fuller, Reeves, & Laird, 2006) and to continually stimulate school and district im- provement (Laird, 2006). DQC suggests that accountability indi - cators will need to be added the following ten vital factors: 1) A unique statewide student identifier; 2) Student-level enrollment, demographic and program participation information ; 3) The a bi l- ity to match individual students’ test records from year to year to measure academic growth; 4) Information on untested stu- dents; 5) A teacher identifier system with the ability to match teachers to students; 6) Student-level transcript information, including information on courses completed and grades earned; 7) Student-level college readiness test scores; 8) Student-level graduation and dropout data; 9) The ability to match student records between the P-12 and postsecondary systems; and 10) a state data audit system assessing data quality, validity and reli- ability (DQC, 2006: p. 5). These elements contribute to comparing the instructional and operational realities within or across schools and districts (DQC, 2006), assessing performance standards and program effective- ness (Laird, 2006), and drawing on how teachers affect learning and improve students’ achievement by linking students’ indi- vidual information with teachers’ instructional practices and professional development (DQC, 2009). They also can enhance educational equality by identifying and making up for the dif- ference of the teacher effectiveness and the working conditions of schools in low-income or affluent areas (Berry et al., 2006). Additionally, they can provide state policy makers with diverse information of each school confronting the distinctive problems and issues for student success and give a school tailored and efficient resources and advice (Laird, 2006). Using Process Indicators for Facilitating DDDM As far as the abovementioned information is concerned, it is appropriate to use process indicators related to describing how school has been/is going on, what factors of school process and context are effecting on “better” pedagogy, how schools resp on d to policy agenda (Porter, 1991). In this respect, outcome-based indicator system needs to be balanced with process indicators that can describe “contexts” and explain “causes”, because “a snapshot of school practice is not sufficient; assessment of change is needed (p. 15)”, as Porter (1991) says. Process indi- cators can describe, explain, and explore the school’s needs and practices. The output-based data under the current accountabil- ity are not likely to reveal and measure not only the dynamic contexts and qualitative characteristics of school but also the qualitative and formative results of schooling such as higher- thinking skills, quality of instruction, and student interest of reading itself (Linn, 2001). Process indicators can stimulate data-based leadership (Way- man, Cho, & Johnston, 2007) because they give live descrip- tions of “what’s going on” and student’s real needs, and also identify barriers to use data for instructional improvement, and explain the causes of failures and draw on alternatives for im- provement (Opper, Henry, & Mashburn, 2008). Data-driven l ead - ership may be a key medium of connection for building capac- ity among educators (Copland, 2003). Young (2006) argued that principals mediate actual use of data by teachers. Wayman and Stringfield (2006) asserted that professional development must equip teachers to be independent users of data in the ser- vice of instructional planning. Process indicators can lead district and school leaders to ad- vocate a supportive and collaborative data use culture (Wayman, Cho, & Johnston, 2007; Young, 2006) in order to encourage their teachers and staffs to access and use data, to reflect on their instructions, and to distribute and share school leadership. According to Lachat and Smith (2005), the school-level data use result in creating “collective leadership” and “data-based team”. In this respect, data use acts as the redesign of school structure and leadership. Copland (2003) pointed out that distri buted le ad- ership based on data use contributes to sharing responsibility and collaborative work condition, drawing on each leader’ own expertise and experience for enhancing school effectiveness and upgrading school organizational capacity. Distributed leadership focuses on the leader-plus through the interaction of leader and followers in the situation, the sharing of professional expertise and experience through collective leadership for organizational effectiveness and accountability (Harris, 2008). Process indicators may increase reflective professionalism based on peer reviews, collaborative team activities, and shared information by fitting for educators’ identity and professional- ism (Loeb, Knapp, & Elfers, 2008; Valli & Buese, 2007). S chö n (1983) saw professionals as “reflectors in action,” emphasizing contextual and situational reflection in action when they make a decision according to continually updated contextual knowl- edge. Spillane (2004) found that implementers have their own interpretative frames of what they should do and their own Copyright © 2012 SciRe s. 688  K. T. KIM preferences of what is the most important for their working. In this respect, process indicators are likely to combine with “data- based reflectivity and deliberation” through a productive “test talk” or “communication” with teachers (Lachat & Smith, 2005). Process indicators tend to lead to organizational learning through collaborative inquiry and shared expertise and experience among colleagues (Honig & Coburn, 2008; Knapp, 2008). This “col- laborative inquiry” helps teachers deliver from teachers’ indi- vidualism caused by a loosely-coupled organization and to flow relevant information into a separate room of teachers (Valli & Buese, 2007). Process indicators can be really used for measuring and eval u- ating authentic student progress such as higher-ordered thinking, problem solving, student’s happiness and satisfaction, preven- tion of unhealthy behaviors, and social capital. Process indica- tors are considerably consistent with micro tasks such as the information of teachers’ and students’ day-to-day interactions, realities and lives. The Information is to an acquired and proc- essed data set from schools and teachers in order to facilitate data-based decision-making for enhancing authentic pedagogy and reflective professionalism for school improvement and effec- tiveness (Marsh, Pane, & Hamilton, 2006). In spite of these bright sides, there are several limitations needed to be considered in introducing process indicators into classrooms and schools. The first consideration is that process indicators are oriented to formative self-evaluation focusing on identifying and treating educational progress during the student learning or the school operation process; so, it is hard to gauge a school’s success or failure and to make teachers and schools districted from their attainment of standards and goals. Second, it is indispensible for teachers and schools to make use and interpret process indicators regularly and daily and maintain the updated data warehouse frequently. It forces them to do too much additional work apart from their instruction and resource preparations (Valli & Buese, 2007). This may result in the increase and expansion of teachers’ roles such as data pr epa- ration, interpretation, and reporting; so, teachers may invest the ir more time on data use and input more than instructional i mpr ov e- ment and provisi on of resources to students (Wayman & Stri ng- field, 2006). Third, specific perils which too much focus on data genera- tion and use can cause serious work stress and depression and lead teachers to dampen student interest and deemphasize stu- dents’ authentic pedagogy and narrowed curriculum dedicating to data preparation and provision instead of substantial amounts of instructional time (Jones, 2007; Popham, 2001; Sheldon & Biddle, 1998). Fourth, process indicators are inefficient and infeasible be- cause they related to a complicated and delicate cases and reali- ties; they are required for teachers’ long-term work time and effort; they cannot set up the standard indicator system in order to get the standard data from a distinctive school. Fifth, process indicators are too subjective and individualistic to secure validity, reliability and objectivity for identifying a school’s and a district’s summative performance and for inte- grating the data derived from an individual school in the state or national level. Sixth, it is necessary for teachers and schools to have the professional expertise and know-how about generating, using, and interpreting of process indicators within a school or across schools. However, most teachers do not understand data use and DDDM (Loeb, Knapp, & Elfers, 2008; Valli & Buese, 2007). Implications and Conclusion Process indicators enable schools and teachers to scientifi- cally make decisions for fit-for-all instructional strategies and high-quality professional development (Opper, Henry, & Mash- burn, 2008), to provide differentiated instruction (Valli & Bue se, 2007), to increase organizational learning; (Honig & Coburn, 2008), to calibrate their “what’s going on” and to stimulate collaborative or collective learning (Copland, 2003; Lachat & Smith, 2005). Process data may be required to a new principal leadership that can not only lead teachers to generate and use data and build data-use culture for their instructional improvement and school accountability. However, result-based accountability rev- ealed the limitation in that the heroic leadership may fail to draw on the teachers’ active involvement and the mutual col- laboration of practitioners with school leaders because of lim- ited information flow and sharing, one-way communication, centralization of role and responsibility to one leader (Copland, 2003; Harris, 2008). Distributed leadership puts an emphasis on the fact that there are multiple leaders, multiple followers and situations and that leadership activities are “widel y shared w it hi n and between organizations” (Harris, 2008: p. 12). Distributed leadership is able to facilitate teacher’s motivation for sharing, co-performance and collective responsibility for school improve- ment and accountability. If principal leadership is stretched out to teachers, teachers may play a active role in shaping the cul- ture of their schools, improving student learning, and influenc- ing practices among their pee rs b y becoming a resource provid er, an instructional speci alist, a c urricul um speciali st, a learni ng fac ili- tator, a me ntor, a sc hool leader, a data c oach, a cataly st for ch an ge and a learner (Cindy & Joellen, 2007). Accountability policies are designed to promote the equality of educational results by taking care of poor and left-behind students. Howev er, the input-and- output based accountability h a s resulted in the heated discussion of equality versus excellence. Proponents of educational equality, a teacher union and liberal interest group, worried that the policies would further polarize educational opportunity along class lines and family backg round and that i t would have a p ern icio us l abe ling ef fec t among schools. The advocates of educational excellence, government and con- servative interest grou ps, tried to push through the scho ol cho ice policy by increasing competition among schools and by pro- moting test score publication. These conflicts are due to lack of the deep consideration and discourse for jumping into the per- spective and interest of each stakeholder. Put another way, the conflicts come from a lack of the data- based deliberation and collective inquiry process. In this case, it is not likely to facilitate “non-self-interested motivation” for increasing self-sacrifice and public good through “deliberation democracy” based on the deliberative communication, altruism and cooperation in a public sector (Habermas, 1996; Mansbridge, 1990). Ranson (2003) indicated that it is necessary that players of school accountability recognize a conflicting plurality and contestation and reach a mutual understanding about the mean- ings, purposes, perspective, and practices of school organization under open discussion and discourse processes. This reflective deliberation, fundamentally, results in the stimulation of a col- lective learning process and the formation of a professional com- munity (Louis, Kruse, & Raywid, 1996). In this vein, process data can be a key medium of connecting between proponents and opponents. It is not easy to reconcile the conflicting per- spectives of both sides without considering what’s-going-on data. Copyright © 2012 SciRe s . 689  K. T. KIM The process data can identify how poor students are learning higher order thinking and problem solving ability when com- paring with affluent family’s children, and how teachers have high expectation of learning to all and how class activities en- hance their emotional and social development (Ogawa & Col- lom, 2000; Porter, 1991). Also the process data can check what factors have had a signi ficant effect on stimulating critical thi nk- ing, conceptual learning and intrinsic interest in the subject ma t- ter, and desire to pursue future education (Jones, 2007; Popham, 2001; Sheldon & Biddle, 1998). Furthermore, the process can pay attention to how and what make low-performing schools and poverty students have been improved their progress. In this respect, process data can promote Anderson (2009)’s “advo- cacy leadership” emphasizing students’ whole-being growth and all-round education by holding the following belief and prac- ticality: An advocacy leader believes in the basic principles of a high quality and equitable public education for all childr en and is willing to take risks to make it happen… They use multiple forms of data to monitor the progress of students and programs. Testing data are used diagnostically, but not allowed to distort curriculum and instruction… (p. 9). Process data is intrinsically required to internal accountabil- ity in that the data put an emphasis on collective inquiry and collaborative responsibility (Kim, 2010). Newmann, King and Ridgon (1997) found that school performance can be improved by internal accountability rather than external accountability in that it can facilitate self-producing organizational capacity by stimulating relevant utilization of professional knowledge and skills by sharing of objectives among stakeholders, and by es- tablishing a cooperative system. Also, Abelmann and Elmore (1999) researched how schools conducted their own account- ability mechanisms: 1) Putting emphasis on individual or pro- fessional accountability rather than administrative accountabil- ity; 2) Pointing to internal accountability through collective expectation and mutual control; and 3) Focusing on the strong leadership of principals and the internalization of accountability. In this respect, process indicator use must be conducted to fa- cilitate organizational learning through which a dministrators an d professionals can explore and share school problems and per- formance together in order to overcome the teacher individual- ism caused by a loosely-coupled organization and to flow rele- vant information into a separate room of teachers. Organization a l learning makes administrators enter into the loosely-coupled school; on the contrary, it makes teachers open their closed wi n- dow toward the external world and its changes. Therefore, as Darling-Hammond and Bal l (1999) indicated, accounta bility pr ac - tices must point to facilitate collective learning through open and deliberate dialogues and discussions between administrators and professionals to understand mutual perspectives and realties. In the context of accountability, DDDM is a crucial driving force for school accountability and improvement. The success- ful implementation of DDDM within a school and between schools and local educational agencies are dependent on what indicators are stressed on. If DDDM is linked to input-and-output indicators, it is difficult to make sense of schools’ processes a nd realities, draw on the best practices, figure out students’ actual progress, and facilitate new culture creation and collective in- quiry or organization. As a result, authentic pedagogy cannot be realized because it is combined with intensifying reflective pro- fessionalism and caring for the educational welfare for the poor and left-behind students. It undoubtedly comes from process indicators. REFERENCES Abelmann, C., & Elmore, R. (1999). When accountability knocks, will anyone answer? Consortium for Policy Research in Education, ERIC ED 428463. Adams, J. E., & Kirst, M. (1999). New demands for educational ac- countability: Striving for results in an era of excellence. In J. Murphy, & K. S. Louis (Eds.), Handbook of research in educational admini- stration (pp. 463-489, 2nd ed.). San Francisco: Jossey-Bass. Anderson, G. L. (2009). Advocacy leadership: Toward a post-reform agenda in education. New York: Routledge. Berry, B., Fuller, E., Reeves, C., & Laird, E. (2006b). Linking teachers and student data to improve teacher and teaching quality. URL (last checked 18 March 2010). http://www.dataqualitycampaign.com. Cindy, H., & Joellen, K. (2007). Ten roles for teacher leaders. Educa- tional Leadership, 65, 74-77. Copland, M. A. (2003). Leadership of inquiry: Building and sustaining capacity for school improvement. Educational Evaluation and Policy Analysis, 25, 375-395. doi:10.3102/01623737025004375 Darling-Hammond, L. (1989). Accountability for professional practice. Teachers college Record, 91, 59-80. Darling-Hammond, L., & Ball, D. L. (1999). What can policy do to support teaching to high standards? CPRE Policy Bulletin. URL (last checked 30 June 2008). http://www.cpre.org/Publications/Publications_Policy_Bulletins.htm Data Quality Campaign (2006). Creating a longitudinal data system: Using data to improve student achievement. URL (last checked18 March 2012). http://www.dataqualitycampaign.com Data Quality Campaign (2009). The next step: Using longitudinal data systems to improve student success. URL (last checked18 March 2010). http://www.dataqualitycampaign.com Day, C. (2002). School reform and transition in teacher professionalism and identity. International Journal of Educational Research, 37, 667- 692. doi:10.1016/S0883-0355(03)00065-X Eisner, E. W. (2002). The educational imagination: On the design and evaluation of school programs (3rd ed.). Upper Saddle River, NJ: Merrill Prentice Hall. Evers, C. W., & Lakomski, G. (2000). Doing educational administra- tion: A theory of administrative practice. New York: Pergamon. Firestone, W. A., & Herriott, R. E. (1982). Two images of schools as organizations: An explication and illustrative empirical test. Educa- tional Administrative Quarterly, 18, 39-59. doi:10.1177/0013161X82018002004 Fusarelli, L. D. (2002). Tightly coupled policy in loosely coupled sys- tems: Institutional capacity and organizational change. Journal of Educational Admini st r at i o n, 40, 561-575. doi:10.1108/09578230210446045 Gaither, G., Nedwek, B. P., & Neal, J. E. (1995). Measuring up: The promises and pitfalls of performance indicators in higher education. ASHE-ERIC Higher Education Report No 5. ERIC ED 383278. Greenfield, T. B. (1986). The decline and fall of science in educational administration. Interchange, 17, 57-80. doi:10.1007/BF01807469 Greenfield, T. B. (1991). Reforming and revaluing educational admini- stration: Whence and when cometh the phoenix? Educational Man- agement and Administration, 19, 200-217. Guba, E. G. & Lincoln, Y. S. (1989). Fourth generation evaluation. London: Sage Publ i cations. Habermas, J. (1996). Three normative models of democracy. In S. Benhabib (Ed.), Democracy and Difference: Contesting the Bounda- ries of the Political. Princeton: Princeton University Press. Hargreave, A., & Goodson, I. F. (1996). Teachers’ professional lives: Aspirations and actualities. In I. F. Goodson, & A. Hargreaves (Eds.), Teachers professional lives (pp. 1 -27). London: Farmer Press. Harris, A. (2008). Distributed school leadership: Developing tomor- row’s leaders. New York: Routledge. Honig, M. J., & Coburn, C. (2008). Evidence-based decision making in Copyright © 2012 SciRe s. 690  K. T. KIM Copyright © 2012 SciRe s . 691 school district central offices: Toward a policy and research agenda. Educational Policy, 22, 578-608. doi:10.1177/0895904807307067 Hoy, W. K., & Miskel, C. G. (2012). Educational administration: The- ory, research, and p ractice (9th ed.). McGrow-Hill: New York. Jones, B. D. (2007). The unintended outcomes of high-stakes testing. Journal of Applied Schoo l Psychology, 23, 65-86. doi:10.1300/J370v23n02_05 Knapp, M. S. (2008). How can organizational and sociocultural learn- ing theories shed light on district instructional reform? American Journal of Education, 114, 521-539. doi:10.1086/589313 Lachat, M. A., & Smith, S. (2005). Practices that support data use in urban high schools. Journal of Education for Students Placed at Risk, 10, 333-349. doi:10.1207/s15327671espr1003_7 Laird, E. (2006b). Data use drives schools and district improvement. URL (last checked 18 March 2 0 10). http://www.dataqualitycampaign.com Lima, J. A. (2007). Teachers’ professional development in departmen- talised, loosely coupled organisations: Lessons for school improve- ment from a case study of two curriculum department. School Effec- tiveness and School Improvement, 18, 273-301. doi:10.1080/09243450701434156 Linn, R. L. (2001). The design and evaluation of educational assess- ment and accountability. CSE Technical Reprot 539. National Center for Research on Evaluation, Standard, a nd S t u d e n t Testing. Loeb, H., Knapp, M. S., & Efers, A. (2008). Teachers’ response to standards-based reform: Probing reform assumptions in Washington State. Educational Policy Analysis Archives, 16, 1-32. Louis, K. S., Kruse, S., & Raywid, M. A. (1996). Putting teachers at the center of reform: Learning schools and professional community. NASSP Bulletin, 80, 9-21. doi:10.1177/019263659608058003 Mansbridge, J. (1990). The rise and fall of self-interest in the explana- tion of political life. In Mansbridge (Ed.), Beyond self-interest. Chi- cago: University of Chicago Press. Marsh, J. A., Pane, J. F., & Hamilton, L. S. (2006). Making sense of data-driven decision making in education: Evidence from recent RAND research. Santa Monica, CA: RAND Corporation. URL (last checked 28 Novem ber 200 9). http://www.rand.org/pubs/occasional_papers/OP170/ Newmann, F. M., King, M. B., & Rigdon, M. (1997). Accountability and school performance: Implications from restructuring schools. Harvard Educational Review, 67, 41-74. Oakes, J. (1989). What educational indicators? The case for assessing the school context. Educational Evaluation and Policy Analysis, 11, 181-199. O’Day, J. A. (2002). Complexity, accountability, and school Improve- ment. Harvard Educational Review, 72. Ogawa, R. T., & Collom, E. (2000). Using performance indicators to hold schools accountable: Implicit assumptions and inherent tensions. Peobody Journal of Education, 75, 200-215. doi:10.1207/S15327930PJE7504_9 Opper, V. D., Henry, G. T., & Mashburn, A. J. (2008). The district effect: Systemic response to high stakes accountability policies in six southern states. American Journal of Education, 114, 299-332. doi:10.1086/521242 Park, V., & Datnow, A. (2009). Co-constructing distributed leadership: District and school connections in data-driven decision-making. School leadership and Ma nagement, 29, 477-494. doi:10.1080/13632430903162541 Petty, N. W., & Green, T. (2006). Measuring educationa l o ppo rtunity as perceived by students: A process indicator. School Effectiveness and School Improvement, 18, 67-91. doi:10.1080/09243450601104750 Popham, W. J. (2001). The truth about testing: An educator’s call in action. Alexandria, VA: Association for Supervision and Curriculum Development. Porter, A. C. (1991). Creating a system of school process indicators. Educational Evaluati o n a nd Policy Analysis, 13, 13-29. Ranson, S. (2003). Public accountability in the age of neo-liberal gov- ernment. Journal of Education Polic y , 18, 459-480. doi:10.1080/0268093032000124848 Reyes, P., Wagstaff, L. H,. & Fusarelli, L. D. (1999). Delta forces: The changing fabric of American society and education. In J. Murphy, & K. S. Louse, (Eds.), Handbook of research on educational admini- stration (2nd ed., pp. 183-202). S a n F rancisco, CA: Jossey-B a s s. Rothstein, R. (2000). Toward a composite index of school performance. The Elementary School Journal , 100, 409-441. doi:10.1086/499649 Schön, D. A. (1983). The reflective practitioner: How professionals think in action. New York: Basic Books. Shadish, W. R., Cook, T. D., & Leviton, L. C. (1991). Foundations of program evaluation: Theory of practice. New York: Sage publica- tions. Sheldon, K. M., & Biddle, B. J. (1998). Standards, accountability, and school Reform: Perils and pitfalls. Teacher College Record, 100, 164-180. Skyes, G. (1999). The new professionalism in education: An appraisal. In J. Murphy, & K. S. Louis (Eds.), Handbook of research in educa- tional administration (pp. 203-226, 2nd ed.). San Francisco: Jossey- Bass. Spillane, J. P. (2004). State, standard, assessment, and accountability instruments in practice: When the rubber hits the road. URL (last checked 2 May 2009). http://www.albany.edu/edfin/Spillane%20EFRC%20Symp%2004%2 0Single.pdf Spillane, J. P., Halverson, R., & Diamond, J. B. (2004). Towards a theory of leadership practice: A distributed perspective. Journal of Curriculum Studies, 36, 3-34. doi:10.1080/0022027032000106726 Spillane, J. P. (2006). Distributed leadership. San Francisco: Jossey- Bass. Spillane, J. P., Camburn, E. M., Pustejovsky, J., Pareja, A. S., & Lewis, G. (2008). Taking a distributed perspective: Epistemological and methodological tradeoffs in operationalizing the leader-plus aspect. Journal of Educational Administration, 46, 189-213. doi:10.1108/09578230810863262 Stecher, B. M. (2005). Developing process indicators to improve edu- cational governance: Lessons for education from health care. Testi- mony presented to the California Little Hoover Commission. Santa Monica, CA: Rand. Stufflebeam, D. L. (2001). Evaluation models. San Francisco, CA: Jossey-Bass. Stufflebeam, D. L., & Shinkfield, A. J. (2007). Evaluation theory, mod- els, and applications . San Francisco, CA: Joss ey-Bass. Valli, L., & Buese, D. (2007). The changing roles of teachers in an era of high-stakes accountability. American Educational Research Jour- nal, 44, 519-558. doi:10.3102/0002831207306859 Wayman, J. C. & Stringfield, S. (2006). Technology-supported in- volvement of entire faculties in examination of student data for in- structional improvement. American Journal of Education, 112, 549- 571. doi:10.1086/505059 Wayman, J. C., Cho, V., & Johnston, M. T. (2007). The data-informed district: A district-wide evaluation of data use in the Natrona County School District. Austin, TX: The University of Texas. Wayman, J. C., Stringfield, S., & Yakimowski, M. (2004). Software enabling school improvement through analysis of student data. Re- port No. 67. Baltimore, MD: The Johns Hopkins Un i versity. Weick, K. E. (1976). Educational organizations as loosely coupled systems. Administrative Science Quarterly, 21, 1-19. doi:10.2307/2391875 Woods, P. A., Bennett, N., Harvey, J. A., & Wise, C. (2 004). Variabili- ties and dualities in distributed leadership: Findings from a system- atic literature review. Educational Management Administration and Leadership, 32, 439-457. doi:10.1177/1741143204046497 Young, V. M. (2006). Teachers’ use of data: Loose coupling, agenda setting, and team norms. American Journal of Education, 112, 521- 548. doi:10.1086/505058
|