 Modern Economy, 2012, 3, 641-652 http://dx.doi.org/10.4236/me.2012.35083 Published Online September 2012 (http://www.SciRP.org/journal/me) Liquidity Expectation, Financing Ability and Credit Rating: Evidence from China Shan Tian1, Song Zhu2, Bo Liu3 1Department of Accounting, Tourism and Culture College of Yunnan University, Yunnan, China 2Business School, Beijing Normal University, Beijing, China 3China Sinopharm International Corporation, Beijing, China Email: ts0415@163.com, zhusong@bnu.edul.cn, liubo8218@sina.com Received June 16, 2012; revised July 15, 2012; accepted July 25, 2012 ABSTRACT Sovereign Credit Ratings of many countries and credit rating of dozens of firms has been downgraded since the latest financial crisis. However in China short-term finan cing market, the credit rating seems to show a counter-cyclical phe- nomenon. We find that wh en the market and the economy upsurge, the bond principal rating is relatively poor; when the market and economy downturn, the bond principal rating is relatively high. In other words, the ratings of short-term financing bills show a counter-cyclical phenomenon. We propose the liquidity hypothesis for this phenomenon that during the period of economic prosperity, market liquidity and capital is relatively abundan t; therefore even th e compa- nies with poor ratings have access to raise funds. When the market downturns and liquidity is poor, there are not enough funds in the market, thus the companies with poor ratings may fall to finance due to the lack of funds. Therefore, the liquidity of the market causes the bond rating to show a counter-cyclical phenomenon. Empirical research supports this hypothesis. Keywords: Liquidity Expectation; Financing Ability; Credit Rating; Counter-Cyclical Phenomenon 1. Introduction Since the subprime mortgage crisis, especially after 2011, many countries’ sovereign rating and lots of corporations ’ credit rating have b een continuously downgr aded that ma k - es the global economy keep falling. Therefore, the credit crisis has becoming important bottleneck and constraint for the global economic recovery. While during and after the crisis, th e three largest credit rating ag encies (e.g. M oo - dy, S & P and Fitch) have been heavily criticized, since the crisis has exposed many flaws of the credit rating agencies and the rating system. A serious problem is that the imperfection of the rating model greatly reduces the accuracy of credit rating. Therefore, to improve the rat- ing model and make the credit rating accurately to reflect the default risk has been hotly discussed after the crisis. As the development of China’s securities market, cor- porate bonds have become an important investment for investors. And the important role of bond ratings in eco- nomic activities is increasingly exposed. Concerning the political/regulatory environment and credit rating in Chin a, although crisis like the US subprime mortgage crisis has never happened, how the credit rating is assessed for do- mestic enterprises is seldom to be investigated. Besides the basic financial information as well as other “soft” in- formation, how the macroeconomic policies impact the rating is also never d iscussed in China. Actually tho se ques- tions are very important for global investors. Some researchers find that the credit rating shows a pro-cyclical phenomenon in developed countries (see e.g. [1-3]), however a domestic report1 shows that the credit rating for bond in China is more likely to be upgraded during the economic downturns (see [4]), which seem to be an obvious counter-cyclical phenomenon. Therefore, how does the macro economy affect the bond rating in China? And what’s the reason for the counter-cyclical p he - nomenon of bond rating? This paper attempts to discuss the credit rating and pro-cyclical o r counter-cyclical phe- nomenon in China. We find that when the market and the economy upsurge, the bond principal rating is relatively poor; when the market and economy downturn, the bond principal rating is relatively high. In other words, the rat- ings of short-term financing bills show a counter-cycli- cal phenomenon. We propose the liquidity hypothesis for this phenomenon that during the period of economic pros- perity, market liquidity and capital is relativ ely abundant; 1According to a document obtained by the “First Financial Daily” from the China Government Securities Depository Trust & Clearing Corpo- ration, during 2008 to 2010, follow-up ratings of bond issuers, a total o 388 ratings upgraded, only 13 downgraded. Especially in 2010, a total of 179 ratings upgrade, only 3 ratings downgraded. First Financial Da ily , September 19, 201 1. C opyright © 2012 SciRes. ME  S. TIAN ET AL. 642 therefore even the companies with poor ratings have ac- cess to raise funds. When the market downturns, liquidity is poor, and there are not enough funds on the market, the companies with poor main rating may fall to finance due to the lack of access to funds. Therefore, the liquidity of the market causes the bond rating to show the counter- cyclical phenomenon. Our empirical research supports this hypothesis. Section 2 reviews the previous rating literatures, and section 3 shows our hypothesis. Sections 4 and 5 are re- search design and empirical tests. Conclusions are shown in Section 6. 2. Literature Review Bond rating first appeared in the United States at the be- ginning of the 20th century. John Moody uses symbols to show the pros and cons of grade of the various grades of railway bonds in 1909, this is the first bond rating in the United States. “The Gr eat Depression” in 1930s proves t ha t the credit rating basically reflects the repayment of the bond, which increases the trust of investors in bond rat- ing. Therefore, the bond rating is crucial for investors. The bond’s cr edit risk is gener ally con sider ed to be the bond issuer’s risk of bankruptcy and the default risk of the bond. In order to reflect those risks, credit rating model and method are important. Rating methods include: 1) The credit rating method; 2) The traditional credit rating method; 3) The credit scoring model method and 4) The credit risk model method. There are numbers of theoretical and em- pirical researches on credit rating models (see [5-10]). In rating model, the critical rating factors taken into account by rating ag encies are pr imarily on two aspect: 1) On bu s i- ness, focusing on business size, diversity and regional dis - tribution, the quality of the products or services, market- ing capability and marketing networks; and 2) On finan- cial analysis, focusing on the quality of financial infor- mation, the scale and quality of assets, capital structure and debt pressures, profitability, cash flow and other fac- tors (see [11,12]). The Standard & Poor in its credit rating method men- tioned that the rating metho d is not limited to th e insp ect- tion of various financial indicators. Indeed, Butler and F au- ver [13] study the sovereign credit ratings from the per- spective of the legal and institutional environment. They find that the coun try’s legal and institutional environ ment has conspicuous positive effect on the sovereign credit rating. In addition, the macroeconomic factors largely det- ermine the m icroec onom ic perform anc e, so m acroeconomic factors, especially the economic cycle, play a pivotal role on bond rating. Carling et al. [14] shows that a variety of variables of the macroeconomic environment have impor - tant explanatory power on corporate default risk. If the state of the economy is divided into the peak, normal and underestimate situation, it will be found that the probabil- ity and default is particularly sensitive to economic cy- cles (see [2]). Therefore, studying the credit rating at different time points of the economic cycle can demon- strate the impact of the economic cycle on bond rating. Treacy and Carey [1] also points out that the rating changes will be more significant in a recession or expan- sion, which means there are more downgrades during the recession and more rati ngs i n c rea s ed du ring the econo mi c expansion. Researches in China reg arding credit rating are mainly on the rating methodology while research for factors af- fecting bond rating, both theoretical and empirical, is far lagging behind. By comparing the bond rating system of the United States, Germany and Japan, Liang [15] finds that the presence or absence of one country’s rating sys- tem and its specific model is closely related to bank-firm relationship. He and Fang [16] propose that Chin a should promote the healthy development of the bond rating in- dustry by two ways, creating an external environment c on- ducive to the healthy development of the rating industry and strengthening the building of the rating agencies. Chen and Guo [17], He and Jin [18] study the rating of corporate bonds primarily from the micro-factors. As to macroeconomic factors, especially about the economic cy- cle, monetary policy and institution al factors, there is less theoretical and empirical research. In China, the capital market’s performance is largely depending on the policy, and the main business and the market is highly subject to the impact of the macroeconomic environment. For this reason, it is quite practical important to explore China’s bond rating from a macro perspective. 3. Hypothesis The rating agencies typically assess the rate of the enter- prise on the business, financial aspects, as well as some other “soft factors”. Therefore, the scale of business, di- versity and regional distribution, the quality of the prod- ucts or services, the marketing capability and marketing networks, the quality of financial information, the asset size and quality, the capital structure and debt pressures, the profitability and the cash flow are the most basic rat- ing factors (see [11,12]). In fact, a corporation’s credit rate is the estimation of its risk of default and bankruptcy. In other words, the credit ratings of companies that do not default and bankruptcy will be relatively higher. And the ways to avoid such problems is timely accessing to funds for reimbursement. This means that the enterprise has sufficient financing ability to pay the maturing debt timely, so the enterprise wou ld not default. Even if due to operational problems, the enterprise is not profitable, as long as it can still get money, there would be no bank- ruptcy problem. Therefore, the key of corporate rating is whether it has a strong financing ability, if companies ha s a strong financing ability can reduce the possibility of de- fault and bankruptcy. Copyright © 2012 SciRes. ME  S. TIAN ET AL. 643 A large part of Chinese enterprises are state-owned en- te r p r i s e s , o p e r a t i o n a l p r oble m s o f t e n un d e r t a k e n b y t h e gov- ernment, so bankruptc y probl ems are rare. Of course, there may be the event of default. That is the company unable to pay maturing debts, but the government as a patron can solve the problem through debt forgiveness, debt-equity swap and other means. Of course, not all state-owned en t- erprises are able to be such a government’s “pet”, becau se of their importance, there are some differences on the financing ability. China’s private enterprises that have a certain political relations also can get strong support from the government on financing (see [19,20]). Of course, not all private enterprises have such a “po litical relations”. In other words, there are big differences among the finance- ing ability of domestic enterprises. The differences of fi- nancing ability result in the diversity of maturing debt re- payment, business failure and bankruptcy, which leading to the main rating difference. Therefore, we prop ose that: Hypothesis 1: Financing capability is positively cor- related with bond rating. The economic cycles play a pivotal role in the bond rating, and the various variables of macro environment have important explanatory power on the corporate de- fault risk (see [14]). The reason is that economic envi- ronmental impact the probability of default of the bond, of default is particularly sensitive to economic cycles (s ee [2]). There are more rating downgrades during the eco- nomic recession, whereas in the economic expansion there are more ratings increased (see [1]). In fact, the impact of the economic cycle on the bond rating directly relate to the amount of funding available by the enterprise. During the economic downturn, the ma r- ket relatively lacks of liquidity, so it is difficult for en- terprises to obtain external financing , even if it wanted to issue bonds. The rating agencies will be relatively more cautious, and they tend to give poor evaluation on the corporations, so the rating of the enterprise will be ad- justed accordingly. During the period of economic pros- perity, market liquidity is better, and there are more en- terprises entering the market for financing. The ra ting a ge n- cies are relatively more optimistic, so they will give com- panies higher ratings to the enterprise. It is because of the liquidity situation, the rating shows pro-cyclical utility w it h the economic cycle. Therefore, the bond rating or the corporate rating is based on the expectation of the market liquidity. In other words, market liquidity will affect the rating of the en- terprise. When the market is expected to be lacks of li- quidity to a certain extent, and when the monetary policy tightening, are difficult to ob tain funding, the anticipated development of the companies will be impacted by the tighter monetar y policy. A t the same ti me, the enterp r is es ’ future profitab ility will decline to a certain exten t, so th eir ratings are relatively poor. Therefore, we assume that: Hypothesis 2: The declining of Liquidity expectat io n is negatively related with bond rating. When the market is expected to be lacks of liquidity to a certain extent, and the monetary policy tightening, it is difficult for the companies to obtain funds even if they have a strong financing ability, and the anticipated devel- opment of the companies will be influenced by the tig hter monetary policy, and the fu ture profitability will decline. Therefore, the declining in market liquidity will have a negative impact on the bond ratings, and this declining will reduce the positive impact of strong financing ab ility on the corporate bond rating. Therefore, we assume that: Hypothesis 3: The declining of liquidity expectation will reduce the positive impa ct of the financing ability on bond rating. 4. Research Design 4.1. Model and Variables The ratings that the agencies give to the enterprises are divided into different levels, so we use the Ordered Logit model for the empirical analysis, and the model is set as follows: 01 234 567 8 91011 12 cov CreditListROECPICPI List CPI ROEGDPgrowInterer Lev SizeAgeGuarantee IndSup Credit stands for the credit rating, which is the rating that the professional credit rating agencies give to the is- suers when their bonds are issued. The credit rating in- cludes AAA, AAA–, AA+, AA, AA–, A+, A, A– and BBB levels. In the regression of this paper, AAA and AAA– are classified as the first level, and assigned a value of 3. AA+, AA and AA– are regarded as the second level, assigned a value of 2. A+, A, A– and BBB+ are the th ird level2, assigned a value of 1. In robust test, the ratings are divided into 9 degrees, AAA is the first degree, a value of 8; AAA– is the second degree, the assignment is 7; descending order of BBB+ for the ninth degree, the as- signment is zero. This paper uses List and ROE to measure the financing ability. The listed companies can absorb funds from the stock market, so compared to the non-listed companies their financing channels are relatively broader. What’s more is that a listed company’s “shell” is valuable, thus the listed companies have better access to gain debt capital. There- fore, in terms of the financing channels and financing strength the listed companies are more competitive than the non-listed companies. While the higher profitability of a company, the stronger ability it has to gain benefit 2There are just two samples’ rating are BBB+, so they are classified in the thirdlevel. Copyright © 2012 SciRes. ME  S. TIAN ET AL. 644 for shareholders, and it can protect the interests of credi- tors’ better, which can improve its ability to absorb new funds. The higher profitab ility of the compan y, the easier for the company to be listed to obtain funds, and it is easier for it to issue or allot shares on the capital market, the more loans it can get from creditors. Therefore, the profitability reflects the financing ability to a certain ex- tent, the higher profitability of the corporations, the stronger financing ability of them. Based on hypothesis 1, we ex- pect α1 > 0, and α2 > 0. Market liquidity expectation is proxy by CPI, and we use the consumer price index (CPI) of the bond issu- ance’s month3. Higher CPI stands for severer inflation, which means that the central bank tends to adjust the market liquidity by means of monetary policy or market operations to reduce the external currency flows. There- fore higher CPI means the lower market liquidity expec- tation4. Although the growth rates of narrow money (M1) and broad money (M2) also represent the market liquid- ity, the higher CPI is more likely to mean a tightening of monetary policy in the future, while higher growth rate of M1 or M2 does not more likely mean tighten mone- tary policy. Thus the CPI reveals liquidity expectation. Based on hypothesis 2, we expect α3 < 0. CPI × List and CPI × ROE are the cross-terms of the market liquidity expectation and the corporations’ finance- ing ability. Based on hypothesis 3, we predict that α4 < 0 and α5 < 0. GDPgrow is the measurable variable of output growth (“economic cycle”), by deducting the real GDP growth rate by the expected GDP growth. The real GDP growth rate can be found in the China Statistical Yearbook, and the World Bank’s growth expectations of the economy about the countries around the world will be adjusted ac- cording to actual situation and the macroeconomic envi- ronment, which have a high correlation with the macro- economic environment, so we have chosen the world Bank’s economy forecast data on China as the source of the expected GDP growth. This variable reveals the gap between the real economic growth and the economic gro- wth potential, and it reflects the relative strength of the current macroeconomic situation, so we use it as a meas- urable indicator of the economic cycle. Intercover is the interest coverage ratio, which equals (total profit + financial expenses)/finance expenses. Lev is the leverage ratio, equals to total liabilities/to tal assets. Size stands for the firm size, and we use the natural loga- rithm of the total assets. Age represents the life cycle of the enterprises, which is equ ivalent to the years of estab- lishment up to the month of the security issuance. Guar- antee is a dummy variable, 1 indicates that the issued securities were guaranteed and 0 otherwise. IndSup is a dummy variable for the industry, 1 indicates the industrie s which are supported by the Chinese industry policy and 0 otherwise. The data used in the calculatio n of the above variables are the financial data disclosed in the financial statements of the previous year that the secu rities are issued. 4.2. Data Sources and Sample We collect all the documents of short-term financing bills issued during 2005 to 2010 from the China Bond Informa- tion Networ k (http://www.chinabond . com.cn/d2s/index.html). The documents include bonds issued document, the pro- spectus, the credit rating reports, the financial statements. And we collect the issuers’ credit rating, the ownership structure, the a ud it in st itu tio ns , th e f inan cial d ata d isc losed in the bond issuance files manually. Due to missing data for some samples’ issuer credit rating and financial in- formation, the final sample is 1550 issuance. Meanwhile, we collect China’s GDP grow th during 2 005 and 2010 as well as CPI data from the China Statistical Yearbook, and collect the World Bank’s latest forecast data about China’s annual GDP growth rate from 2005 to 2010 on the website of the World Bank. 5. Empirical Analysis 5.1. Descriptive Statistics Table 1 shows the descriptive statistics of regression vari- ables. The average of issuer credit rating is 2 which me a n s the majority of the issuer ratings is above A. 32.7% of the total samples are listed firms which means the most Table 1. Descriptive statistics. Variable N MeanStd. Min MedianMax Credit 15502.0600.590 1 2 3 List 15500.3270.469 0 0 1 ROE 15500.0880.089 –0.655 0.0761.017 CPI 15500.0300.026 –0.018 0.0280.087 GDPgrow15500.0100.011 –0.009 0.0080.026 Intercover155010.75820.550 0 4.2795100 Lev 15500.5670.178 0.016 0.5990.977 Size 155014.4961.382 9.867 14.33119.319 Age 155012.9887.380 0.356 11.90292.060 Guarantee15500.0160.126 0 0 1 IndSup 15500.3920.488 0 0 1 3Rating often is given a few months before the bond issuance, so it is somewhat lag to use the CPI of issuance month, which is equivalent to expect the CPI after the credit rating. 4This paper has verified the effective of the CPI to represent the liquid- ity expectation. The growth rate of M1 and M2 represent the market liquidity, while the correlation coefficients of the CPI with the growth rate of M1 and M2 are –0.2439 and –0.2284, both significant at 0.01 level. That is CPI is significantly negative correlate with the liquidity indicators. So CPI on behalf of liquidity expec tati on i s reasonable. Copyright © 2012 SciRes. ME 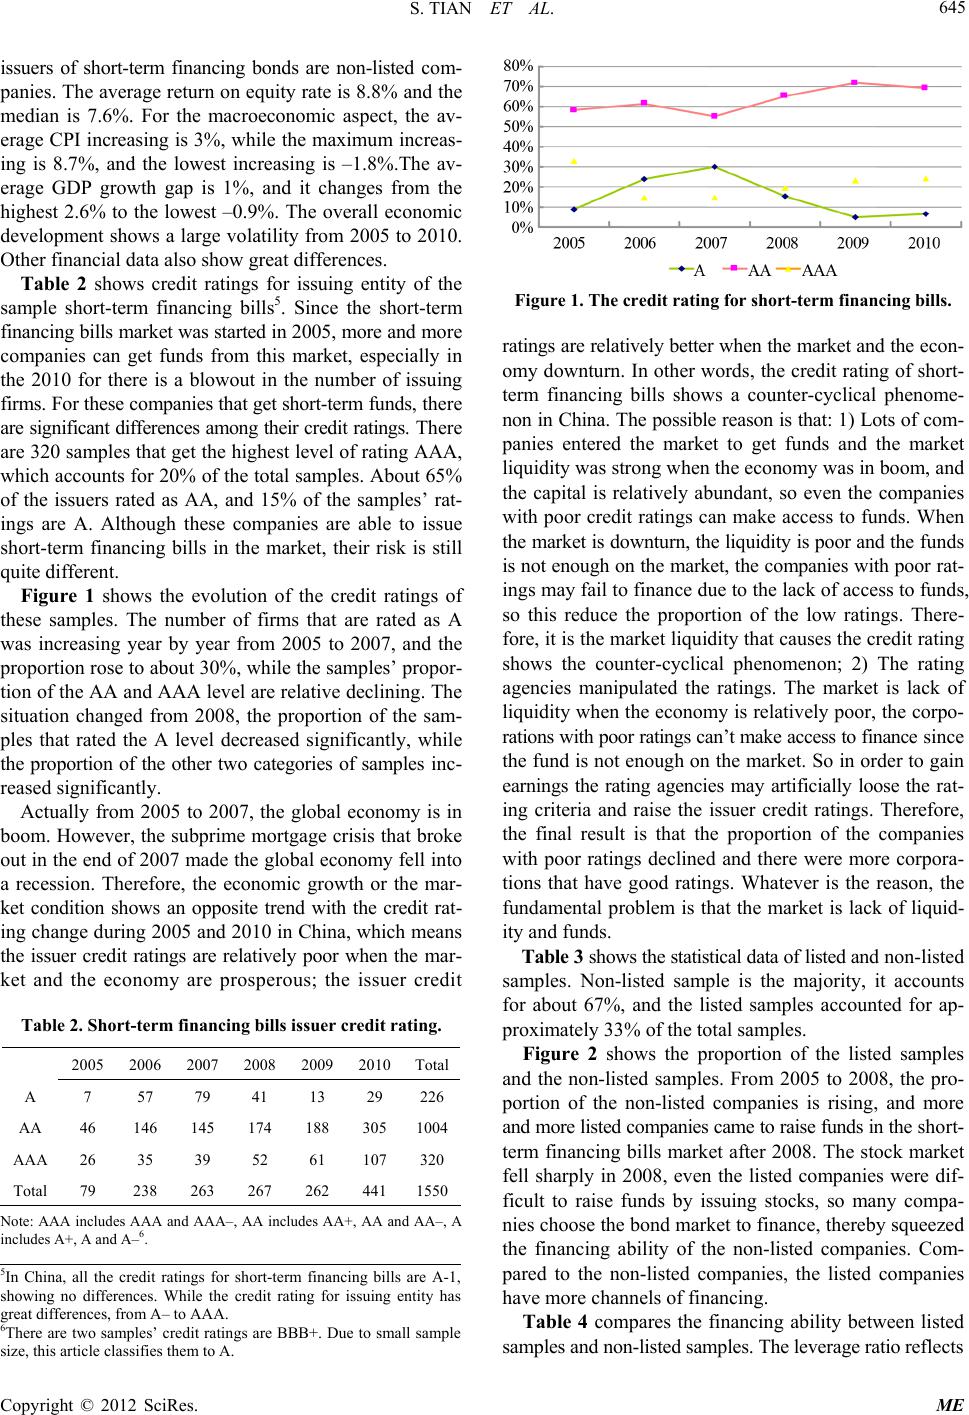 S. TIAN ET AL. 645 issuers of short-term financing bonds are non-listed com- panies. The average return on equity rate is 8.8% and the median is 7.6%. For the macroeconomic aspect, the av- erage CPI increasing is 3%, while the maximum increas- ing is 8.7%, and the lowest increasing is –1.8%.The av- erage GDP growth gap is 1%, and it changes from the highest 2.6% to the lowest –0.9%. The overall economic development shows a large vo latility from 2005 to 2010. Other financial data also show great differences. Table 2 shows credit ratings for issuing entity of the sample short-term financing bills5. Since the short-term financing bills market was started in 2005, more and more companies can get funds from this market, especially in the 2010 for there is a blowout in the number of issuing firms. For these companies that get short-term funds, ther e are significant differences among their credit ratings. Th er e are 320 samples that get the high est level of rating AAA, which accounts for 20% of the to tal samples. About 65% of the issuers rated as AA, and 15% of the samples’ rat- ings are A. Although these companies are able to issue short-term financing bills in the market, their risk is still quite different. Figure 1 shows the evolution of the credit ratings of these samples. The number of firms that are rated as A was increasing year by year from 2005 to 2007, and the proportion rose to about 3 0%, while the samp les’ propo r- tion of the AA and AAA level are relative declining . The situation changed from 2008, the proportion of the sam- ples that rated the A level decreased significantly, while the proportion of the other two categories of samples in c- reased significantly. Actually from 2005 to 2007, the global economy is in boom. However, the subprime mortgage crisis that broke out in the end of 2007 made the global economy fell into a recession. Therefore, the economic growth or the mar- ket condition shows an opposite trend with the credit rat- ing change during 2005 and 2010 in China, which means the issuer credit ratings are relatively poor when the mar- ket and the economy are prosperous; the issuer credit Table 2. Short-term financing bills issuer credit rating. 2005 2006 2007 2008 2009 2010Total A 7 57 79 41 13 29 226 AA 46 146 145 174 188 305 1004 AAA 26 35 39 52 61 107 320 Total 79 238 263 267 262 441 1550 Note: AAA includes AAA an d AAA–, AA includes AA+, AA and AA–, A includes A+, A and A–6. Figure 1. The credit rating for short-term financing bills. ratings are relatively better when the market and the econ - omy downturn. In other words, the credit rating of short- term financing bills shows a counter-cyclical phenome- non in China. The possible reason is that: 1) Lots of com- panies entered the market to get funds and the market liquidity was strong when the economy was in boom, and the capital is relatively abundant, so even the companies with poor credit ratings can make access to funds. When the market is downturn, the liquidity is poor and the fu nds is not enough on the market, the companies with poor r at- ings may fail to finance du e to the lack of access to funds, so this reduce the proportion of the low ratings. There- fore, it is the market liquidity that causes th e credit rating shows the counter-cyclical phenomenon; 2) The rating agencies manipulated the ratings. The market is lack of liquidity when the economy is relativ ely poor, the corpo- rations with poor ratings can’ t make access to finance s i n c e the fund is not enough on the market. So in order to gain earnings the rating agencies may artificially loose the rat- ing criteria and raise the issuer credit ratings. Therefore, the final result is that the proportion of the companies with poor ratings declined and there were more corpora- tions that have good ratings. Whatever is the reason, the fundamental problem is that the market is lack of liquid- ity and funds. Table 3 shows the statistical data of listed and no n- l is te d samples. Non-listed sample is the majority, it accounts for about 67%, and the listed samples accounted for ap- proximately 33% of the total samples. Figure 2 shows the proportion of the listed samples and the non-listed samples. From 2005 to 2008, the pro- portion of the non-listed companies is rising, and more and more listed co mpan ies came to raise funds in th e sh ort - term financing bills market after 2008. The stock market fell sharply in 2008, even the listed companies were dif- ficult to raise funds by issuing stocks, so many compa- nies choose the bond market to finance, thereby squeezed the financing ability of the non-listed companies. Com- pared to the non-listed companies, the listed companies have more channels of financing. 5In China, all the credit ratings for short-term financing bills are A-1, showing no differences. While the credit rating for issuing entity has great differences, from A– to AAA. 6There are two samples’ credit ratings are BBB+. Due to small sample size this article classifies the to A. Table 4 compares the financing ability between listed samples and non-listed sam ples. The le verage ratio reflects Copyright © 2012 SciRes. ME 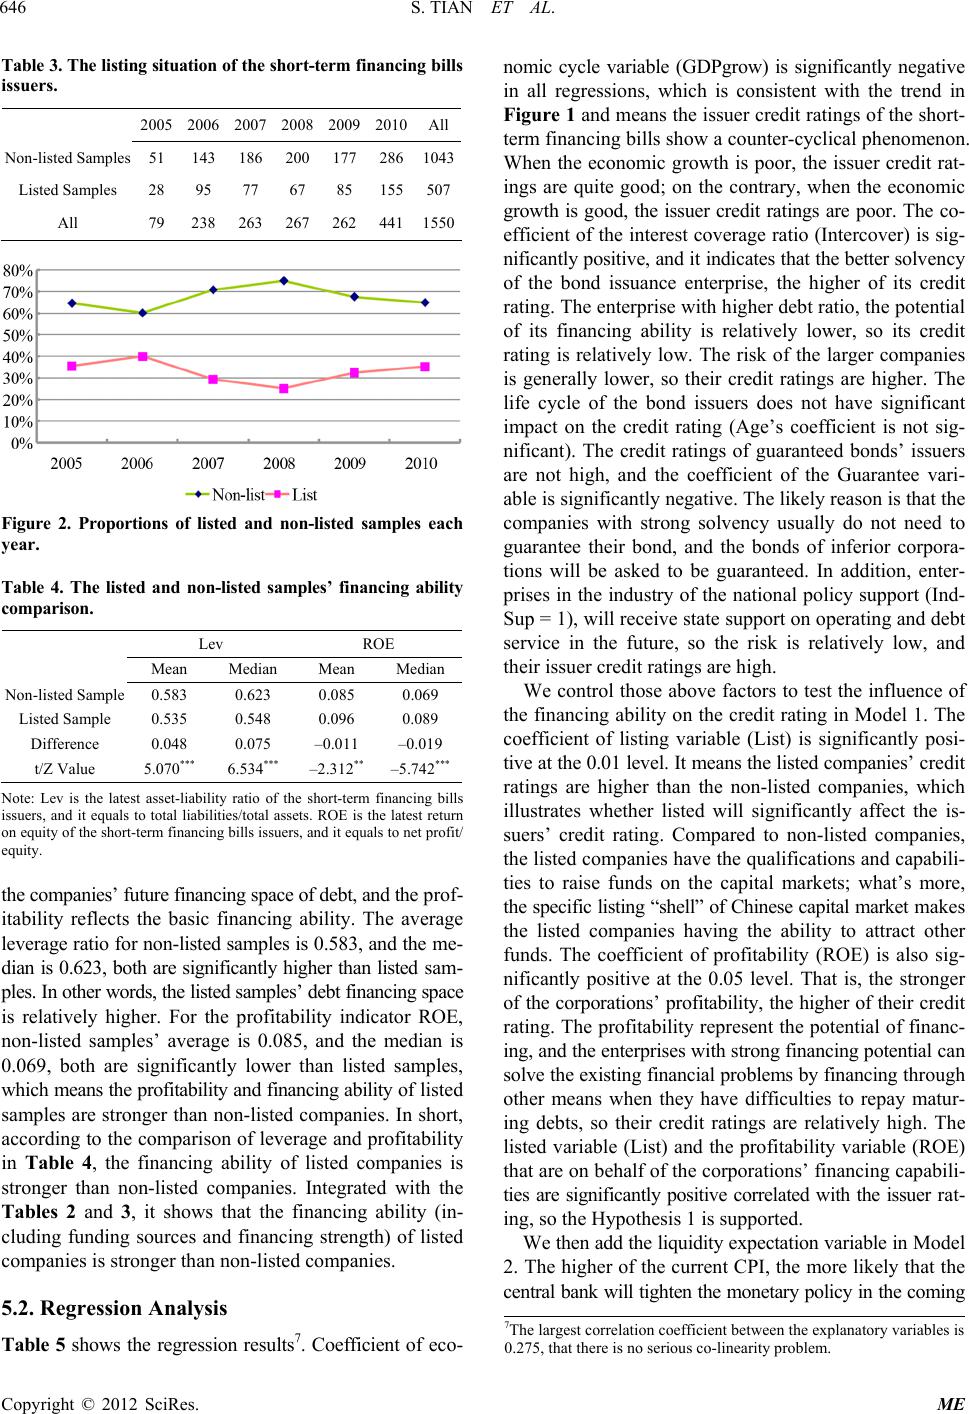 S. TIAN ET AL. 646 Table 3. The listing situation of the short-term financing bills issuers. 2005 2006 2007 2008 2009 2010All Non-listed Samples 51 143 186 200 177 286 1043 Listed Samples 28 95 77 67 85 155507 All 79 238 263 267 262 441 1550 Figure 2. Proportions of listed and non-listed samples each year. Table 4. The listed and non-listed samples’ financing ability comparison. Lev ROE Mean Median Mean Median Non-listed Sample 0.583 0.623 0.085 0.069 Listed Sample 0.535 0.548 0.096 0.089 Difference 0.048 0.075 –0.011 –0.019 t/Z Value 5.070*** 6.534*** –2.312** –5.742*** Note: Lev is the latest asset-liability ratio of the short-term financing bills issuers, and it equals to total liabilities/total assets. ROE is the latest return on equity of the short-term financing bills issuers, and it equals to net profit/ equity. the compan ies’ future financ ing space of debt, and the prof- itability reflects the basic financing ability. The average leverage ratio for non-listed samples is 0.583, and the me- dian is 0.623, both are significantly higher than listed sam- ples. In other words, the listed samples’ debt financing space is relatively higher. For the profitability indicator ROE, non-listed samples’ average is 0.085, and the median is 0.069, both are significantly lower than listed samples, which means the profitability and financing ability of li st e d samples are stronger than non-listed companies. In short, according to the comparison of leverage and profitability in Table 4, the financing ability of listed companies is stronger than non-listed companies. Integrated with the Tables 2 and 3, it shows that the financing ability (in- cluding funding sources and financing strength) of listed companies is stronger than non-listed companies. 5.2. Regression Analysis Table 5 shows the regression results7. Coefficient of eco- nomic cycle variable (GDPgrow) is significantly negative in all regressions, which is consistent with the trend in Figure 1 and means the issuer credit ratings of the short- term financing bills show a counter-cyclical ph enomenon. When the economic growth is poor, the issuer credit rat- ings are quite good; on the contrary, when the economic growth is good, the issuer credit ratings are poor. The co- efficient of the interest coverage ratio (Interco ver) is sig- nificantly positive, and it indicates that the better solve ncy of the bond issuance enterprise, the higher of its credit rating. The enterprise with higher debt ratio, the potential of its financing ability is relatively lower, so its credit rating is relatively low. The risk of the larger companies is generally lower, so their credit ratings are higher. The life cycle of the bond issuers does not have significant impact on the credit rating (Age’s coefficient is not sig- nificant). The credit ratings of guaranteed bonds’ issuers are not high, and the coefficient of the Guarantee vari- able is significantly negative. The lik ely reason is that th e companies with strong solvency usually do not need to guarantee their bond, and the bonds of inferior corpora- tions will be asked to be guaranteed. In addition, enter- prises in the industry of the national policy support (Ind- Sup = 1), will receive state support on operating and debt service in the future, so the risk is relatively low, and their issuer credit ratings are high . We control those above factors to test the influence of the financing ability on the credit rating in Model 1. The coefficient of listing variable (List) is significantly posi- tive at the 0. 01 leve l. It means the lis ted comp anies’ c r e di t ratings are higher than the non-listed companies, which illustrates whether listed will significantly affect the is- suers’ credit rating. Compared to non-listed companies, the listed compan ies have the qualifications and cap abili- ties to raise funds on the capital markets; what’s more, the specific listing “shell” of Chinese capital market mak es the listed companies having the ability to attract other funds. The coefficient of profitability (ROE) is also sig- nificantly positive at the 0.05 level. That is, the stronger of the corporations’ profitability, the higher of their credit rating. The profitability represent the potential of financ- ing, and the enterprises with strong financing potential can solve the existing financial problems by financing th rou gh other means when they have difficulties to repay matur- ing debts, so their credit ratings are relatively high. The listed variable (List) and the profitability variable (ROE) that are on behalf of the corpo rations’ financing capab ili- ties are significantly positive correlated with the issuer rat- ing, so the Hypothesis 1 is supported. We then add the liquidity expectation variable in Mode l 2. The higher of the current CPI, the more likely that the central bank will tighten the monetary policy in the coming 7The largest correlation coefficient between the explanatory variables is 0.275, that there is no serious co-linearity problem. Copyright © 2012 SciRes. ME  S. TIAN ET AL. Copyright © 2012 SciRes. ME 647 Table 5. The financing capabilities, market liquidity and the credit rating. Variable Sign Expectation Model 1 Model 2 Model 3 Model 4 Model 5 Model 6 Model 7 List + 0.351*** 0.297** 0.636*** 0.299** 0.632*** 0.628*** 0.444* (2.67) (2.23) (3.12) (2.24) (3.11) (3.07) (1.74) ROE + 1.634** 1.846*** 1.839*** 3.523*** 3.540*** 3.505*** 3.719*** (2.36) (2.66) (2.64) (3.61) (3.59) (3.55) (3.19) CPI – –17.911*** –14.474*** –12.843*** –9.363*** –8.883** –10.966** (–7.28) (–4.98) (–3.96) (–2.60) (–2.44) (–2.41) CPI × List – –11.066** –10.946** –11.311** –8.091 (–2.20) (–2.19) (–2.26) (–1.32) CPI × ROE – –56.742** –57.014** –57.944** –74.297*** (–2.39) (–2.40) (–2.42) (–2.64) GDPgrow ? –18.903*** –25.142*** –25.293*** –25.288*** –25.730*** –25.363*** –22.073*** (–3.43) (–4.44) (–4.46) (–4.46) (–4.54) (–4.47) (–3.07) Intercover + 0.015*** 0.015*** 0.015*** 0.015*** 0.015*** 0.015*** 0.014*** (4.70) (4.70) (4.72) (4.73) (4.74) (4.73) (3.77) Lev – –0.940** –1.557*** –1.484*** –1.529*** –1.450*** –1.430*** –1.438*** (–2.54) (–4.08) (–3.87) (–4.00) (–3.78) (–3.71) (–2.88) Size + 1.359*** 1.415*** 1.418*** 1.420*** 1.422*** 1.411*** 1.441*** (20.11) (20.34) (20.32) (20.34) (20.33) (20.21) (15.21) Age ? 0.008 0.007 0.010 0.009 0.007 0.006 0.002 (1.03) (0.82) (1.11) (1.04) (0.83) (0.78) (0.22) Guarantee + –1.216*** –1.332*** –1.334*** –1.364*** –1.363*** –1.824*** (–2.74) (–2.89) (–2.91) (–2.97) (–2.98) (–3.42) IndSup + 0.417*** 0.367*** 0.380*** 0.383*** 0.393*** 0.367*** (3.24) (2.82) (2.92) (2.94) (3.01) (2.80) N 1550 1550 1550 1550 1550 1525 941 LR chi2 794.55 849.59 855.00 855.67 860.00 830.50 439.94 R-sq 0.2887 0.3087 0.3107 0.3109 0.3125 0.3072 0.2741 Note: The figures in the brackets are white-t statistic, and the paper has considered the problem of heteroscedasticity; ***, **, *denote signif icant a t th e 0 .01, 0.05 and 0.10 level. month or months, and the liquidity of the capital market will be lowered, which may raise the cost of debt financ- ing, and simultaneously raise the corporations’ cost of funds, and finally have a negative impact on the business. In other words, the worse of the liquidity expectation (the higher of the CPI), the higher of the cost of funds, which may generate a negative impact on the corporations’ performance and solvency, and it lowers the credit rating. The Hypothesis 2 is supported. The coefficients of the listed variable (List) and the profitability (ROE) are still significantly positive. That is the stronger of the financ- ing ability, the h igher of the credit rating, so th e Hyp oth e- sis 1 is still supported. In Model 3 and Model 4 we respectively analyses the influence of the liquid ity expectation to the impact of th e financing ability on the credit rating by using two financ- ing ability vari ables. The lis t variable ( CPI × List) is t ak e n into account in Model 3, and the profitab ility (CPI ×ROE) is considered in Model 4, and then this paper conducts a comprehensive analysis of this two aspects (CPI × List, CPI × ROE) in Model 5. The coefficients of the list vari- able (List) and the profitability (ROE) are still signific ant ly positive, and the coefficient of the liquidity expectation (CPI) is still significantly negative, all of which is con- sistent with the previous results. The coefficients of CPI × List and CPI × ROE are sig- nificantly negative at the 0.05 level. That means the liqu id- ity expectation not only has a negative impact on the bond rating directly, but also reduces the positive contribution of the financing ability on the credit rating. Despite whether the issuers are listed and have strong profitability or not, the liquidity ex pectation will lower th e credit rating of t he bond issu ers. Part of the sample companies issued short-term financ- ing bills with guarantee, which may show a different tren d ; therefore we exclude the samples that are guaranteed in Model 6, while the result is entirely consistent with the previous. Financing ability is positive with the credit rat- ing, and the liquidity expectation has a negative impact on the credit rating, the poor liquid ity expectation will lower the credit rating directly and simultaneou sly let down the positive impact of the financing ability on the credit rating. Some samples’ issuers belong to the industry that has the great support from the government and the effect of t he policy may be very small on them, even if the monetary is tightened. So the paper excludes the samples belong to  S. TIAN ET AL. 648 the support industry in Model 7. Similarly, the result is still consistent with previous, and the Hypothesis 1 and the Hy - pothesis 2 are still supported. In summary, the results in Table 5 show that the fi- nancing ability can sign ificantly improve the enterprise’s credit rating, but this ability will be influenced by the monetary policy or the liquidity expectation. The liquid- ity expectation has a significant negative impact on the is- suer credit rating. Passive rating may be helpful for the rating objects to establish some kind of “relationship” with the rating ag en - cies, and the rating agencies tend to rely on the “soft” in- formation obtained through internal channels rather than the “hard” information got from the open market when the rating agencies have “relationship” with the rating objects. Chang et al. [21] found that the banks took “soft information” into accoun t when they loaned to the enter- prises, such as whether state-owned and the equity ratio of the controlling shareholder. Therefore, the robustness test showed in Table 6, and Model 8 controls the relevant characteristics of the ownership structure. State repr esent s the nature of the ultimate controller, 1 stands for state- owned, and 0 otherwise. V is control right (Voting right) of the ultimate controller, Deviation is the difference be- tween the control right and the cash flow right of the ul- timate controller, the calculation method is same as the research of Fan and Wong [22]8. The results show that the nature of th e enterprises (State or not) has significant effect on the credit rating. And the state-owned enterpr is e s’ credit ratings are significantly higher than the non-state- owned enterprises. The reason of this phenomenon is the state-owned enterprises have the final backing—Govern- ment. The Government will lend a “helping hand” to solve the problems when the corporations encounter problems on business. The coefficient of the ultimate controllers’ equity ratio (V) is signi ficant ly posi ti ve. That is, the higher of the corporations’ equity ratio, the higher of the credit rating. The possible reason is that the major shareholders of the corporations with high control right have lower motivation to empty the enterprises (see [23]). The coefficient of the control right and the cash flow right discrepancy (Deviation) is negative, but it is not sig- nificant. Financing ability (List and ROE) is positive wit h the credit rating, and the liqu idity expectatio n has a neg a- tive impact on the credit rating. The poor liquidity expectation will lower the credit ra t- ing directly and simultaneously let down the positive im- pact of the financing ability on the credit rating (the co- efficients of the CPI × LIST and CPI × ROE are signifi- cant at the 0.05 level). Our t hree hypotheses are supported. The previous study found that the accounting informa- tion played an important role on the corporations’ invest- ment and financing (see [24]), and this indicated that the accounting information may also play a key role on the credit rating. Therefore, this paper controls the influence of the accounting information qu ality on the credit rating in Model 9. We choose the bond issuers’ audit institu- tions as dummy variables of the quality of the accounting information. Big4 is a dummy variable, 1 means that the auditing firms are the four biggest international audit firms and 0 otherwise. Top10 is the dummy variable of the Chi - nese audit firms’ top ten9, 1 means that the audit firms a re the biggest ten of Chinese audit agencies, and 0 otherw i s e . It is generally accepted that the customers’ accounting in- formation quality of the Big Four audit is better than the top ten audit agencies, and both are higher than the com- panies that audited by Chinese non-top ten audit firms. The results show that the quality of the accounting infor- mation significantly affects the credit rating. The higher is the information’s quality, the better of the credit rating. The financing ability (List and ROE) is positive with the credit rating, whereas the poor liquidity expectation will lower the credit rating directly (the coefficient of the CPI is significantly negative) and simultaneously let down the positive impact of the financing ability on the credit rat- ing (the coefficients of the CPI × LIST and CPI × ROE are significant at the 0.05 level). The three hypothesis of this paper are supported. Since the financial crisis, the reputation and credibility of the international rating agencies have been criticized, and other small rating agencies’ credibility is even more doubtful. While the rating business of China’s short-term financing bills market is basically monopolized by four Chinese rating agencies: the Emirates International Credit Rating Co., Ltd., the Integrity of the International Credit Rating Co., Ltd., Joint Credit Rating Co., Ltd. and Shang - hai New Century Ratings Co., Ltd. Except for the Emirates International, the other three rating agenci es are more or less controlled by fore ign c api - tal, and this difference of the ownership property may lea d to the distinction of the risk controlling. Cantor and Packer [25] find that the rating results made by the rating agen- cies are usually opposite with the viewpoint of the inves- tors and the regulators, and the connotation of the rating made by different rating agencies at different times is quite different. Therefore, we further control the differ- ence of rating agencies in Model 10. The result shows th a t the issuer credit ratings made by the Emirates Interna- tional Credit Rating Co., Ltd. are significantly lower than the other three agencies. The possible explanations for that is the rating criteria of the Emirates International Credit Rating Co., Ltd. is more stringent than the other three, and another reason may be the q uality of its customers is relatively poor. The coefficients of the financing ability (List and ROE), liquidity expectation (CPI) and the cro ss- variables (CPI × LIST and CPI × ROE) are consistent with 8The status of the shareholders is disclosed in the prospectus. 9The audit firm rankings refer to the 2010 national firm rankings. Copyright © 2012 SciRes. ME 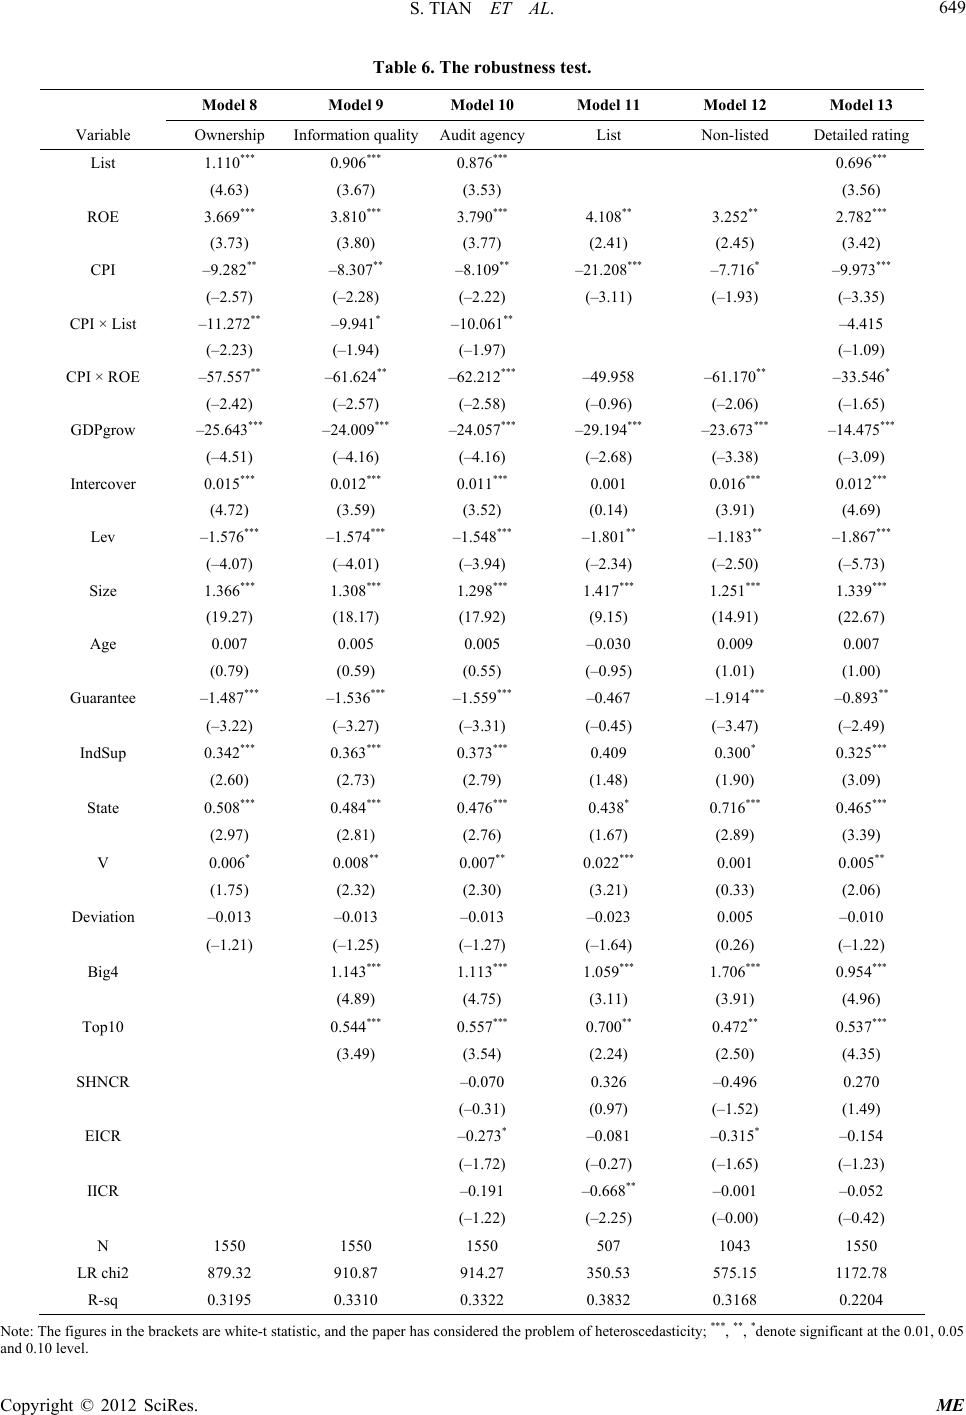 S. TIAN ET AL. Copyright © 2012 SciRes. ME 649 Table 6. The robustness test. Model 8 Model 9 Model 10 Model 11 Model 12 Model 13 Variable Ownership Information qualityAudit agency List Non-listed Detailed rati ng List 1.110*** 0.906*** 0.876*** 0.696*** (4.63) (3.67) (3.53) (3.56) ROE 3.669*** 3.810*** 3.790*** 4.108** 3.252** 2.782*** (3.73) (3.80) (3.77) (2.41) (2.45) (3.42) CPI –9.282** –8.307** –8.109** –21.208*** –7.716* –9.973*** (–2.57) (–2.28) (–2.22) (–3.11) (–1.93) (–3.35) CPI × List –11.272** –9.941* –10.061** –4.415 (–2.23) (–1.94) (–1.97) (–1.09) CPI × ROE –57.557** –61.624** –62.212*** –49.958 –61.170** –33.546* (–2.42) (–2.57) (–2.58) (–0.96) (–2.06) (–1.65) GDPgrow –25.643*** –24.009*** –24.057*** –29.194*** –23.673*** –14.475*** (–4.51) (–4.16) (–4.16) (–2.68) (–3.38) (–3.09) Intercover 0.015*** 0.012*** 0.011*** 0.001 0.016*** 0.012*** (4.72) (3.59) (3.52) (0.14) (3.91) (4.69) Lev –1.576*** –1.574*** –1.548*** –1.801** –1.183** –1.867*** (–4.07) (–4.01) (–3.94) (–2.34) (–2.50) (–5.73) Size 1.366*** 1.308*** 1.298*** 1.417*** 1.251*** 1.339*** (19.27) (18.17) (17.92) (9.15) (14.91) (22.67) Age 0.007 0.005 0.005 –0.030 0.009 0.007 (0.79) (0.59) (0.55) (–0.95) (1.01) (1.00) Guarantee –1.487*** –1.536*** –1.559*** –0.467 –1.914*** –0.893** (–3.22) (–3.27) (–3.31) (–0.45) (–3.47) (–2.49) IndSup 0.342*** 0.363*** 0.373*** 0.409 0.300* 0.325*** (2.60) (2.73) (2.79) (1.48) (1.90) (3.09) State 0.508*** 0.484*** 0.476*** 0.438* 0.716*** 0.465*** (2.97) (2.81) (2.76) (1.67) (2.89) (3.39) V 0.006* 0.008** 0.007** 0.022*** 0.001 0.005** (1.75) (2.32) (2.30) (3.21) (0.33) (2.06) Deviation –0.013 –0.013 –0.013 –0.023 0.005 –0.010 (–1.21) (–1.25) (–1.27) (–1.64) (0.26) (–1.22) Big4 1.143*** 1.113*** 1.059*** 1.706*** 0.954*** (4.89) (4.75) (3.11) (3.91) (4.96) Top10 0.544*** 0.557*** 0.700** 0.472** 0.537*** (3.49) (3.54) (2.24) (2.50) (4.35) SHNCR –0.070 0.326 –0.496 0.270 (–0.31) (0.97) (–1.52) (1.49) EICR –0.273* –0.081 –0.315* –0.154 (–1.72) (–0.27) (–1.65) (–1.23) IICR –0.191 –0.668** –0.001 –0.052 (–1.22) (–2.25) (–0.00) (–0.42) N 1550 1550 1550 507 1043 1550 LR chi2 879.32 910.87 914.27 350.53 575.15 1172.78 R-sq 0.3195 0.3310 0.3322 0.3832 0.3168 0.2204 Note: The f igu res i n th e brack ets are wh ite- t st ati sti c, and the pap er h as co ns idered th e prob lem of heter os cedas ti cit y; ***, **, *d eno te s ign ifican t at th e 0.01 , 0 .05 and 0.10 lev el.  S. TIAN ET AL. 650 previous results. The three hypotheses are still supported. There may be big differences between listed and non- listed samples, thus in order to better reveals the impact of the liquidity expectation on the credit rating we distin- guish the listed and non-listed samples and respectively conduct regression in the Model 11 and Model 12. We control the influences of the financial risk (Intercover and Lev), the corporations’ fundamental characteristics (Size and Age), the feature of the securities (Guarantee and Ind- Sup), the macro-economic cycle (GDPgrow), the owner- ship characteristics (State, V and Deviation), the account- ing information quality (Big 4 and Top10), and the rating agencies (the Emirates International Credit Rating Co. (EICR), Ltd., the Integrity of the International Credit Rat- ing Co. (IICR), Ltd., Joint Credit Rating Co. (JCR), Ltd. and Shanghai New Century Ratings Co., Ltd. (SHNCR)) on credit rating. There exist differences on the financing ability between listed companies and non-listed compa- nies, but both of them’ financing ability (ROE) are sig- nificantly positive with the credit rating, which supports hypothesis 1. The coefficients of the liquidity expectation (CPI) are significantly negative in Model 11 and Model 12, which supports the hypothesis 2. The coefficient of CPI × ROE is significantly negative, meaning that the poor liquidity expectation can reduce the positive impact of the financing ab ility on the credit rating, so it su pports the hypothesis 3. In the analysis above, the credit ratings are divided into three levels by the major categories (AAA, AA and A levels), but the AAA level includes AAA and AAA–, the AA can be divided into AA+, AA and AA–, and the A includes A + A, A– and two BBB+, there may be some differences among the same general category, so this pa- per uses more detailed ratings for the explanatory vari- ables in Model 13. We assigned 0 to the lowest rating BBB+, and assigned 8 to the most senior rating AAA. The regression model is still the ordered Logit model. The results showed that only the coefficient of CPI × List is negative but not significant, the signs of other variables are consistent with previous. In summary, the results in Table 6 further support our three hypotheses. The coefficient of the ownership property (State) is sig - nificantly positive in the above regression analysis, mean - ing that state-owned enterprises have a distinct advantage than non-state-owned enterprises on credit rating and that probably because of the difference of the two types of companies on the financing ability. To learn more about the impact of the state-owned enterprises and non state- owned enterprises’ financing ability on the credit rating, and how the liquidity expectation influences these two types of companies, we distinguishes the state samples and non- state samples respectively. To be succinct, we don’t show the result in text. In the regression for state samples, the coefficient of the List is not significant, that means for the state-owned en- terprises, whether listed or not has no significant influ- ence on the credit rating. Many group companies have good qualification, but they are not listed. Listed or not can’t be fully representative for the financing ability of the state- owned enterprises. The coefficient of ROE is significant ly positive, that means the higher the profitability of the en- terprises, the stronger the financing ability, the h igher the issuer credit ratings. The coefficient of the CPI is nega- tive, but not significantly, indicating that the poor liqu id- ity expectation doesn’t have significant effect on the s ta te- owned enterprises, the explanation is that the large state- owned enterprises can still get l oan from the banks or raise funds on the capital markets. Although the coefficient of CPI × List is negative, it isn’t significant. The implica- tion of that the tightened monetary policy has little im- pact on the financing ability of the state-owned enterpris es whether they are listed or not. While the coefficient of CPI × ROE is significantly negative, and that reveals the liquidity expectatio n will affect the po sitive impact of th e financing ability on the credit rating which characterized by the profitability. In short, the regression of the state samples shows that the financing ability can increase the credit rating, and the liquidity expectation has a certain influence on the credit rating, bu t it is relatively limited. In the regression for non-state samples, the coefficient of List is significantly positive, that shows for non-state corporations only the listed enterprises can solve the pro b - lem of financing very well and improve their financing ability, thereby enhancing the bond the principal rating. The coefficient of ROE is po sitive, but it isn’t significant. The coefficient of CPI is significantly negative, that is, the impact of the liquidity expectation for the non-state- owned enterprises is very obvious, when the liquidity ex- pected to shrink, the non-state-owned enterprises are first to be influenced, the financing ability of them will be in- hibited and the credit ratings of the non-state enterprises will be lowered, which is shown by the significantly neg a - tive coefficients of CPI × List and CPI × ROE. In short, the regression of the non-state samples shows that the liquidity expectation has great impact on the credit rating of the non-state enterprises. The main reason is that the financing channels of non-state-owned enterprises are rel a- tively narrow; the financing ability of the non-listed and non-state-owned enterprises is even lower, so much low er for the issuer’s credit rating. 6. Conclusions From 2005 to 2007, the global economy was in boom. While the subprime mortgage crisis that broke out in the end of 2007 made the global economy fell into recession from 2008 until now, an d i t even become worse. However, during this p eriod , the main r ating of th e issuing ente rp r is es on China’s short-term financing bills market presents the Copyright © 2012 SciRes. ME  S. TIAN ET AL. 651 opposite trend. That is wh en the market and the economy upsurge, the bond principal rating is relatively poor; wh en the market and economy downturn, the bond principal rat- ing is relatively h igh. In oth er words, the rating s of short- term financing bills show a count er-cyclical phenomenon. This paper proposes a theoretical explanation for this phenomenon. That is the liquidity hypothesis. During the period of economic prosperity , m arket li quidity and capital is relatively abundant, therefore even the companies with poor ratings have access to gain funds. When the market downturns, liquidity is poor, and there are not enough funds on the market, the companies with poor main rat- ing may fall to finance due to the lack of access to funds. Therefore, the liquidity of the market causes the bond rat- ing shows the counter-cyclical phenomenon. The empiri- cal research supports this hypothesis. Thus, when the liquidity expectation is bad, the credit rating of corpora- tions will be lowered. Even the enterprises with strong financing ability, its cred it rating will be impacted by the negative expectation of the liquidity. In addition, the credit rating is also affected by the risk of corporate finance, fundamentals characteristic, the issue characteristics of the bond, the ownership characteristics, the quality of the in f- ormation, as well as the impact of the rating agencies. As we know few researches on credit rating in China mentioned the “cyclical phenomenon” and study the rela- tionship between credit rating and macro-economy. Our paper provides some evidences for this field and shows distinguish for China credit rating market from developed markets. Although in our paper we investigate the rela- tionship between credit rating and macro-factors, leaving the credit rating untouched, which may reflect the “cy- clical phenomenon” more evidently. Further work should be done on the change of credit rating in the future. REFERENCES [1] W. F. Treacy and M. S. Carey, “Credit Risk Rating at Large US Banks,” Federal Reserve Bulletin, Vol. 84, No. 11, 1998, pp. 897-921. [2] P. Nickell, W. Perraudin and S. Varotto, “Stability of Rat- ing Transitions,” Journal of Banking and Finance, Vol. 24, No. 1-2, 2000, pp. 203-227. doi:10.1016/S0378-4266(99)00057-6 [3] J. Amato and C. Furfine, “Are Credit Ratings Procycli- cal?” Journal of Banking and Finance, Vol. 28, No. 11, 2004, pp. 2641-2677. doi:10.1016/j.jbankfin.2004.06.005 [4] Y. F. Dong, “The Rare Continuous Downgrade on the Domestic Bond Market—Facing a New Round of Credit Crisis,” First Financial Daily, 11 September 2011. [5] M. C. Robert, “On the Pricing of Corporate Debt: The Risk Structure of Interest Rates,” Journal of Finance, Vol. 29, No. 2, 1974, pp. 449-470. [6] E. Jones, S. Mason and E. Rosenfeld, “Contingent Claims Analysis of Corporate Capital Structures: An Empirical Investigation,” The Journal of Finance, Vol. 39, No. 3, 1984, pp. 611-625. doi:10.1111/j.1540-6261.1984.tb03649.x [7] E. I. Altman, “The Success of Business Failure Prediction Models: An International Survey,” Journal of Banking and Finance, Vol. 8, No. 2, 1984, pp. 171-198. doi:10.1016/0378-4266(84)90003-7 [8] E. J. Elton, M. J. Gruber, D. Agrawal and C. Mann, “Ex- plaining the Rate Spread on Corporate Bonds,” Journal of Finance, Vol. 56, No. 1, 2001, pp. 247-261. doi:10.1111/0022-1082.00324 [9] Y. Jafry and T. Schuermann, “Measurement, Estimation, and Comparison of Credit Migrati on Matrices,” Journal of Banking and Finance, Vol. 28, No. 11, 2004, pp. 2603- 2639. doi:10.1016/j.jbankfin.2004.06.004 [10] E. Altman and H. Rijken, “How Rating Agencies Achieve Rating Stability,” Journal of Banking and Finance, Vol. 28, No. 11, 2004, pp. 2679-2714. doi:10.1016/j.jbankfin.2004.06.006 [11] E. J. Elton, M. J. Gruber, D. Agrawal and C. Mann, “Factors Affecting the Valuation of Corporate Bonds,” Journal of Banking & Finance, Vol. 28, No. 11, 2004, pp. 2747-2767. doi:10.1016/j.jbankfin.2004.06.008 [12] W. Perraudin and A. P. Taylor, “On the Consistency of Ratings and Bond Market Yields,” Journal of Banking and Finance, Vol. 28, No. 11, 2004, pp. 2769-2788. doi:10.1016/j.jbankfin.2004.06.009 [13] A. W. Butler and L. Fauver, “Institutional Environment and Sovereign Credit Ratings,” Financial Management, Vol. 35, No. 3, 2006, pp. 53-79. doi:10.1111/j.1755-053X.2006.tb00147.x [14] K. Carling, T. Jacobson, J. Linde and K. Roszbach, “Corporate Credit Risk Modeling and the Macroecon- omy,” Journal of Banking & Finance, Vol. 31, No. 3, 2007, pp. 845-868. doi:10.1016/j.jbankfin.2006.06.012 [15] Q. Liang, “The Comparison of the Western Securities Rating System and Its Implications for China,” Securities Market Herald, Vol. 88, No. 11, 1999, pp. 41-44. [16] Y. Q. He and Z. B. Fang, “The Bond Credit Rating and the Credit Risk,” Management Science, Vol. 16, No. 4, 2003, pp. 45-50. [17] C. Chen and Z. M. Guo, “The Corporate Bond Financing, Financial Risk and the Bond Ratings of China,” The Con- temporary Finance & Economics, Vol. 279, No. 2, 2008, pp. 39-48. [18] P. He and M. Jin, “The Influence of Credit Rating in the Bond Market in China,” Journal of Financial Research, Vol. 358, No. 4, 2010, pp. 15-28. [19] M. G. Yu and H. B. Pan, “The Political Relationship, the Institutional Environment and the Bank Loans of the Pri- vate Enterprises,” Management World, Vol. 179, No. 8, 2008, pp. 9-21. [20] D. L. Luo and L. M. Zhen, “The Private Control, Political Relationship and the Corporate Finance Constraints,” Fi- nancial Research, Vol. 342, No. 12, 2008, pp. 164-178. [21] C. Chang, G. Liao, X. Yu and Z. Ni, “Information from Relationship Lending: Evidence from Loan Defaults in China,” Working Paper, 2009. Copyright © 2012 SciRes. ME  S. TIAN ET AL. Copyright © 2012 SciRes. ME 652 [22] J. Fan and T. J. Wong, “Do External Auditors Perform a Corporate Governance Role in Emerging Markets? Evi- dence from East Asia,” Journal of Accounting Re- search, Vol. 43, No. 1, 2005, pp. 35-72. doi:10.1111/j.1475-679x.2004.00162.x [23] S. Zhu, “The Characteristics of Ultimate Controller and the Informativeness of Accounting Earnings,” China Ac- counting and Finance, Vol. 8, No. 3, 2006, pp. 1-29. [24] S. Zhu and D. L. Xia, “The Accounting Conservatism, Financing Constraints and the Capital Investment of the Listed Companies,” Finance and Economics, Vol. 36, No. 6, 2009, pp. 69- 79. [25] R. Cantor and F. Packer, “Differences of Opinion and Selection Bias in the Credit Rating Industry,” Journal of Banking & Finance, Vol. 21, No. 10, 1997, pp. 1395- 1417. doi:10.1016/S0378-4266(97)00024-1
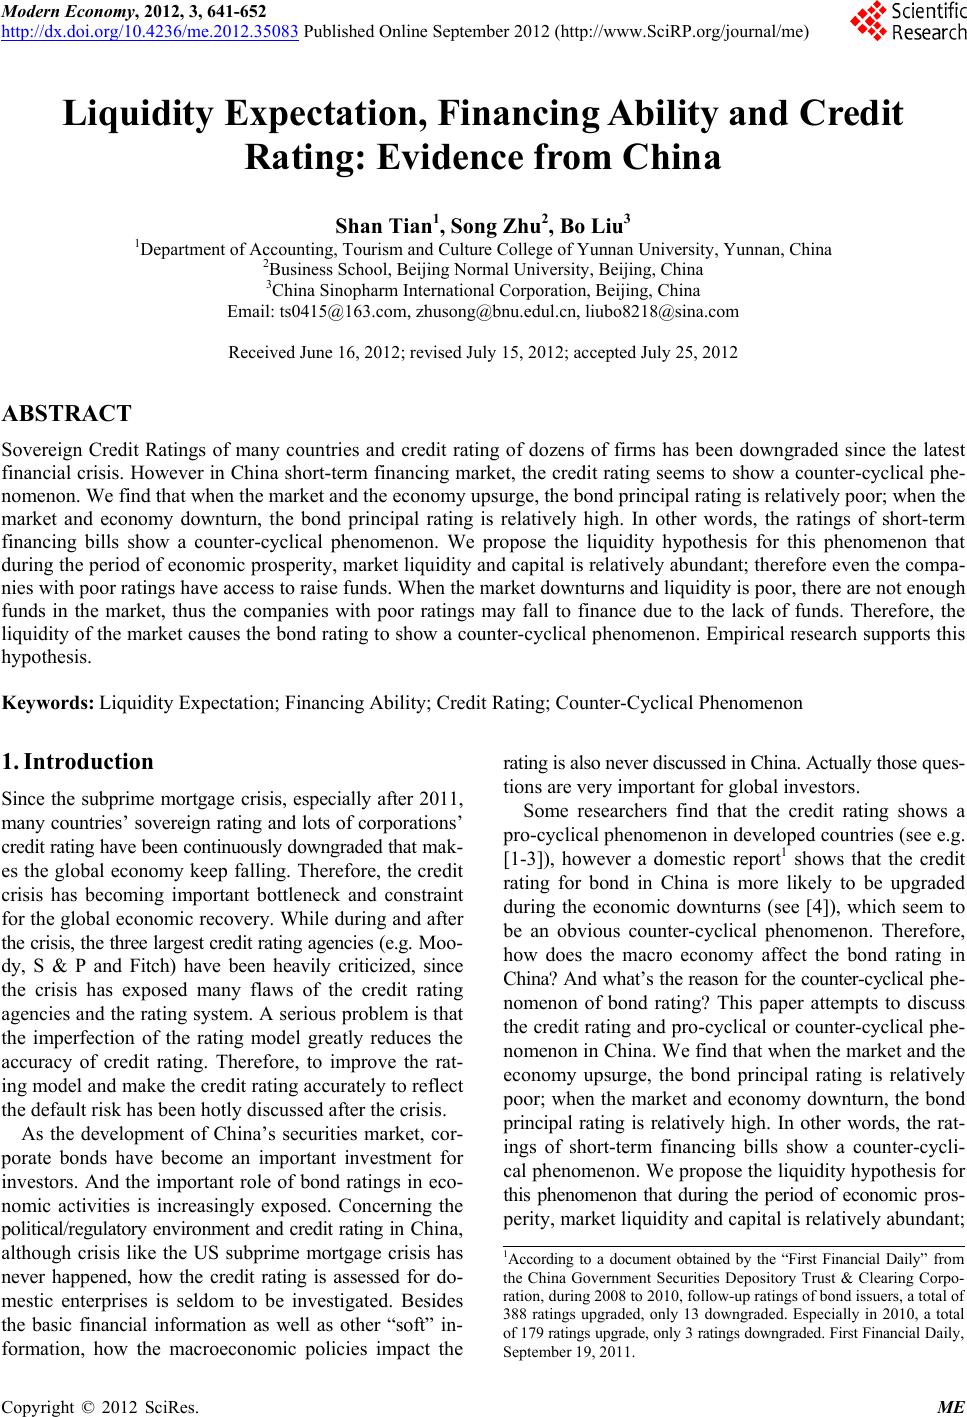
|