Modern Economy, 2012, 3, 578-583
http://dx.doi.org/10.4236/me.2012.35076 Published Online September 2012 (http://www.SciRP.org/journal/me)
Analysis for Regional Differences and Influence Factor of
Rural Income in China
Jinyu Chen, Wenxiu Zhang
College of Economic and Management, Sichuan University of Agriculture, Chengdu, China
Email: jinyucjy@163.com
Received May 2, 2012; revised June 2, 2012; accepted June 13, 2012
ABSTRACT
The purpose of the present study is to analyze the space division characteristics and trends of the income gap between
the rural resident in China using a statistical method, which based on the provincial panel rural resident’s income series
plan data from 1978 to 2008. The results of the study suggest that the east regional has the largest income disparity, the
west has the second place, and central has minimum income gap. At last, the regression model was build based on
Cobb-Douglas production function by combining the conversion factors and the influence of urbanization area. And the
validity of the models was also demonstrated by regression analysis using 30 provincial or region’s panel data.
Keywords: Cobb-Douglas; Regional Analysis; Rural Income; Statistical Methods
1. Introduction
Nowadays, our China has entered a well-off society with
rapid development of national economy and the income
of urban and rural residents greatly raised after 32 years
of reform and opening. However, there has very big dis-
parity in rural regional economy development level with
growth of the economy. Due to the imbalance of regional
economic development, the income gap inevitable deri v e d
in rural, so that the vast rural residents can not equal to
share the benefits of economic growth. Rural residents’
income is the biggest concern of the farmers, the “three
issues concerning farmers” is virtually the core issue.
Empirical studies our country rural regional gap and the
income of the residents of the influential factors were
analyzed for the government establish related policy, ef f ec -
tively achieve the farmers’ income, narrowing the income
gap between the areas, and have very important practical
significance. Since the 1990s, many scholars in China for
the actual situation in our country, in succession to our
country income inequality problem carried on a series of
research. They also include some scholars from different
Angle to our country rural income gap of residents of the
research, for example, Zhang [1] and Xue [2] through to
the sample data, the empirical analysis to our country
rural residents’ income and the present condition of the
income distribution, and the difference of the forming
reasons for the differences have been deeply studies.
Wan [3] also puts forward a framework of decompositio n
inequality, on the basis of the quantitative analysis in
rural areas in China between the sources of income ine-
quality. In the midwest farmer income difference for
comparative studies, at the same time, the influence fac-
tors of the analysis that the amount of salary income has
become a farmer income and the difference of the influ-
ence factors [4]. In fact, affect China’s rural residents
income inequality are various factors. For example, M eng
and Wu [5], the research of the difference that endow-
ment the rural regional income difference, but Wan [3] of
the research is think geography and capital investment
differences influence is China’s rural resident’s income
inequality is the most important factor. In previous stud-
ies, most research results showed that China’s rural re-
gional income inequality on the rise and widening in-
come gap is the reason for the uneven development of
the non-agricultural industries. For the rural non-agricul-
tural industries, on the one hand, as Yuan [6], the study
points out, the non-agri cultural industries as a major so u rc e
of increasing farmers’ income has been established and
the position and consolidating, increasing the income of
farmer’s ability to contribute there is an obvious trend
increase. On the other hand, the rural non-agricultural
employment unequal opportunity brought about by the
regional economic development is not balanced and g ra du-
ally become decided to rural regional income disparity
degree of the dominant factors of regret of be, how to
influence non-agriculturalization of rural residents’ income
as the important factor into the mathematical model, so
that from the point of view of measurement for empirical
research, have been reported in the literature. This paper
studies with the provincial panel statistical data, the em-
pirical analysis since China’s reform and opening in the
C
opyright © 2012 SciRes. ME
J. Y. CHEN, W. X. ZHANG 579
east west three big economic zone internal and nation-
wide rural regional income gap, and reveals the income
gap between rural the space distribution features and
changes with time trend at the same time, this paper also
will be on the analysis of the influence of the main fac-
tors of rural residents’ income building regression model
based on the characteristics of the regression model is
introduced in the model in the conversion degree and
urbanization coefficient, from the point of view of the
measurement analysis to study in a rural urbanization
factors on non-agriculturalization of factors and rural resi-
dents of the income distribution effects, this kind of in-
fluence in fact also reflects on the rural area of the influ-
ence of income gap.
2. China’s Rural Residents of the Gap
between the Distribution Features and
Trends
2.1. Measure Index Selection and Data Sources
Most of the Gini coefficient is to measure the distribution
of income inequality in the existing literature. And the
Gini coefficient is the advantage of can be used as the
degree of polarization between the rich and the criterion.
In our country, the gap between rich and poor is app ro ac h-
ing the red lines already is social allow und isputable fact.
The Gini coefficient has some shortcomings: First, the
Gini coefficient, many of the calculation method, not a
unified formula of the second, Gini coefficient is suscep-
tible to the effects of th e income gr ou p in the v alu e of th e
specific calculation difference [2].
Because of this study is to investigate the rural resi-
dents in China on the income gap between the space dis-
tribution and the tendency of changes over time, so just
described in statistical data of discrete coefficients as
discrete degree of the gap between the measure indexes
can achieve the purpose of the research. A region the in-
come of the residents in the area is in fact the difference
degree resident’s income distribution of discrete degree.
In practical application, usually through variance and stan-
dard deviation as discrete degree of measure value but
variance and standard deviation can only reflect the ab-
solute value of the dispersion degree of statistical data,
and the specific data by the size of the original variables
itself on the level of influence, on the other hand also
depends on the use of measurement. In order to eliminate
the statistical variable values for level or measuring unit
of different degree measure the influence of discrete val-
ues, need to use discrete coefficients [6] the discrete coef-
ficients for different groups will statistical data of discr ete
degree discrete coefficients can compare simply by the
sample data with the standard deviation of average than
calculation and Gini coefficient, compared with that by
using the advantages of discrete coefficient calculation
method is single-minded, easy to use, easy to understand,
and simple calculation is reasonable. This paper analyzes
our country rural area for income inequality data from
the all China statistical year book published between 1978
and 2008 provincial panel of the original statistical data.
2.2. The Income Gap of Residents, Distribution
Characteristics and Trends
In order to further analysis nationwide and in east west
three economic zone of rural resident’s income difference s
within the distribution and change trend, using the China
Statistical Yearbook published each period of each area p e r
capita net income of rural households the statistical data
of the rural area calculation reflect income disparity degree
of discrete coefficient value, the results listed in Table 1.
Worth that China statistical yearbook of 1978-1990,
1981-1984, 1986-1989 in the region about rural house-
holds of per capita net income of statistical data in addi-
tion, still lack data in 1991 and 1991, according to the ad-
jacent years of data, using the Newton (Newton) interpo-
lation formula added 1991 data, which again 1991 income
distribution calculated the discrete coefficient values.
From Table 1 we can found that the bigger of the dis-
crete coefficients in income distribution, the bigger of the
income gap, and vice versa.
Table 1. China’s rural per capita net income of regional
distribution of discrete coefficients*.
Year Eastern Central Western Nationwide
1978 0.34 0.23 0.23 0.33
1980 0.26 0.14 0.10 0.27
1985 0.26 0.07 0.11 0.21
1990 0.35 0.14 0.14 0.39
1991 0.35 0.16 0.15 0.41
1992 0.35 0.17 0.16 0.43
1993 0.36 0.13 0.15 0.46
1994 0.34 0.15 0.12 0.45
1995 0.34 0.13 0.13 0.46
1996 0.29 0.12 0.13 0.42
1997 0.30 0.10 0.17 0.42
1998 0.28 0.09 0.15 0.40
1999 0.28 0.08 0.16 0.41
2000 0.29 0.06 0.14 0.43
2001 0.29 0.06 0.13 0.44
2002 0.30 0.01 0.13 0.44
2003 0.30 0.06 0.13 0.44
2004 0.29 0.07 0.14 0.42
2005 0.31 0.07 0.15 0.45
2006 0.34 0.06 0.15 0.45
2007 0.31 0.05 0.16 0.43
2008 0.31 0.06 0.17 0.42
Note: The data from China Statistical Yearbook (1996-2009).
Copyright © 2012 SciRes. ME
J. Y. CHEN, W. X. ZHANG
580
1) From the income gap between the space distribution
look, the east area of the income distribution of discrete
coefficient most, the western is the second smallest, and
middle belt minimum, shows that the Chinese economy
developed eastern economic zone rural residents income
gap is the largest, and the west is the second smallest,
and the income gap between the central and the minimu m
a result and at the beginning of this century Zhang [1]
through the analysis of the income of Gini coefficient is
the same results nationwide and the income distribution
of discrete coefficients of east west high in any economic
zone, indicates that the nation within the scope of the
income gap between east west than in any economic zone
of internal income gap within national rural income gap
of residents more than the cause of the local area in the
west of east of internal regions all the development of the
rural economy has area this similarity including resource
endowment similarity of similar geography.
2) From the time series on look, whether in the western
region, or nationwide had a common characteristics, that
is the first several years of reform and opening, the income
distribution of discrete coefficients have a short-term d rop
process, explained this years China’s rural income gap of
residents experienced a short-term this process of shrin-
king about from close to the mid 1980s began, the in-
come gap between rural residents began to expand from
the overall perspective, our country rural area of the gap
between the change of the features are clear from the last
century because of 1978 to the 80s, our country rural
income gap of residents have experienced first to widen
the process of narrow, so the following discussion from
the 1990s to the east zone, from 1990 to 2008, the ch ange
of discrete coefficients can be divided into three stages.
Because our country is known for her massive land, the
vast rural areas are common location distributions and
resources endowment imbalance, coupled with countries
don’t balance development policy and other reasons,
China’s rural areas will naturally formed differences in
the levels of economic development, especially the more
developed eastern region and the western underdeveloped
region this difference between the more obvious this dif-
ference is, the bigger the is different regional income
disparity among rural residents is bigger also, and thus
opened the nationwide rural income gap of residents in
order to address this, this article will east central rural
residents’ per capita and the west as a comparison, as
shown in Table 2.
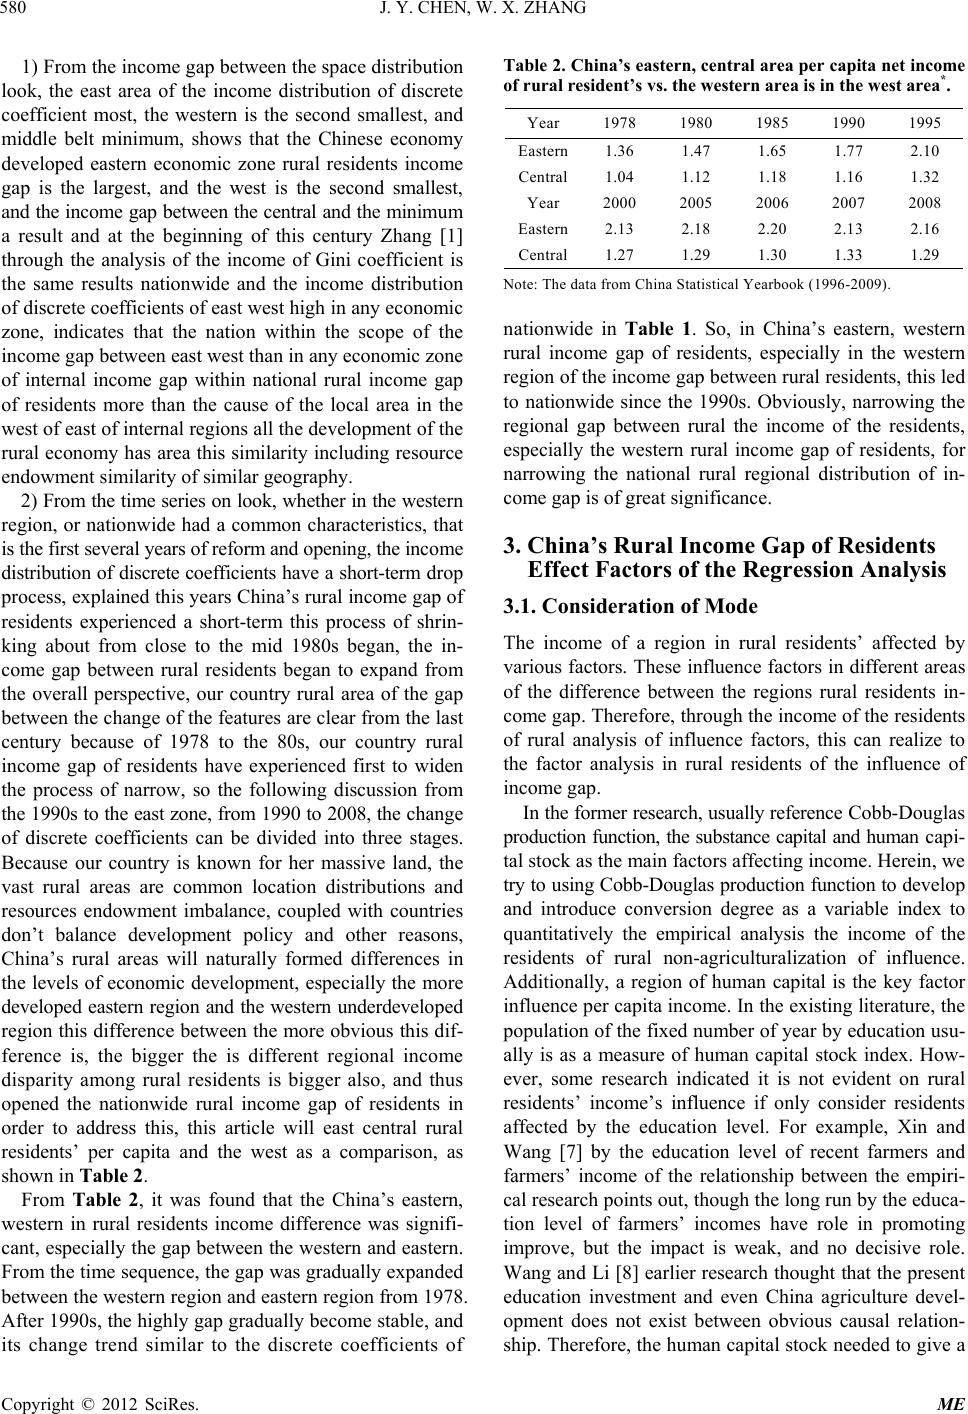
From Table 2, it was found that the China’s eastern,
western in rural residents income difference was signifi-
cant, especially the gap between the western and eastern.
From the time sequence, the gap was gradually expanded
between the western region and eastern region from 1978.
After 1990s, the highly gap gradually become stable, and
its change trend similar to the discrete coefficients of
Table 2. China’s eastern, central area per capita net income
of rural resident’s vs. the western area is in the west area*.
Year 1978 1980 1985 1990 1995
Eastern1.36 1.47 1.65 1.77 2.10
Central1.04 1.12 1.18 1.16 1.32
Year 2000 2005 2006 2007 2008
Eastern2.13 2.18 2.20 2.13 2.16
Central1.27 1.29 1.30 1.33 1.29
Note: The data from China Statistical Yearbook (1996-2009).
nationwide in Table 1. So, in China’s eastern, western
rural income gap of residents, especially in the western
region of the income gap between rural residents, this led
to nationwide since the 1990s. Obviously, narrowing the
regional gap between rural the income of the residents,
especially the western rural income gap of residents, for
narrowing the national rural regional distribution of in-
come gap is of great significance.
3. China’s Rural Income Gap of Residents
Effect Factors of the Regression Analysis
3.1. Consideration of Mode
The income of a region in rural residents’ affected by
various factors. These influence factors in different areas
of the difference between the regions rural residents in-
come gap. Therefore, through the income of the residents
of rural analysis of influence factors, this can realize to
the factor analysis in rural residents of the influence of
income gap.
In the former research, usually reference Co bb -Do ug la s
production function, the substance capital and human c api-
tal stock as the main factors affecting inco me. Herein, we
try to using Cobb-Douglas production function to develo p
and introduce conversion degree as a variable index to
quantitatively the empirical analysis the income of the
residents of rural non-agriculturalization of influence.
Additionally, a region of human capital is the key factor
influence per capita income. In the existing literature, the
population of the fixed number of year by education usu-
ally is as a measure of human capital stock index. How-
ever, some research indicated it is not evident on rural
residents’ income’s influence if only consider residents
affected by the education level. For example, Xin and
Wang [7] by the education level of recent farmers and
farmers’ income of the relationship between the empiri-
cal research points out, though the long run by the educa-
tion level of farmers’ incomes have role in promoting
improve, but the impact is weak, and no decisive role.
Wang and Li [8] earlier research thou ght that the present
education investment and even China agriculture devel-
opment does not exist between obvious causal relation-
ship. Therefore, the human capital stock needed to give a
Copyright © 2012 SciRes. ME
J. Y. CHEN, W. X. ZHANG 581
deeper level of meaning.
Because of people’s intelligence play by the environ-
ment factors, such as rural areas of the human condition
is the impact the quality o f human capital is an impor tant
external factors, different regions and different shape of
culture, and the concept, farmers in the cultural differ-
ences in outlook will cause its accept and learning ad-
vanced production technology of the difference, which
affect the quali ty of the human capital. No rmally, the su r-
rounding rural town than remote mountain area should be
has more superior humane conditions, thus more help to
the rural human capital is advanced. The form of aware-
ness and skill, the stronger in the interpersonal and the
spread of knowledge and information. Consider these
factors, the paper will be a rural area labor education leve l
and the level of urbanization by combining into a new
human capital stock index, from further level consider
human capital for the farmers the influence of the village
residents’ income.
3.2. The Considering of Regression Model
Herein, according to Cobb-Douglas production function,
the rural residents’ income and its main in fluence factors
could be shown using following function:
iii
YAKHZ
i

(1)
Herein, the subscript i represents a province or a re-
gion. Yi, Ki, Hi and Zi are rural per capita net income per
capita, material capital stock, human capital and non-agr-
iculturalization degree; A is the technical level. α, β and γ
are parameters. So, the Equation (1) could be revised:
ln lnlnlnln
iii
YA KHi
Z

 (2)
3.3. Variables Index
3.3.1. The Mate ri al Ca pi tal Sto c k Ind e x K
This article with the provinces or region fixed assets in-
vestment divided by total rural population in the area as
the people in the rural areas total material capital stock.
3.3.2. Human Ca pi tal Storage H
Most of the literature of the human capital formation to
education investment, for example, Ma and Zhang [9]
with more than six years old by the education of fixed
number of year of average population to say human capital
stock. Chen Jie [10] according to a labor accepts different
degree education area population estimates for the pr opo r-
tion of human capital. Her ein, consider education and to wn
environment on the dual effects of human capital, the hu-
man capital stock could be showed as fol lowing Equati on:
H
Q
(3)
λ and Q are urbanization coefficient and education
factors. And then, the education factors could be revised
Equation (4) acco rding to Chen Jie (2007):
6
1
j
j
j
Qq
h
(4)
qj is the proportion of the labor force. hj is conversion
coefficients and the primary education is 1, junior high
school is 1.5, high school is 2; technical secondary school
is 2.5, college degree and above is 4 and illiteracy is 0.5.
3.3.3. Convers i on Degree Z
Herein, the degree of non-agriculturalization will be de-
fined as a percentage of the agricultural, forestry, animal
husbandry and fishery workers to all of the employees.


agricultural, fore stry and animal
100%
N totalN
ZNtotal
(5)
3.3.4. Data Source of Regression Analysis
Regression analysis of the sample data, including provinc e s
(including autonomous regions and municipalities) per
capita net income of rural households, the total invest-
ment of fixed assets, rural areas population, rural residen ts
of family education, labor force of the urban population
proportion of the total population, rural workers number
and rural ecological-economic from industry personnel
number.
Considering the between the integrity of the statistical
data in recent years and can obtain sex , in addition to the
proportion of the total pop ulation of the urban population
comes from the China statistics Yearbook published the
2005 census data outside, the rest data are all derived
from the 2006 edition of the rural China statistical year-
book male cloth of the 2005 census data. Due to the lack
of the Tibet autonomous region in 2005, total investment
of rural fixed assets statistical data, this paper will except
in Tibet outside of the 30 provinces (autonomous r egions
and municipalities). According to the above data will be
above all variables in the proper arrangement the defini-
tion of index, summarized in Table 3.
3.4. The Results of Regression Analysis
Accord i n g to th e regression model of linear expression (2)
of multiple linear regression and the results summarized
in Table 4.
Multiple linear regression model of significant inspec-
tion including regression coefficient of significant test and
regression equation of significant insp ection was listed in
Table 4. The regression coefficients t showed that the per
capita material capital stock, stock of human capital and
degree of non-agricultural have significant affect to per
capita net income of rural residents. At the s ame time, th e
F inspection, it is known that the linear Equation (2) by
Copyright © 2012 SciRes. ME
J. Y. CHEN, W. X. ZHANG
582
Table 3. The provincial panel data of regression analysis.
Region PN K Q λ H Con (%)
Beijing 7346 6071 1.82 0.84 1.52 68.15
Tianjin 5580 3301 1.55 0.75 1.1655.4
Hebei 3482 1534 1.50 0.38 0.57 44.06
Shanxi 2891 680 1.45 0.42 0.61 41.29
Neimeng 2989 657 1.38 0.47 0.65 23.39
Liaoning 3690 2290 1.51 0.59 0.89 38.36
Jilin 3264 1101 1.38 0.53 0.73 26.72
Heilongjiang 3221 814 1.44 0.53 0.76 26.58
Shanghai 8248 9199 1.74 0.89 1.55 75.93
Jiangsu 5276 3657 1.46 0.50 0.73 60.25
Zhejiang 6660 4578 1.41 0.56 0.79 65.76
Anhui 2641 760 1.34 0.35 0.48 39.89
Fujian 4450 1344 1.37 0.47 0.65 47.28
Jiangxi 3129 830 1.37 0.37 0.51 41.97
Shandong 3931 2891 1.50 0.45 0.68 45.91
Henan 2871 1063 1.44 0.31 0.44 34.19
Hubei 3099 724 1.40 0.43 0.61 42.99
Hunan 3118 776 1.42 0.38 0.52 34.40
Guangdong 4691 1686 1.47 0.61 0.89 50.36
Guangxi 2495 435 1.46 0.34 0.49 33.94
Hainan 3004 531 1.44 0.45 0.65 24.45
Chongqing 2809 642 1.32 0.45 0.59 42.43
Sichuan 2803 860 1.34 0.33 0.44 39.03
Guizhou 1877 302 1.21 0.27 0.33 34.44
Yunnan 2042 519 1.19 0.29 0.35 17.59
Shanxi 2053 506 1.41 0.38 0.53 33.95
Gansu 1980 406 1.27 0.30 0.38 29.78
Qinghai 2152 532 1.11 0.39 0.44 30.81
Ningxia 2509 1477 1.18 0.42 0.49 33.68
Xinjiang 2483 1305 1.33 0.37 0.50 14.81
Note: PN: Per net income (RMB).
Table 4. The results of regression analysis based on 30 prov-
inces or region.
Regres sion coef fici ent
lnA α β γ
F R R2
6.27 0.18 0.48 0.21
18.31* 4.21* 5.58* 4.04*107.27** 0.96 0.92
Note: t test values of the regression coefficients in the brackets. *above
0.5%, **above 0.1%.
the regression equation of the expression is significant,
which has verified regression model type (1) is correct.
The material capital, human capital and the degree of non-
agriculturalization of rural residents’ income have sig-
nificant positive effect. The result of Table 4 indicated
that the elasticity coefficient of human capital stock was
significantly higher than other two explanatory variables
α and γ. It showed that the human capital accumulation to
the contribution of rural residents’ income is higher than
the other two explain the contribution of variables. The
human capital accumulation to rural residents’ income
contribution represen ts the rural labor force by education
level and the level of urbanization in the comprehensive
effect. And some other research of the comparison results
in this paper, the urbanization factor, the introduction of
the human capital to did raise the rural residents, the co n-
tribution rate of income, which has verified based on hu-
man capital stock of urbanization factor into the if, that is,
with the area to raise the level of urbanization, can im-
prove the rural areas of the human condition and improve
the quality of rural labor force and high quality of rural
human capital formation is an intangible investment.
4. Conclusions
According to this article of China’s rural residents’ in-
come of the regional differences and effect factors of the
empirical results, we can draw the main conclusions are
as follows:
1) China’s rural income gap of residents, the space dis-
tribution features of performance: the eastern economic
zone rural resident’s income g a p is the largest, the west is
the second smallest, and central minimum. Compared with
the local region, there has a bigger income gap of nation-
wide rural than the eastern and western.
2) Our country rural income gaps of residents have the
change tendency of the phases since the reform and open.
Although different rural area through different stages of
the change of the income gap, but there is a common
characteristics: that is whether the eastern, central and
western areas or national scope, the beginning of reform
and opening up a few years, rural income gap of residents
have experienced a short-term narrowing of the process,
then began to expand the income gap. Across the country,
from 1990-2008, this paragraph of a long period, the in-
come gap between rural residents while high and low,
but little variations, the income gap widening rural resi-
dents have bee n running high.
3) In China’s eastern, western, obvious gap since re-
form and opening up, the gap with time and the trend of
rural residents nationwide the income gap between the
change trend, the basic consensus, which show that a fact,
China’s eastern between western rural income gap of
residents are caused by the national rural high income
gap of residents of the main causes.
4) Using regression model, the empirical analysis shows
that: firstly, the degree of non- agriculturalization of rural
resident income are significant positive role, the devel-
opment of the non-agricultural industries has become an
important means of rural residents’ income; the second,
the regression model can significantly enhance human
Copyright © 2012 SciRes. ME
J. Y. CHEN, W. X. ZHANG
Copyright © 2012 SciRes. ME
583
capital to the contribution of rural residents income; las t ly ,
aim to speed up the major and medium city as the leading
urbanization construction, not only to narrow the gap
between urban and rural areas, and to improve the rural
labor quality, promote the agricultural production and
peasants’ income also has import a nt practi c al si gni ficance.
5. Acknowledgements
The authors gratefully acknowledge the National Social
Science Fund (No.08XJY011) and Sichuan Provincial So-
cial Science Key Projects Fund (No. 09 SA096) for f inan-
cial support.
REFERENCES
[1] X. H. Zhang, “China’s Rural Resident’s Income Distribu-
tion Empirical Description and Analysis of the Change,”
Chinese Rural Economy, No. 6, 2001, pp. 12-18.
[2] Y. F. Xue, “China’s Rural the Distribution of Income
Inequality and Its Regional Differences,” Chinese Rural
Economy, No. 5, 2005, pp. 26-34.
[3] X. F. Xin, F. Qin and X. Q. Wang, “The Midwest Farme r
Income and the Difference of the Influence Factors Analy -
sis,” Chinese Rural Economy, No. 2, 2008, pp. 40-52.
[4] G. Wan, “Accounting for Income Inequality in Rural
China Regression-Based Approach,” Journal of Com-
parative Economics, Vol. 32, No. 2, 2004, pp. 348-363.
doi:10.1016/j.jce.2004.02.005
[5] X. Meng and H. X. Wu, “Household Income Determina-
tion and Regional Income Differential in Rural China,”
Asian Economic Journal, Vol. 12, No. 1, 1998, pp. 65-88.
doi:10.1111/1467-8381.00052
[6] W. Yuan, “Statistics,” Higher Education Press, Beijing,
2009.
[7] L. Xin and Y. H. Wang, “Farmers Education Level and
Farmers’ Income by the Relationship between the Em-
pirical Researches,” Chinese Rural Economy, No. S1,
2007, pp. 93-100.
[8] X. Q. Wang and J. L. Li, “An Empirical Study on the
Relation of Investment for Education and Agricultural
Development,” China Rural Survey, Vol. 58, No. 5, 2004,
pp. 44-49.
[9] B. Ma and F. R. Zhang, “An Empirical Analysis of the
Factors Affecting the Gap between Urban and Rural Resi-
dents,” Chinese Rural Economy, No. 2, 2008, pp. 53-59.
[10] J. Chen, “A Structural Analysis of the Human Capital’s
Contribution to Economic Growth,” The Journal of Quanti-
tative & Technical Economics, No. 8, 2007, pp. 60-69.