 Modern Economy, 2012, 3, 498-507 http://dx.doi.org/10.4236/me.2012.35065 Published Online September 2012 (http://www.SciRP.org/journal/me) Shocks and Prospects for a Pacific Islands Currency Union Willie Lahari c/-Economics Department, University of Otago, Dunedin, New Zealand Email: wlahari@gmail.com Received October 5, 2011; revised November 4, 2011; accepted November 13, 2011 ABSTRACT This analysis re-kindles the debate on the feasibility of a Pacific Islands currency union in view of the recent expansion and consolidation of regional strategies such as the Pacific Plan and the PACER Plus. Limited consideration has been given to the proposition for a Pacific Islands currency union. This paper exploits the OCA theoretical framework and employs the Gonzalo and Ng (2001) decomposition method in investigating the dynamic effects of permanent and tran- sitory shocks on key macroeconomic variables among Pacific Island countries (PICs). Using newly constructed quar- terly data in the analysis, evidence shows that the proposed union of six PICs (Fiji, PNG, Samoa, Solomon Islands, Vanuatu and Tonga) do not meet most of the preconditions for a union. However, further investigation shows evidence for the Melanesian countries (Fiji, PNG, Solomon Islands and Vanuatu) to possibly form a monetary union, preferably with the Australian dollar as the anchor currency. Nonetheless, further costs in terms of the alignment of policies by Melanesian countries are required. Keywords: Currency Union; Gonzalo and Ng Decomposition; Pacific Island Countries 1. Introduction One of the biggest challenges for Pacific Island countries (PICs) is their vulnerability to shocks such as volatility to commodity and energy prices, frequent cyclones, and political unrests and how they react to these shocks. The negative effects of these shocks have over the years im- pinged on regional economic growth and development of many of the PICs resulting in sluggish and subdued eco- nomic growth, rising unemployment, inflationary pressures and increased poverty levels. According to the Optimal Currency Area (OCA) theory and related extensions flow- ing from the seminal contributions of Robert Mundell [1], Ronald McKinnon [2], Peter Kenen [3], and Yoshihide Ishiyama [4], and Bayoumi and Eichengreen [5], the ef- fects of these shocks can be mitigated through a mix of OCA properties such as factor mobility and symmetry of shocks when countries enter into a currency union. This provides an economic environment conducive for trade, investment, competition and closer economic integration including policy coordination that leads to stability in prices and output within the union. The main cost of en- tering into a currency union would be a loss of monetary sovereignty where a country relinquishes full control over monetary policy and the money supply. The challenge for PICs is whether they are ready to enter into a currency union. Hence, this analysis attempts to examine the fea- sibility for PICs forming a currency union by evaluating the nature and extent of the symmetry of shocks among PICs which is a key property of the OCA. Whether the effects of shocks are symmetric (or not), and how PICs respond to these shocks will have implica- tions for the feasibility of a currency union. The contin- ued success or failure of the current regional efforts will also impact on future considerations for a currency union. Such efforts including recent regional plans like the Pa- cific Plan of 2005 and the current Placer Plus delibera- tions can be seen as a necessary platform on which to re-kindle the debate on the prospects for a Pacific Islands currency union. This analysis will focus on six PICs namely, Fiji, Papua New Guinea (PNG), Samoa, Solomon Islands, Tonga and Vanuatu because, firstly, they are fully independent sov- ereign states. These countries represent about 86% of the combined total population of all 22 combined PICs and Territories (PICTs), and about 36% of the total combined gross domestic product (GDP), including 95% of the total land area of all PICTs. These six PICs have their own currencies, exchange rate regimes and central banks. Hence, they determine their own domestic monetary (and fiscal) policies. Moreover, the six PICs share many common eco- nomic and physical characteristics, such as their depend- ence on imports and development aid, geographic isola- tion, vulnerability to terms of trade shocks and frequent natural disasters that Economists (see, e.g., [6]) argue are important considerations for a possible currency union. The work by [5] was one of the first attempts to opera- tionalise the OCA theory, in connection with the symmetry C opyright © 2012 SciRes. ME  W. LAHARI 499 property of shocks. The authors applied the Blanchard and Quah [7] decomposing technique within a VAR setup in examining a number of preconditions relating to the behavior of shocks within the European Community (EC) countries and US regions. Their analysis involved assess- ing the correlations of shocks, magnitudes of shocks, speeds of adjustment of shocks and similarities in the variance decomposition of shocks. The authors found relatively more idiosyncratic shocks across EC countries than across US regions and concluded that the EC may face difficul- ties to operate within a monetary union, unlike the United States. Similar analyses were undertaken by the same authors as in [8-9], among others, in evaluating the con- ditions for Europe, Asia and the Americas. Following these studies, many similar studies focusing on various regions of the world emerged, although for the Pacific Island region, there is lack of studies on currency unions relating to the analysis of symmetry of shocks1. This study draws insights from [5,7-9] but applies the decomposition method of Gonzalo and Ng [14] in de- composing the shocks into its permanent (supply related) and transitory (demand related) components. The appli- cation of the decomposing procedure of [7] is not suited for this analysis because it is mainly based on a bi-variate VAR system unlike the approach of [14], which is based on a dynamic system of key macroeconomic policy vari- ables suited for this study. In the [7] technique, arguments are required for imposing structural indentifying restric- tions based on economic theory which may be less reli- able because the results depend on the types of restric- tions imposed on the VAR which differ from study to study. In contrast, the approach of [14] allows for restric- tions imposed by the data. Authors such as Cochrane [15] as well as [14], among others, argue that given that we know little or will never know the sources of shocks, applying assumptions about the sources of shocks may have implications on the model outcomes. Hence, the application in this study with newly constructed data extends the empirical scope of the analysis for PICs and is an interesting contribution to the current literature. The OCA theory postulates that countries interested in a cur- rency or monetary union will have to be part of a zone where a single currency circulates or, if there are several exchange rates, their exchange rates are fixed to each other permanently. In the event where two or more coun- tries face symmetric shocks or experience similar effects of shocks, it would be preferable for these countries to apply similar policy responses. In this context, it would be less costly to forego domestic policy autonomy for a common union-wide policy. Hence, entering into a union would facilitate the effective implementation of a com- mon policy among the countries. 2. Econometric Model and Data The Vector Error Correction Model (VECM) incorporates cointegration restrictions on the vector autoregression process in a similar methodological framework to that of [14]. The method provides a systematic framework in identifying and decomposing the permanent and transi- tory (P-T) shocks among key variables of interest. Thus, the VECM representation of Zt is presented in the re- duced form as: 11 ZLZ tt tt e (1) where ∆Zt represents first differences of a n × 1 vector of I(1) process of Zt; rank(π) = r is the number of cointe- grated vectors in the system with π, and n > r ≥ 1, where n is the number of variables; γ is the n × r matrix of adjustment coefficients or error-correction parameters; α consist of the r × n cointegrating vectors, and L the lag polynomial. is Permanent and Transitory Decomposition Following from [14], we can generally represent the final-form of the P-T shocks (orthogonalised) from Equa- tion (1) as, Δt ZDLη t (2) where DL is a lag polynomial, and t is a n × 1 vec- tor of the transformed orthogonalised P-T shocks. The t are serially and mutually uncorrelated, and have unit variance. According to Gonzalo and Ng, the 1nr vector of shocks, t , are the common stochastic trends or permanent shocks in the VECM when lim 0 p httht EZ for the levels of Zt. Simi- larly, the r × 1 vector of shocks, T t , refers to transitory shocks when lim 0 T ht EZ tht . The process of decomposing t is summarised as follows: the initial phase involves isolating the structural innovations, de- noted as ut, from the VECM, distinguished by their “un- orthogonalised” permanent and transitory components, denoted as t and T t. This is attained by a Wold mov- ing-average representation in the form of Equation (3). Thus, initially, we can generally represent Equation (1) as, u u Δtt CLe (3) where CL is the lag polynomial and et is an n × 1 vector of the reduced form residuals from the VECM. The task then is to find a matrix G that transforms et into a set of t u or T shocks2. Thus, t u G (4) 1See related studies for Africa as in [10] and Asia as in [11], among others. For the Pacific Island region, some related but not directly con- nected studies include [12,13]. 2The application of G is motivated by the Granger Representation Theorem. See Proposition 1, page 1531, in [14] for further discussion. Copyright © 2012 SciRes. ME  W. LAHARI 500 where 0, and is the orthogonal complement to γ. Since defines the permanent shocks, ˆ can have poor sampling properties. Hence, [14] suggest con- straining insignificant estimates of to zero. Not re- stricting this can result in an unstable process. Thus, we isolate ˆ γ t u and T t by computing G with the residuals of the VECM, et, in the form, u t t t e Ge e (5) where the vector t u 1nr P te and r × 1 vector T tt uee next process involves ‘orthogonalising’ . Th t u and T t u sthat they are mutually uncorrelated. This allows us to obtain the impulse responses and variance decompositions. This is done through obtaining a lower block triangular matrix, H, by applying the Choleski de- composition to cov(Get). Thus, the transformation con- verts t o t DLu arrive at Zto tt DL s in Equation (2) earlier. The transformed orthogonalised P-T shocks are given by, a 1 tt T HGe (6) The decomposition of the P-T shocks can now be sum- marised as in Equation (7) below, to arrive at Equation (2) earlier, 111 tttt CLG HHGeDLHH uDL (7) The advantage of the procedure of [14] in our context is that unlike other approaches particularly that of [16] where economic theory is used to identify the short and long- run dynamics of the model, [14] allows for long-run re- strictions that are implied by the data. However, this is not limited to economic assumptions. In fact, the method of [14] caters for restrictions on the cointegrating vectors to allow for efficiency gains if the cointegrating restric- tions are correct. In addition, [14] examines the dynamic effects of transitory shocks which are embedded within the lower triangular matrix H. Given the aforementioned reasons, this approach is suited for this analysis given that it can be quite complicated to ascertain very accurate economic arguments for PICs required for imposing re- strictions which may be less reliable. Cochrane [15] ar- gued that despite numerous analyses of the origins of shocks, very little is known about them. A limitation of the procedure of [14] involves the identification of the shocks that are constrained to the cointegration restric- tions imposed, as no appropriate rule exists around a sub- jective choice of H, in respect to orthogonalising the structural shocks3. It is up to the researcher’s considerate application in determining the appropriate number of cointegrating relationships to be imposed. However, in practise, this may often be complicated given the model specification requirements, lag criteria and the type of cointegration tests considered. Data Description Time series data for key macroeconomic variables from existing data sources and newly-constructed time series data at a quarterly frequency are employed in this analy- sis from mainly 1980:1 to 2006:44. The new data includes the newly quarterly real GDP series for the PICs con- structed by Lahari, Haug and Ozanne [17]. Table 1 pro- vides a description of the data used in this analysis. The derivation of other quarterly series follows similar methodology by [17]. In addition, for our purposes, newly- constructed trade weighted nominal exchange rate indi- ces (TWIs) for each of the PICs are derived and used instead of the exchange rates5. The choice of variables is based on the underlying policy goals, as measured by the variables, of the criteria of the Maastricht Treaty of 1991, and not the specific tar- gets. It is applied in the context of the PICs. This is rele- vant in respect to setting a benchmark for comparison for PICs which intend to form a currency union. The extent to which a group of countries’ policies behave and react to shocks has implications on forming a currency union. The six PICs together with Australia and New Zealand are clustered into potential union blocks on the basis of their prevailing trade agreements, culture and historical connections. Hence, the following potential groups are proposed: Group 1: Pacific Only (Fiji, PNG, Samoa, Solo- mon Islands, Tonga and Vanuatu); Group 1A: Pacific with Australia; Group 1B: Pacific with NZ, Group 2: Melane- sia (Fiji, PNG, Solomon Islands and Vanuatu); Group 2A: Melanesia with Australia; Group 2B: Melanesia with New Zealand. The challenge is to first examine the possibility of countries in Group 1 (Pacific) forming a currency un- ion. Evaluating initial prospects for uniting the PICs in a union would help distinguish possible prospects for PICs (least developed/developing economies) first, prior to fur- ther assessment with Australia and/or New Zealand (ad- vanced/developed economies). Should this hold, then a further examination to form a union with Australia and/or New Zealand is undertaken. If not, then out of the Group 1 countries, a group of Melanesian countries (Group 2) is investigated separately. If forming a union is feasible for Group 2 then further investigation for the prospects of 4The time-series data for New Zealand, mainly GDP and fiscal (gov- ernment budget) balance, started from 1987:2 due to the massive finan- cial reforms in the prior years. Hence, where these variables are ana- lysed within a group of countries including New Zealand, the time eriod will be based on the series for New Zealand. 5The use of the TWI based on a common weighting structure of curren- cies represent a better measure of the degree of economic competitive- ness of a country relative to its major trading partners. 3See Assumption 1, page 1532, in [14] for further discussion. Copyright © 2012 SciRes. ME  W. LAHARI Copyright © 2012 SciRes. ME 501 Table 1. Data description. Variable Description Source GDP Log of real gross domestic product (GDP) in 2000 prices. Newly constructed series by [17]; and IFS (line 99B.CZF and line 99BIRZF) for Aust/NZ. CPI Log of CPI in 2000 prices. IFS (line 64..ZF). IRATE Interest rates (gov. bonds). IFS (line 61..ZF). M2 Log of money supply adjusted by CPI. IFS (line 35L..ZF). FGDP Ratio of nominal fiscal (gov. budget) balance to nominal GDP. Fiscal balance is the difference between the nom.gov. expenditure and revenue. Newly constructed series following [17]. Data for Australia is from ABS; NZ is from OECD. DebtGDP Ratio of nominal public external debt to nominal GDP. Newly-constructed series following [17]. Data for Australia is from RBA; NZ is from Statistics NZ. TWI Log of trade weighted nominal exchange rate index (March quarter, 1980, base year). Newly-constructed series; exchange rates IFS (line RH..ZF); weights: nominal GDP IFS (line 99B..ZF and UN); trade (COMTRADE). TWI-AUD Log of trade weighted nominal exchange rate index (March quarter, 1980, base year) based on Australian dollar as anchor currency. Newly-constructed series; exchange rates IFS (line RH..ZF); weights: nominal GDP IFS (line 99B..ZF and UN); trade (COMTRADE). TWI-NZD Log of trade weighted nominal exchange rate index (March quarter, 1980, base year. This is similar to TWI-AUD except that the anchor currency is the NZ dollar. Newly-constructed series; exchange rates IFS (line RH..ZF); weights: nominal GDP IFS (line 99B..ZF and UN); trade (COMTRADE). Notes: Log represents natural logarithms; IFS: International Financial Statistics; OECD: Organization of Economic Cooperation and Development; RBA: Re- serve Bank of Australia; RBNZ: Reserve bank of New Zealand; ABS: Australian Bureau of Statistics; UN: United Nations Statistics Division National Ac- counts; COMTRADE: United Nations Commodity Trade Statistics database. Group 2 countries forming a currency union with Austra- lia (Group 2A) and/or New Zealand (Group 2B) is un- dertaken. revealed that the initial impacts were relatively low (less than 1%) for all the variables. The low impact is less costly for a union. However, the speed of adjustment of P-T shocks for most of the variables took longer to stabi- lise or fade away. For example, P-shocks persisted for about 1 (h = 4) year to 3 (h = 12) years for most of the variables while real GDP took about 5 years to just under 8 years before reaching new equilibrium levels. These are costly for a union. Figure 1 shows the dynamic im- pulse responses for GDP. From the variance decomposi- tion results, the dominance of either a P or T shock on economic growth (real GDP) and prices (CPI) appeared mixed. However, only the P-shocks were the key drivers for movements in exchange rates (TWI) while the T-shocks were predominant among prices (CPI) for all PICs, excluding Samoa. Nonetheless, the general find- ings confirm the lack of coherence in macroeconomic policies. The direct sources for such differences are com- plex to ascertain but can be generally linked to supply and demand factors. For instance, Samoa and Tonga share some common features such as their dependence on re- mittances and tourism receipts in contrast to a number of Melanesian countries such as PNG and the Solomon Is- lands. These factors have a significant influence on Samoa and Tonga’s exchange rates in maintaining a consistent flow of foreign reserves. However, this was to some ex- tent inconsistent with the results that showed that their exchanges rates (TWIs) were affected differently. Such dissimilarities are not conducive for a union. It is noted that mainly the fifth transitory shock for real GDP show 3. Empirical Results The empirical findings from the estimation of our model in Section 2 are analyzed in terms of the direction, mag- nitude, persistence, dominance and correction of P-T shocks within the proposed currency union groupings. Although Table 2 presents separate background tests for the degree of economic convergence (cointegration) (see, e.g., [18]), the cointegration test results themselves form the core input in the estimation of the model6. Initial unit root tests revealed that interest rate (IRATE) for Fiji and DebtGDP for Tonga were I(0) and thus their corresponding group- ings were excluded in the cointegration tests and model. 3.1. Group 1 (Pacific) A 1% shock to the system of PICs resulted in some simi- larities in the impulse response functions although the majority of the results appeared mixed. In Table 3, there was similar direction in the effects of the P-T shocks for real GDP (positive P-shocks) except for Samoa, CPI (posi- tive T-shocks) and TWI (positive T-shocks), except for Tonga. In terms of the magnitudes of shocks, our results 6Results for unit roots tests and cointegration are available upon request Other results for the dynamic impulse response functions and variance decompositions by proposed union groups are also available upon request.  W. LAHARI 502 Table 2. Summary of Johansen cointegration test results and degree of convergence by proposed union groups. Number of Cointegrating Vectors (r)a Variables Group 1 (Pacific (n = 6) Group 2 (Melanesia) (n = 4)Group 2A (Melanesia + Aust) (n = 5) Group 2B (Melanesia + NZ) (n = 5) DebtGDP (%) - 1** 1 ** 0 * ln(CPI) 1** 2 **, 3* 4 ** 4 ** ln(TWI) 1** 0 * 1 **c 1 **b ln(real GDP) 4**, 5* 3 ** 3 ** 3 ** ln(real M2) 0* 0 * 0 * 1 * Degree of Convergencec Complete Convergence (n – r = 1) where r ≠ 0 Real GDP Real GDP, CPI CPI CPI Partial Convergence (n – r ≥ 2) where r ≠ 0 Real GDP Real GDP, CPI CPI Real GDP, TWI-NZD, Real M2 No Convergence (r = 0) CPI, TWI DebtGDP Real GDP, DebtGDP, TWI-AUD DebtGDP Notes: aCointegration results are based on the trace rank test, unless otherwise specified; ** and * represents 5% and 10% significance levels respectively; bthe maximum-eigenvalue test result was considered as an alternative given the sensitivity of the choice of r imposed on Gonzalo and Ng’s method; cwhen r varies at 5% and 10% significance levels, the optimal r was chosen at the 10% significance level. Table 3. Direction (+/–) of dynamic impulse response of P-T shocks on initial impact by proposed union gr oups. Real GDP CPI TWI Group 1 (Pacific) P T P T P T Fiji (+) (–) (+)(+) (+) (+) (+) Vatu (+) (–) (+) (+) (+) (–) (+) (+) PNG (+) (–) (+)(+) (+) (+) (+) S.I. (+) (–) (+)(+) (+) (+) (+) Samoa (–) (–) (+)(–) (+)(+) (–) (+)(+) Tonga (+) (–) (+)(–) (+)(+) (+) (–) Real GDP CPI TWI-AUD DebtGDP Group 2 (Melanesia) P T P T P T P T Fiji (+) (–) (+) (+) (–) (+) (+) (+) (+) (+) Vatu (+) (+) (+) (–) (+)(+) (+) (+) (+) PNG (+) (–) (+)(+) (+) (+) (+) (+) (+) S.I (+) (+) (+) (+) (+) (+) (+) (+) Notes: PNG: Papua New Guinea; S.I.: Solomon Islands; Vatu: Vanuatu. no clear pattern of fading. This may be attributed to the sensitivity of cointegrating restrictions as stated by [14]. Table 4 shows mixed correlations of P-T shocks observed for most of the variables except the CPI. These suggest strong asymmetric behaviour among most of the variables except in consumer prices. The outcome shows that it is premature for PICs to form a currency union. 3.2. Group 2 (Melanesia) Our analysis of the variance decomposition results show a considerable degree of similar behaviour in the domi- nance of either a P or T shock for the variables among the majority of Melanesian countries. In particular, the T-shocks were the key drivers for growth (real GDP) and prices (CPI), while the P-shocks were predominant in debt (DebtGDP). This is consistent with economic ex- pectations of transitory factors that impede on economic growth (real GDP) for many Melanesian countries such as volatility to world commodity/mineral prices and de- mands on tourism receipts. Permanent shocks such as productivity and technological advances appear less sig- nificant drivers for growth, although this might change for countries like PNG in the medium to long term given the likely impact of the expanding mineral activities. Fur- thermore, in Table 3 our findings show common simi- larities in the direction of the effects of P-T shocks. For instance, the positive effects of P-shocks were predomi- nant among real GDP, CPI and DebtGDP. The dynamic impulse responses from a 1% shock to the economy reveal that all P-T shocks for all variables demonstrated minimal initial impact mostly at less than 1%. To a considerable extent, these findings are positive indications for a currency union especially where it fa- cilitates (less costly) implementation of a common un- ion-wide monetary policy. In terms of the persistence of shocks, the duration of the effect of a P-T shock on GDP Copyright © 2012 SciRes. ME  W. LAHARI 503 Notes: Vatu: Vanuatu; PNG: Papua New Guinea; S.I.: Solomon Islands. Figure 1. Dynamic impulse response of P-T shocks for real GDP—Pacific Island countries (Group 1). and DebtGDP (P-shocks) was about 1 (h = 4) year. For the CPIs (mainly the T-shocks) took between less than 1 year to 2 years on average, noting the case for the Solo- mon Islands (T-Shock 2) that took more than 2 years. In Table 5, the findings revealed positive correlations in shocks, amidst some negative correlations. Variables such as CPI (except mainly for T-shock 1) and DebtGDP (P-shock 3 and T-shock 1) showed mainly positive cor- relations supporting conditions for a union. However, there was mixed correlation of shocks for other variables such as GDP and the TWI. Hence, considerations for a union will come at some cost such as major reforms and re- alignment in macroeconomic policies. Since the exchange rate (TWI) shocks appeared more asymmetric, confirm- ing the volatile nature of the exchange rates of the indi- vidual Melanesian countries, it is unlikely that a common Melanesian currency fixed on each other’s exchange rates or a member’s currency should be considered. Instead, a suggestion for an anchor currency such as the Australian dollar should be considered as discussed below in Group 2A (Melanesia + Australia). In all, the majority of the effects of the P-T shocks show, to some considerable extent, a degree of similar domina- ce, less magnitude and persistence, which are necessary n Copyright © 2012 SciRes. ME 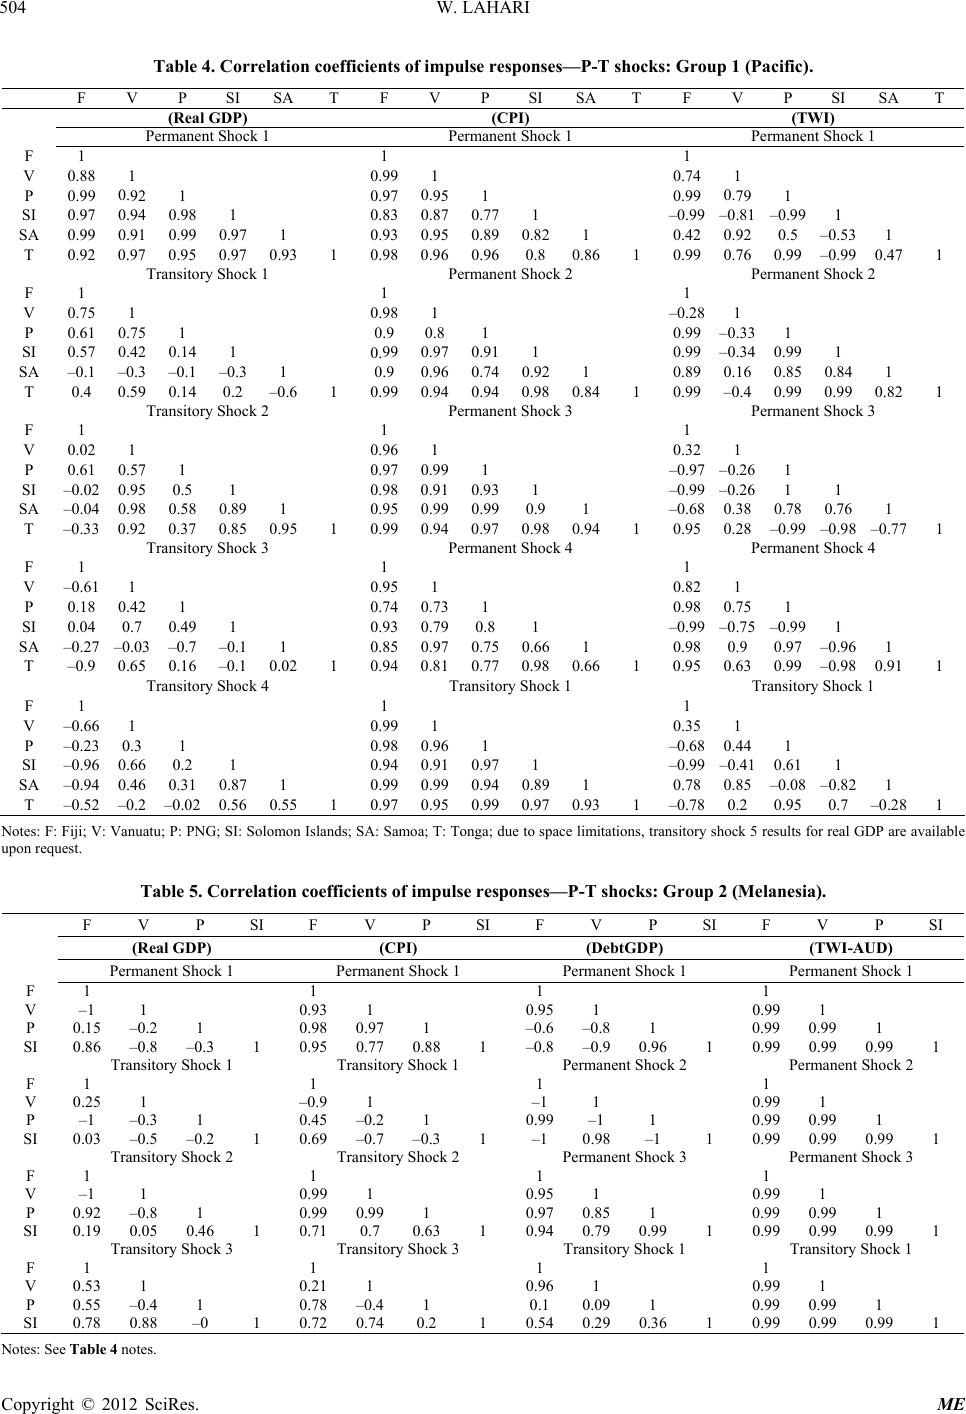 W. LAHARI 504 Table 4. Correlation coefficients of impulse responses—P-T shocks: Group 1 (Pacific). F V SI SAT P SI SA T F V P SI SAT F V P (Real GDP )(CPI) (TWI) Per1Perm1 Permk 1 ment anShock anent Shock anent Shoc F 1 1 1 V 0.1 0.1 0.1 0. 0.0. 0. 0.– –0 00.– 0. 00. rayentk 2ern2 0. 0.– 0. – 0. 0.0. –00. – 0.0. rayentk 3et 3 0.1 0.1 0.1 0. 0.––0. 0. 0. 0. 0.0.0. 0. 0. 0.0. – –0. ray 3entk 4e – 0.0. 0. 0.0. 0. – –0.– 0 0.0. ay 4ryry1 –0.6 1 0.1 0.1 0.0.–0. 0. 0. 0.– 0. 0. 0.0. –0. 0. 0.– 88 99 99 97 74 99 P 0. 0.97 921 0. 0.83 951 0. –0.99 791 SI 0. 94981 0.87771 0.81.99 1 SA 0.99 0.91 0.99 .971 0.930.950.89821 0.420.92 0.5 0 0.531 T 0.92 0.97 T 0.95 nsitor 0.97 Shock 1 931 0.980.96 P 0.96 rmane 0.8 Shoc .861 0.990.76 P .99 mane –0.99 t Shock 471 F 1 1 1 V 751 981 0.281 P 0.61 751 0.9 0. 0.81 0.990.331 SI0.57 0.42 141 990.97911 0.99–0.34 991 SA T –0.1 0.4 –0.3 0.59 –0.1 0.14 0.3 0.2 1 0.6 1 0.9 0.99 0.96 0.94 0.74 0.94 .92 98 1 84 1 0.89 0.99 0.16 –0.4 0.85 0.99 84 99 1 82 1 0. Shoc 0. Shock Tnsitor Shock 2 Prmane Prmanen F 1 1 1 V 02 61 96 97 32 0.97 P 0. –0.02 571 0. 0.98 991 26 1 SI 0. 0.98 9551 0. 0.99 91931 –0.99– 0.38 0.261 1 SA –0.04 58891 0.950. 0.97 9991 –0.6878761 T –0.33 0.92 0.37 0.85951 0.990.9498941 0.950.28 –0.990.98771 F T nsitor Shock P rmane Shoc P rmanen t Shock 4 1 1 1 V 0.611 951 821 P 0.18 421 0.74731 0.98751 SI0.04 0.7 – 491 0.930.790.81 –0.99–0.75 0.991 SA –0.27 0.03–0.7 0.11 0.850.970.75661 0.980.9 0. 0.97 0.961 T –0.9 0.65 r 0.16 –0.1.021 0.940.810.770.98661 0.95630.99 –0.98 911 F T nsitor Shock T ansitor Shock 1 T ansitor Shock 1 1 1 V 6 0.23 99 98 35 0.68 P – –0.96 3 1 0. 0.94 961 441 SI 6621 0. 0.99 91971 –0.990.4161 0.08 1 SA –0.94 0.46 31871 0.990.94891 0.780.85 –82 1 T –0.52 –0.2 –0.02 0.56551 0.970.950.990.97931 –0.780.2 0.95 0.7 0.281 NoF: VoIslands; SA: Samooueaceatio tra shock 5 rovae Table 5. Correlation coefficients of impulse responses—P-T shocks: Group 2 (Melanesia). F P SI tes: Fiji; V: anuatu; P: PNG; SI: Slomon a; T: Tnga; d to sp limitns, nsitory esults fr real GDP are ailabl upon request. V P SI F V P SI F V P SI F V (Real GDbtGD(TWI-AUD) P) (CPI) (DeP) Per 1 Perm1 Per 1 Pe 1 manent Shockanent Shock manent Shockrmanent Shock F 1 1 1 1 V – 0. 0. –0.–0. –0. 00 Try Shock 1 Try Shock 1 Pent Sk 2 Pent Sk 2 0. –0. – 0. ––0.– 0. ––0.–1 0 Try Shock 2 Try Shock 2 Pernt Sk 3 Pent Sk 3 – 0. 0. –0.0.0. 0 0.0.0 Try Shock 3 Try Shock 3 Trry Shock 1 Try Shock 1 0. 0. 0.0. ––0.0. –0 0.0.0 1 15 1 93 98 1 0. 95 0.6 1 0.99 99 1 P 0.2 1 0. 0.95 971 – –0.8 0.81 0. 0.99 991 SI 0.86 – ansitor 0.80.3 1 0 ansitor .77881 – rmane 0.9.961 0. rmane 99.991 hoc hoc F 1 1 1 1 V 25 –1 1 9 45 1 1 99 1 99 99 1 P 0.3 1 0. 0.69 0.21 11 0. 0.99 991 SI 0.03 – ansitor 0.50.2 1 – ansitor 0.70.31 –1 981 0. rmane 99.991 mane hochoc F 1 1 1 1 V 1 92 1 99 99 1 0. 95 97 1 0. 99 99 1 P 0.8 1 0. 0.71 991 0. 0.94 851 0. 0.99 991 SI 0.19 0 ansitor .05.461 0.7 631 0. ansito 79991 0. ansitor 99.991 ansitor F 1 1 1 1 V 53 55 1 21 78 1 96 0.1 1 99 99 1 P 0. 0.78 0.4 1 0. 0.72 0.41 091 0. 0.99 991 SI 0 .881 0.742 1 0.54 0.29361 0. 99.991 Notes: See Ta noteble 4s. Copyright © 2012 SciRes. ME 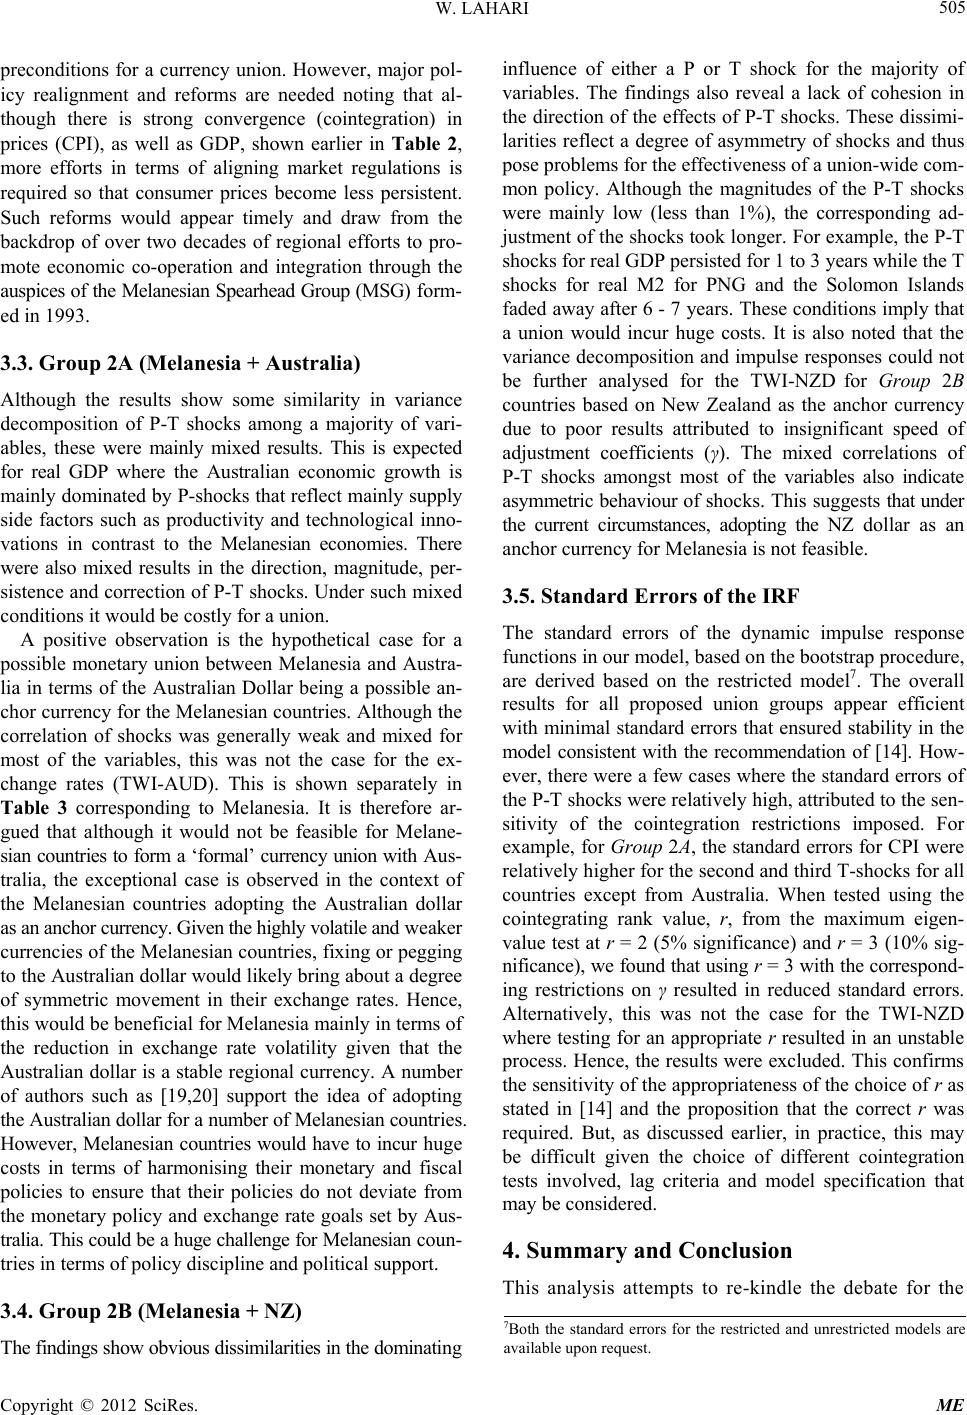 W. LAHARI 505 preconditions for a currency un. vajol- reforms are needed noting that al- 2A (Melanesia + Australia) variance y of vari- sia and Austra- lia The findings show obvious dissimilarities in the dominating inceither a P T hejoritof variables. The findings also reveal a lack of cohesion in the direction of the effects of P-T shocks. These dissimi- shocks and thus he overall results for all proposed union groups appear efficient ed stability in the nioHoweer, mr po icy realignment and though there is strong convergence (cointegration) in prices (CPI), as well as GDP, shown earlier in Table 2, more efforts in terms of aligning market regulations is required so that consumer prices become less persistent. Such reforms would appear timely and draw from the backdrop of over two decades of regional efforts to pro- mote economic co-operation and integration through the auspices of the Melanesian Spearhead Group (MSG) form- ed in 1993. 3.3. Group Although the results show some similarity in decomposition of P-T shocks among a majorit ables, these were mainly mixed results. This is expected for real GDP where the Australian economic growth is mainly dominated by P-shocks that reflect mainly supply side factors such as productivity and technological inno- vations in contrast to the Melanesian economies. There were also mixed results in the direction, magnitude, per- sistence and correction of P-T shocks. Under such mixed conditions it would be costly for a union. A positive observation is the hypothetical case for a possible monetary union between Melane in terms of the Australian Dollar being a possible an- chor currency for the Melanesian countries. Although the correlation of shocks was generally weak and mixed for most of the variables, this was not the case for the ex- change rates (TWI-AUD). This is shown separately in Table 3 corresponding to Melanesia. It is therefore ar- gued that although it would not be feasible for Melane- sian countries to form a ‘formal’ currency union with Aus- tralia, the exceptional case is observed in the context of the Melanesian countries adopting the Australian dollar as an anchor currency. Given the highly volatile and weaker currencies of the Melanesian countries, fixing or pegging to the Australian dollar would likely bring about a degree of symmetric movement in their exchange rates. Hence, this would be beneficial for Melanesia mainly in terms of the reduction in exchange rate volatility given that the Australian dollar is a stable regional currency. A number of authors such as [19,20] support the idea of adopting the Australian dollar for a number of Melanesian countries. However, Melanesian countries would have to incur huge costs in terms of harmonising their monetary and fiscal policies to ensure that their policies do not deviate from the monetary policy and exchange rate goals set by Aus- tralia. This could be a huge challenge for Melanesian coun- tries in terms of policy discipline and political support. 3.4. Group 2B (Melanesia + NZ) fluen of eorshock for t may larities reflect a degree of asymmetry of pose problems for the effectiveness of a union-wide com- mon policy. Although the magnitudes of the P-T shocks were mainly low (less than 1%), the corresponding ad- justment of the shocks took longer. For example, the P-T shocks for real GDP persisted for 1 to 3 years while the T shocks for real M2 for PNG and the Solomon Islands faded away after 6 - 7 years. These conditions imply that a union would incur huge costs. It is also noted that the variance decomposition and impulse responses could not be further analysed for the TWI-NZD for Group 2B countries based on New Zealand as the anchor currency due to poor results attributed to insignificant speed of adjustment coefficients (γ). The mixed correlations of P-T shocks amongst most of the variables also indicate asymmetric behaviour of shocks. This suggests that under the current circumstances, adopting the NZ dollar as an anchor currency for Melanesia is not feasible. 3.5. Standard Errors of the IRF The standard errors of the dynamic impulse response functions in our model, based on the bootstrap procedure, are derived based on the restricted model7. T with minimal standard errors that ensur model consistent with the recommendation of [14]. How- ever, there were a few cases where the standard errors of the P-T shocks were relatively high, attributed to the sen- sitivity of the cointegration restrictions imposed. For example, for Group 2A, the standard errors for CPI were relatively higher for the second and third T-shocks for all countries except from Australia. When tested using the cointegrating rank value, r, from the maximum eigen- value test at r = 2 (5% significance) and r = 3 (10% sig- nificance), we found that using r = 3 with the correspond- ing restrictions on γ resulted in reduced standard errors. Alternatively, this was not the case for the TWI-NZD where testing for an appropriate r resulted in an unstable process. Hence, the results were excluded. This confirms the sensitivity of the appropriateness of the choice of r as stated in [14] and the proposition that the correct r was required. But, as discussed earlier, in practice, this may be difficult given the choice of different cointegration tests involved, lag criteria and model specification that may be considered. 4. Summary and Conclusion This analysis attempts to re-kindle the debate for the 7Both the standard errors for the restricted and unrestricted models are available upon request. Copyright © 2012 SciRes. ME  W. LAHARI 506 feasibility of a Pacific Islands currency union. Although I am grateful to Alfred A. Haug for suggesting this stu am also grateful to Arlene [1] R. Mundell, “A Theory of Optimum Currency Areas,” American Eco, No. 4, 1961, pp. 657-665. “Theory of Optimum Currency Areas. An Pacific Island countries continue to strengthen and revi- talise their regional development strategies and agree- ments such as the Pacific Plan, the agenda for prospects of a currency union has gained little or no support at all. Nonetheless, these strategies provide a strong platform for future considerations for a Pacific or sub-regional currency union. This analysis employed the OCA theo- retical framework and applied the decomposition meth- odology of [14] in evaluating the behaviour of the per- manent (P) and transitory (T) shocks among key policy variables. Newly-constructed quarterly time series data were also used in providing new findings to the current debate. The conditions for a currency union were deter- mined by assessing the nature and extent of the symmet- ric behaviour of P-T shocks. This involved looking at similar dominance of either a P or T shock, direction of the effects of P-T shocks, magnitude, persistence and the correlations of P-T shocks. The degree of convergence was also considered. These preconditions were evaluated initially for the Pacific Island countries (PICs) (Group 1). Evidence showed that it was not feasible for the PICs to form a currency union. Further analysis undertaken for the Melanesian countries (Group 2) showed notable evi- dence that the Melanesian countries had, to a reasonable degree, met necessary macroeconomic conditions for a currency union. However, more structural adjustment efforts are required in realigning and harmonising poli- cies. Evidence also showed that a favorable choice of a currency anchor for Melanesia would be the Australian dollar. It would appear feasible for the Melanesian coun- tries and Australia (Group 2A) to form a monetary union where common monetary policy coordination could be conducted under currency board arrangements, rather than a formal currency union. The evidence for a Melanesian union supports more than two decades of efforts among the Melanesian countries in fostering economic co-opera- tion, even beyond the establishment of the Melanesian Spearhead Group in 1993. The recent setting up of the MSG Secretariat in 2008 only strengthens such efforts for future moves towards a Melanesian union. On the other hand, a currency union of Melanesian countries with New Zealand (Group 2B) would not seem possible at this stage based on the empirical evidence. 5. Acknowledgements dy and comments provided. I Garces-Ozanne and seminar participants of the Econom- ics Department at the University of Otago, for helpful comments and suggestions. I also thank participants at the 3rd Biennial Ocean Development Network Confer- ence in Fiji, April, 2010 for helpful comments. Funding for this research was provided through a Ph.D. scholar- ship award from the New Zealand Agency for Interna- tional Development. REFERENCES nomic Review, Vol. 51 [2] R. I. McKinnon, “Optimum Currency Areas,” The Ameri- can Economic Review, Vol. 53, No. 4, 1963, pp. 717-725. [3] P. Kenen, Eclectic View,” In: R. Mundell and A. K. Swoboda, Eds., Monetary Problems of the International Economy, Uni- versity of Chicago Press, Chicago, 1969, pp. 41-60. [4] Y. Ishiyama, “The Theory of Optimum Currency Areas: A Survey,” IMF Staff Papers, Vol. 22, No. 4, 1975, pp. 344-383. doi:10.2307/3866482 [5] T. Bayoumi and B. Eichengreen, “Shocking Aspects of the European Monetary Integration,” In: F. Torres and F. Giavazzi, Eds., Adjustment and Growth in the European Monetary Union, Cambridge University Press, Cam- bridge, 1993, pp. 193-229. doi:10.1017/CBO9780511599231.014 [6] C. Browne and D. Orsmond, “Pacific Island Countries: Possible Common Currenc ing Paper, No. 06/234, 2006, pp. 1-18. y Arrangement,” IMF Work- , pp. 655-673. in and S. Fabri- [7] O. J. Blanchard and D. Quah, “Dynamic Effects of Ag- gregate Demand and Supply Disturbances,” American Economic Review, Vol. 79, No. 4, 1989 [8] T. Bayoumi and B. Eichengreen, “One Money or Many? Analyzing the Prospects for Monetary Unification in Various Parts of the World,” No. 16, Princeton Studies International Finance, Princeton, 1994. [9] T. Bayoumi and B. Eichengreen, “Economic Performance under Alternative Exchange Rate Regimes: Some His- torical Evidence,” In: P. Kenen, F. Papadia zio, Eds., The International Monetary System, Cambridge University Press, Cambridge, 1994, pp. 257-297. [10] D. Fielding and K. Shields, “Modelling Macroeconomic Shocks in the CFA Franz Zone,” Journal of Development Economics, Vol. 66, No. 1, 2001, pp. 199-223. doi:10.1016/S0304-3878(01)00161-4 [11] D. Kim, “An East Asian Currency Union? The Empirical Nature of Macroeconomic Shocks in East Asia of Asian Economics, Vol. 18, No. 6, 20 ,” Journal 07, pp. 847-866. doi:10.1016/j.asieco.2007.10.002 [12] X. Xu, “The Exchange Rate Regime in Papua New Guinea? Getting It Right,” Pacific Economic Bulletin Vol. 14, No. 2, 1999, pp. 48-60 , o. 2, 2009, pp. 321-342. [13] T. K. Jayaraman and C. Cheer-Keong, “A Single Cur- rency for Pacific Island Countries: A Revisit,” Journal of Economic Integration, Vol. 24, N [14] J. Gonzalo and S. Ng, “A Systematic Framework for Analyzing the Dynamic Effects of Permanent and Tran- sitory Shocks,” Journal of Economic Dynamics and Con- trol, Vol. 25, No. 10, 2001, pp. 1527-1546. doi:10.1016/S0165-1889(99)00062-7 Copyright © 2012 SciRes. ME  W. LAHARI Copyright © 2012 SciRes. ME 507 [15] J. H. Cochrane, “Permanent and Transitory Components of GNP and Stock Prices,” Quarterly Journal of Eco- nomics, Vol. 109, No. 1, 1994, pp. 241-265. doi:10.2307/2118434 [16] R. G. King, C. Plosser, J. Stock and M. Watson, “Sto- “Estim e South Pacific Island Nations,” chastic Trends and Economic Fluctuations,” American Economic Review, Vol. 81, No. 4, 1991, pp. 819-840. [17] W. Lahari, A. A. Haug and A. G. Ozanne, Quarterly GDP for th ating Singapore Economic Review, Vol. 56, No. 1, 2011, pp. 97-112. doi:10.1142/S0217590811004122 [18] A. A. Haug, “Co-Movement towards a Currency or Monetary Union? An Empirical Study for New Zealand,” Australian Economic Papers, Vol. 40, No. 3, 2001, pp. 307-317. doi:10.1111/1467-8454.00128 [19] G. De Brouwer, “Should Pacific Island Nations Adopt the Australian Dollar?” Pacific Economic Bulletin, Vol. 15, No. 2, 2000, pp. 161-169. [20] R. C. Duncan, “Dollarising the Solomon Islands Econ- omy,” Pacific Economic Bulletin, Vol. 17, No. 2, 2002, pp. 145-246.
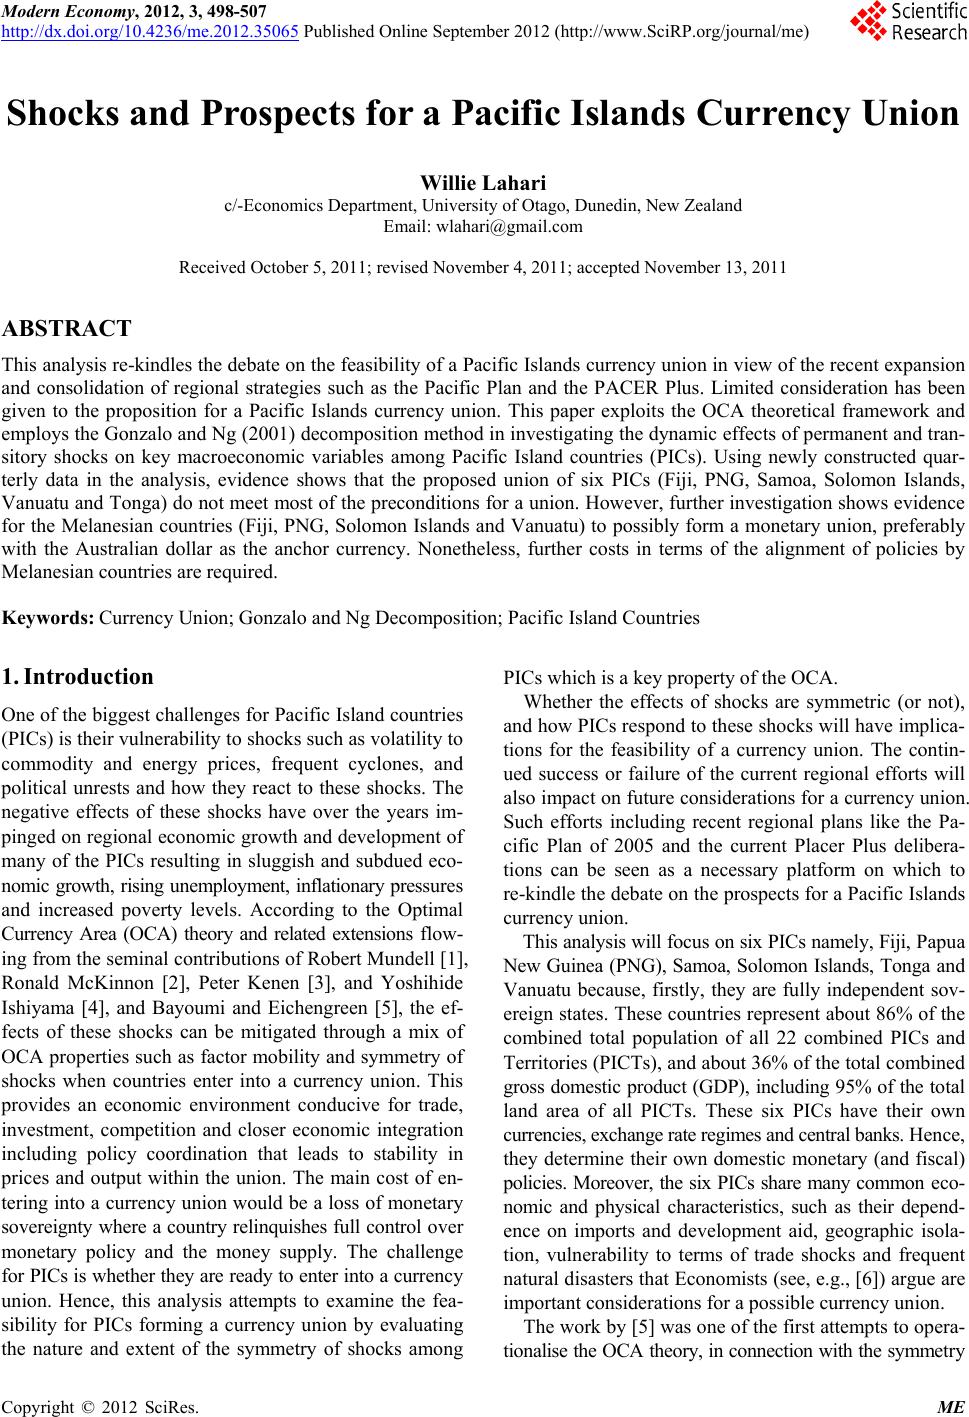
|