American Journal of Analytical Chemistry, 2012, 3, 664-668
http://dx.doi.org/10.4236/ajac.2012.39087 Published Online September 2012 (http://www.SciRP.org/journal/ajac)
Study on the Surface Acoustic Wave Sensor with
Self-Assembly Imprinted Film of Calixarene Derivatives to
Detect Organophosphorus Compounds
Bing-Qing Cao, Qi-Bin Huang, Yong Pan
Research Institute of Chemical Defence, Beijing, China
Email: Caobingqing961@sohu.com
Received June 23, 2012; revised July 25, 2012; accepted August 7, 2012
ABSTRACT
The molecularly imprinted technology and the self-assembly technique were used together on the calixarene surface
acoustic wave (SAW) chemical sensors to detect organophosphorus compounds. 25-(thioalkyl-alkoxy)-p-tertbutylcalix[4]
arene with self-assembled monolayer character was the sensitive coating of the sensors. The sensors had a special re-
sponse to organophosphorus compounds and the response frequency shift of this sensor to organophosphorus com-
pounds in 0.1 mg/m3 was 350 Hz. The response frequency increased linearly with the increase of the concentration of
DMMP in the range from 0.1 to 0.6 mg/m3. The possible explanation of the interaction between the coatings and or-
ganophosphorus compounds was discussed.
Keywords: Calixarene; Self-Assembly; Molecular Imprinted; SAW Sensor; DMMP; Detection
1. Introduction
Nowadays, the SAW sensor technology to detect the poi-
sonous and harmful gases is a focus in the sensor field. In
1992, Larry J. Kepley [1], for the first time, published a
literature in which surface acoustic wave technique and
self-assembly technique were put together to detect the
compound Dimethyl Methylphosphonate (DMMP). The
advantages of powerful selectivity, high sensitivity, short
response time, simple membrane preparation and long usa-
ge time were reported. Because calixarenes had the in-
herent three dimensional structure and pre-organized cavi-
ties as recognition sites, studies on their self-assembly
researches were more and more valuable [2]. The particu-
lar calixarene corpus molecules were assembled on the
surface of a gum body, SiO2, gold and other metals. Then
monolayer or multilayer self-assembly system could be
formed and used in molecular recognition, chemical sen-
sors and phase transfer catalysis, enzyme mimics etc, so
it exhibited an extensive application prospect [3,4]. Der-
mody [5] made use of the SAW sensor based on self-
assembly polydiacetylene calixarene derivatives bilayer
film to detect the chlorobenzene, toluene and other aro-
matic organics; the results indicated that the upper mar-
gin functional groups of calixarenes had important con-
tributions to sensitivity and selectivity. By Schierbaum
and Weiss [6,7], termination modified thio-ether resorcin
[4] arene derivatives, a self-assembly monomolecular mem-
brane, were used to detect four chloroethylene, the sensi-
tivity of those sensors could reach nanogram grade. In
1998, Dickert [8] published an article that the molecular
imprinted polymer SAW sensor was used for checking o-
dimethyl-benzene, its detection had reached to 4.5 mg/m3
(The limit to the toxicity detection of o-dimethylbenzene
was 450 mg/m3) which displayed excellent detection effects.
Wang Cheng Heng [9] had prepared the molecular im-
printed polymer SAW sensors based on calixarene mem-
brane, which had higher sensitivity and selectivity to de-
tect the sulphur and phosphorus compound.
There were few reports about calixarenes, the Third
Generation Supramolecules, as sensitive film of the SAW
sensor in the detection of poisonous and harmful gases.
Furthermore no systematic study had been performed on
its adsorption mechanism. In this article, Isopropyl hydro-
gen methylphosphonate 1) Was used as the template mole-
cule, and 25-(thioalkyl-alkox)-p-tertbutylcalix[4]arene; 2)
Self-assembly molecular imprinted film was used as the
sensitive film in acoustic surface wave chemical sensor, to
detect the orgnaophosphorous compounds such as DMMP;
3) Diisopropyl Methyl-phosphonate (DIMP, 4) and other
interference gases. The detection limit and the selectivity
of the sensor were studied, and the influences of tempera-
ture and other factors were discussed. The structures of
several compounds were shown in Figure 1.
C
opyright © 2012 SciRes. AJAC
B.-Q. CAO ET AL. 665
OH HO
OH
O(CH
2
)
10
S(CH
2
)
11
CH
3
P
OCH(CH
3
)
2
H
3
C
OH
O
P
O
H
3
COCH
3
OCH
3
12
3
25-(thioal
-p-tertbutyl -c
DMMP DIM
Isopropyl hydrogen
- methylphosphonate
P
kyl-alkox)
alix[4]arene
P
OCH(CH
3
)
2
H
3
C
OCH(CH
3
)
O
4
Figure 1. The structures of organophosphorus compounds
and 25-(thioalkyl-alkoxy)-p-tertbutylcalix[4]arene.
2. Experimental
2.1. Reagents and Apparatus
25-(Thioalkyl-alkoxyl)-p-tertbutylcalix[4]arene was synthe-
sized by our laboratory and was liquid chromatography
grade. Dimethyl Methylphosphonate (DMMP), Diisopro-
pyl Methylphosphonate (DIMP), Isopropyl hydrogen met-
hylphosphonate were reagent grade (Research Institute of
Chemical Defence, China). The other chemicals were rea-
gent grade (Beijing Chemical Reagent, Beijing, China).
For the instrumentations, a Surface Acoustic Wave dual
delay line (the centre frequency 300 MHz, the area of
delay line was 4 mm2 gold films), a Model Proteck C3100
Frequency Meter, (Korean Proteck company) was used
in this article.
2.2. Preparation of Self-Assembly Imprinted
Film of SAW Sensors
100 mL of 0.1 mmol/L 25-(thioalkyl-alkoxy)-p-tertbuty-
lcalix[4]arene self-assembly solution was preparaed, 100
mL of 5 - 10 mol/L isopropyl hydrogen methylphospho-
nate was added into the above solution, deposited for 12
hs for using later.
The surface acoustic wave dual delay line was purged
with V (sulphuric acid): V (hydrogen peroxide) = 3:1 Pi-
ranha solution to bright and clean, puffed with high pu-
rity N2 to remove surface foreign substance, in the last its
fundamental (ƒ0) frequency was measured.
The above-mentioned surface acoustic wave dual de-
lay line had been soaked in the self-assembly solution for
24 hs. After being taken out, the dual delay line was washed
to eliminate isopropyl hydrogen methylphosphonate. Its
fundamental frequency
()
f
62
0
1.26 10
and noise were measured
at the end.
The thickness of self-assembly imprinted film was es-
timated by the fact that the fundamental frequency shift
between coating and uncoating. Substrate conceptual dia-
gram was shown in Figure 2.
2.3. Appreciation of Self-Assembly Imprinted
Film of SAW Sensors
DMMP and DIMP were generated by gas dynamic gen-
erator at 28˚C. Then the response signal, response time
and recovery time to detect DMMP were obtained with
the above-mentioned sensor.
At the same condition, to verify the influence of inter-
ference gases on the SAW sensor, interference gases, which
concentrations were 100 - 1000 times more than that of
DMMP and DIMP were detected with the above-mentio-
ned sensor.
3. Results and Discussion
3.1. Evaluation of Film Thickness
Since the assembled film was prepared on SAW gold delay
line, mass deposits would result in the frequency shift of
baseline of the SAW-CA sensor, the relationship between
frequency shift and film thickness abided by following
Sauerbrey equation [10].
f
fh
ρ
(1) Δ=− ×
In the Equation 1, Δf (Hz) was the frequency shift be-
tween coatings and uncoating, f0 (Hz) was fundamental
frequency of SAW sensor. h (cm) was film thickness of
self-assembly imprinted film, ρ (g/cm3) was the density
of film material. All data were calculated with the equa-
tion, the following Equation 2 was gotten.
Figure 2. Dual-delay line of surface acoustic wave chemical
sensor.
Copyright © 2012 SciRes. AJAC
B.-Q. CAO ET AL.
666
11
0.657 10
×
()
hf=−Δ × (2)
The frequency shift between coating and uncoating was
about 18 - 20 KHz, and the thickness of the film was about
2.5 - 3.5 nm grade approximately according to the Equa-
tion 2.
The noise frequency could be used to confirm the de-
tection limit. In certain time, the noise frequency ΔfN of
sensor was calculated with the following Equation 3:
max min
2f
N
ffΔ=± (3)
where fmax was the biggest frequency and fmin was the
minimum frequency.
The experimental results indicated that the base frequ-
ency shift was 25 - 100 Hz, which was very small com-
pared with fundamental frequency. The reason was that
gold surface was coated with membrane and its surface
structure was changed into loose porous shape, the flat-
ness is smaller than that of smooth gold.
3.2. Detection of DMMP and DIMP at Different
Concentrations with SAW-MIP Sensor
Under the same experimental conditions (28˚C, RH = 70%),
the different concentrations of DMMP were detected, the
results such as the average response frequency shifts and
the response time were listed in Tables 1 and 2.
Table 1. The detection results of SAW-MIP sensor to DMMP.
Dynamic concentration/
mg/m3 Response frequency shift/KHz Response
time/min
0.10 0.352 6.80
0.20 0.680 6.02
0.40 1.392 5.61
0.60 2.144 5.22
1.00 2.995 5.03
1.50 3.772 4.81
2.00 4.025 4.72
2.50 4.255 4.64
3.00 4.352 4.53
5.00 4.402 4.52
Table 2. The detection results of SAW-MIP sensor to DIMP.
Dynamic concentration/
mg/m3 Response frequency shift/KHz Response
time/min
0.10 0.489 6.00
0.20 1.026 5.40
0.40 1.960 5.22
0.60 2.852 5.03
1.00 3.820 4.81
1.50 4.710 4.72
2.00 5.771 4.64
2.50 4.352 4.53
3.00 5.865 4.52
5.00 6.041 4.48
From the Table 1, we found that with decrease of
DMMP concentration, the response frequency shifts were
reduced, the response time was lengthened gradually, and
the recovery time was shortened. At high concentration,
the molecules of DMMP combined with gold quickly, so
that the time to reach balance was short and the recovery
time was longer. On the contrary, at low concentration,
since there were not so many adsorption molecules, the
response frequency was relatively weak. Although the
recovering speed was accelerated obviously, the equili-
bration needs longer time.
The SAW-MIP sensor had high sensitivity to low con-
centration DMMP and the results were shown in Figure
3. The response frequency shifts had a linear relationship
with the concentrations of DMMP at 0.1 - 0.60 mg/m3.
Even at 0.1 mg/m3, the SAW-MIP sensor still had almost
350 - 500 Hz response frequency shift, which was greater
than the 100 Hz of detection limit.
Generally, there are four kinds of adsorption models
between gas and film behavior: Henry laws, Langmuir
model, Freundlich adsorb equation and BET multilayer
adsorb model.
It had been shown in Figure 3, the detection curve as-
sumed a linear relationship at the beginning stage (0.10 -
1.00 mg/m3) and the curve was cliffier. From the linear
curve in Figure 4, the total correlation coefficient 0.98
had been obtained.
In the middle stage (1.00 - 3.00 mg/m3), the slope of
the curve was gradually with concentration, but above 5.0
mg/m3, response frequency shift no longer increased con-
spicuously. We carried on a discussion to the above-men-
tioned results by Langmuir model:
1
m
VaP
VaP
θ
==
+
012345
0
1
2
3
4
5
6
(4)
In the Formula 4, θ was surface fraction of coverage of
DMMP
f /kHz
Concentration/mg/m3)
Figure 3. The detection curve of DMMP at different con-
centrations (28˚C, RH = 70%).
Copyright © 2012 SciRes. AJAC
B.-Q. CAO ET AL. 667
0.0 0.2 0.4 0.6 0.8 1.0 1.2 1.4 1.
0.0
0.5
1.0
1.5
2.0
2.5
3.0
3.5
4.0
6
Y Axis Title
X Axis Title
B
Linear Fit of Data1_B
()
R: 0.98335; SD: 0.27115; N: 6; P: 4.1359E4.
Figure 4. The linear curve and the total correlation coeffi-
cient (0.10 - 1.00 mg/m3).
isothermal adsorption, a was equilibrium constant of ad-
sorption, which represented the adsorb ability of solid sur-
face, Vm was saturational adsorption quantity of DMMP,
V was practical adsorption quantity of DMMP at fractional
pressure P.
The variation amount
f
Δ
()
V
of response frequency and
adsorption quantity of imprinted sensitive film were
measured to be a direct ratio relation. When all experi-
mental data of the variety amount of response frequency
and the concentration (C) of DMMP were introduced into
the above-mentioned Formula 4, another Formula 5 would
be obtained.
1
a
m
m
CC
F
F
F
=+
ΔΔ
Δ (5)
where m
F
Δ was response frequency shift of saturational
adsorption, at the given conditions it was a constant.
From Formula 5, a straight line with the CFΔ
5.186FΔ=
012345
0.2
0.4
0.6
0.8
1.0
1.2
c/F(mg.m
-3.KHz-3)
C/(mg/m3)
to C
was gotten within range from 0.60 to 3.0 mg/m3 in Fig-
ure 5 showed:
According to the slope and intercept of the line, the
adsorption constant (a) of isothermal adsorption Lang-
muir model and the saturated frequency shift were calcu-
lated, a = 2.083, m KHz. In fact, when the
molecular imprinted film reached adsorption balance at
low concentration, the amounts of DMMP that had been
attached on film would be very small. Therefore this ad-
sorption behavior of Langmuir model on the film was
inevitable. When concentration was enhanced, the adsorp-
tion behavior of film was changed, and it could not be
described by the simple adsorption model. This result
demonstrated that the adsorption behavior became com-
paratively complicated along with the increment of DMMP
concentration. On the other hand, since the interactive com-
Figure 5. The calculation curve of parameter for langmuir
isotherm adsorption (28˚C, RH = 70%).
plexity between DMMP and the molecular imprinted film,
a simple linear relationship might not exist between the
response frequency shift and the concentration of DMMP.
The ideal molecular imprinted polymer has the imprinted
hole with appearance matching molecular size of template,
shape and functional group. Because imprinted films have
unique space structure, including the capacity of discern-
ment and 3D hole of displacement binding site, it could
be used to detect gas and high response frequency shift
was gotten in short time. It displays obvious molecular
imprinted effect. In this article Isopropyl hydrogen me-
thylphosphonate (1) was selected as the template, be-
cause its chemical structure was greatly similar to that of
DMMP, as a result, a great frequency shift was obtained
in this detection process.
3.3. Imprinted Effectiveness and
Anti-interference Experiments of the
SAW-MIP Sensors
In order to further confirming the imprinted effectiveness,
many other gases were chosen to carry on comparative
experiment. Spirits, hydrocarbon, aldehyde, ketene, aro-
matics, amines, organic acid, organophosphorus, herbosa
smoke etc, about 30 kinds of interference gases whose
concentrations were higher 100 - 1000 times than that of
DMMP were detected. The experimental results were
shown in Table 3:
It had been shown in Table 3, in general, common
organic solvents and gases did not interference with the
SAW-MIP sensors. Among them, because the structures
of organophosphorus agrochemicals were similar to DMMP,
their frequency shifted greatly, but to the imprinted effe-
ctiveness of DMMP, their responses were obviously lower
than that of DMMP at the same concentration. Moreover,
organic amines and high concentration organic acids would
also produce some influence on the examination, this might
be when the concentrations of these several compounds
Copyright © 2012 SciRes. AJAC
B.-Q. CAO ET AL.
Copyright © 2012 SciRes. AJAC
668
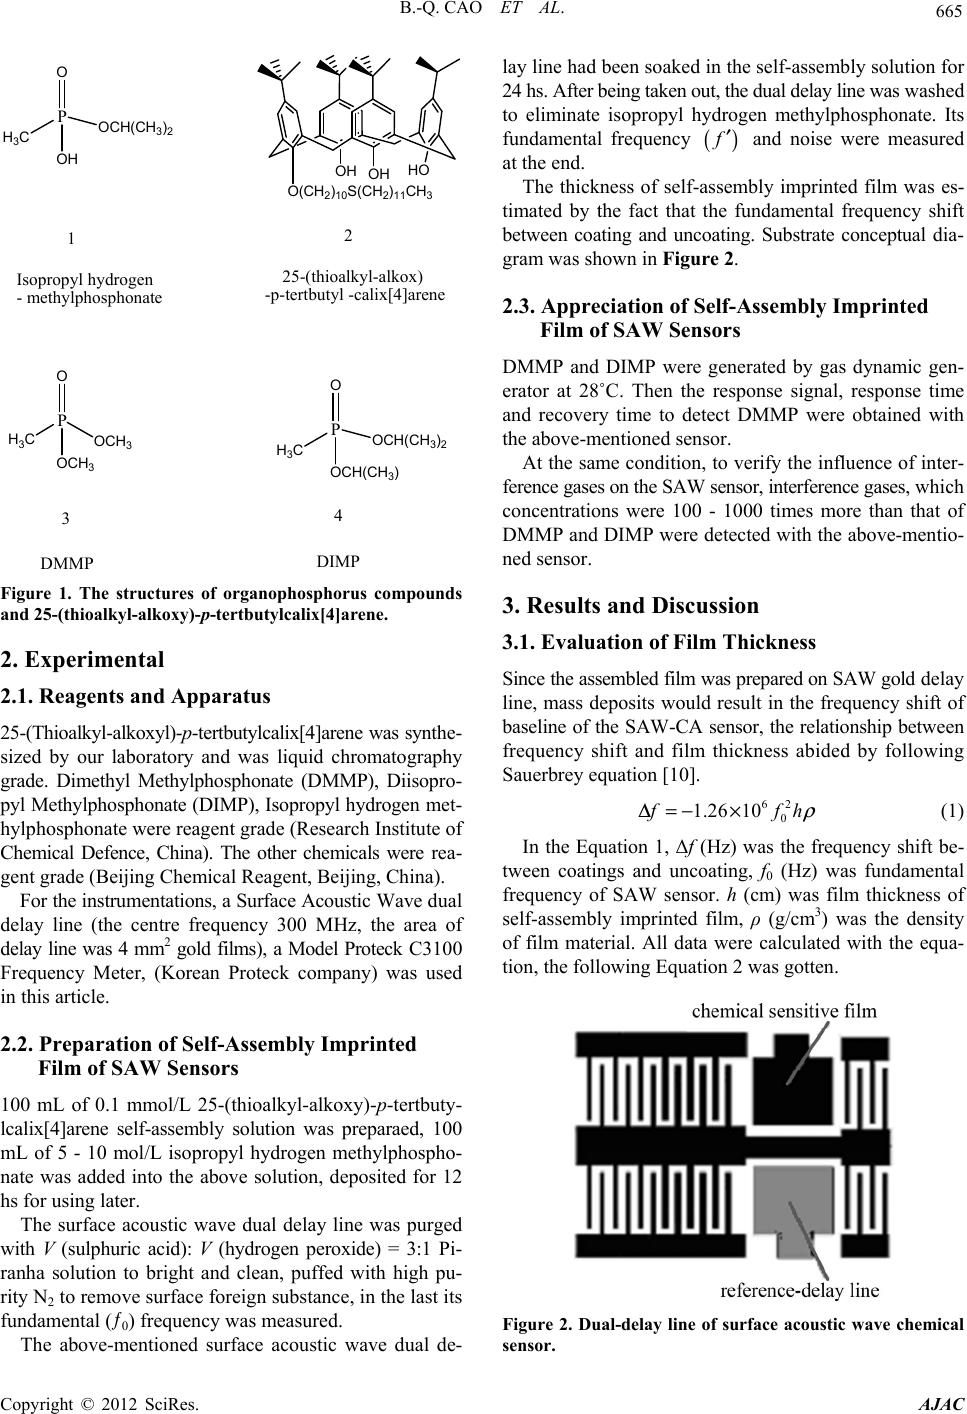
Table 3. The response of the SAW-MIP sensor to interfer-
ence gases.
Interference gas Concentration/(mg/m3) Response frequency
shift/KHz
Omethoate 1000 0.550
CH3OH 10000 0.320
CH3CH2OH 10000 0.421
HCOOH 1000 0.330
CH3COOH 1000 0.360
CH3(CH2)4COOH 1000 0.520
NH3 2000 0.521
C6H5NH2 2000 0.516
O-Anisidine 1000 0.212
C2H5OC2H5 10000 0.220
Petrdeumetherr 10000 0.510
THF 10000 0.510
n-C6H14 10000 0.130
n-C8H18 1000 0.310
CCl4 10000 0.290
HCHO 1000 0.125
CH3COCH3 10000 0.120
CH3COOC2H5 10000 0.150
C6H6 10000 0.140
C6H5CH3 1000 0.280
C6H5Cl 1000 0.113
H2O 1000 0.160
CH3CN 1000 0.190
Grass smog High 0.130
were 100 times, even higher than that of DMMP, they had
been to some extend linked or adsorbed on film surface.
Besides, when 25-(thioalkyl-alkoxy)-p-tertbutylcalix[4]
arene (2) non-imprinted film was used as SAW sensitive
film to detected toxic agents, the results indicated that
although it could be assembled into a film on Au surface
and had cavity structure, this kind of film had no especially
different 3D space structure, combining ability was small,
and had no obviously response to DMMP, which further
confirmed the imprinted effect.
4. Conclusion
In this paper, the SAW-MIP sensor to detect organophos-
phorus has been detailly studied with 25-(thioalkyl-alko-
xy)-p-tertbutylcalix[4]arene self-assembly molecular im-
printed film. Because this kind of SAW-MIP sensor has
strong selectivity, high sensitivity, great response frequency
shift and good recovery for DMMP, it was possible to be
applied to detection of the low concentration organophos-
phorus gases or quickly early-warning and it could be
widely applied in the future. Molecular imprinted tech-
nology with the self-assembly technique were used together
in calixarene surface acoustic wave chemical sensor, must
have important significance in studying on more gas sen-
sitive films and sensors
REFERENCES
[1] L. J. Kepley and R. M. Crook, “Selective Surface Acous-
tic Wave-Based Organophonate Chemical Sensor Em-
ploying a Self-Assembled Composite Monolayer: A New
Paradigm for Sensor Design,” Analytical Chemistry, Vol.
64, No. 24, 1992, pp. 3191-3193.
doi:10.1021/ac00048a018
[2] X. Guo, F. Liu and G.-Y. Lv, “Recent Progress on Study
of Calixarene Derivatives,” Chinese Journal of Organic
Chemistry, Vol. 25, No. 9, 2005, pp. 1021-1028.
[3] D.-Q. Liu, Y.-Q. Feng and S.-X. Meng, “Progress of
Calixarenes Used as Anion Receptor,” Chinese Journal of
Organic Chemistry, Vol. 26, No. 4, 2006, pp. 419-430.
[4] H. Lv, B.-Q. Cao and Y. Pan, “The application of Calix-
arene Used in SAW Chemical Sensor,” Chemical Sensors,
Vol. 27, No. 2, 2007, pp. 7-11.
[5] D. L. Dermody, R. M. Crooks and T. Kim, “Interactions
between Organized, Surface-Confined Monolayers and
Vapor-Phase Probe Molecules.11. Synthesis, Characteri-
zation, and Chemical Sensitivity of Self-Assembled Poly-
diacetylene/Calix[n]arene Bilayers,” Journal of Ameri-
can Chemistry Society, Vol. 118, No. 47, 1996, pp.
11912-11917. doi:10.1021/ja961302x
[6] K. D. Schierbaum, T. Weiss and E. U. Thoden van Vel-
zen, “Molecular Recognition by Self-Assembled Mono-
layers of Cavitand Receptors,” Science, Vol. 265, No.
5177, 1994, pp. 1413-1415.
doi:10.1126/science.265.5177.1413
[7] J. Rickert, T. Weiss and W. Gopel, “Detection of Oli-
gonucleotide Sequences with Quartz Crystal Oscillators,”
Sensors and Actuators B, Vol. B31, No. 1-2, 1996, pp.
45-50. doi:10.1016/0925-4005(96)80015-3
[8] F. L. Dickert, P. Forth and J. W. Grate, “Molecular Im-
printing in Chemical Sensing—Detection of Aromatic,”
Fresenius Journal of Analytical Chemistry, Vol. 360, No.
7-8, 1998, pp. 759-762. doi:10.1007/s002160050801
[9] C.-H. Wang, C.-Y. LI and X.-L. Xu, “Electrochemical
Investigation of Parathion Impringred Sensor and Its Ap-
plication,” Chinese Journal of Applied Chemistry, Vol. 23,
No. 40, 2006, pp. 404-408.
[10] J. W. Grate, S. L. Rose-Pehrsson and D. L. Venezky,
“Smart Sensor System for Trace Organophos-Phorus and
Organosulfur Vapor Detection Employing a Tempera-
ture-Controlled Array of Surface Acoustic Wave Sensors,
Automated Sample Preconcentration, and Pattern Recog-
nition,” Analytical Chemistry, Vol. 65, No. 14, 1993, pp.
1868-1881. doi:10.1021/ac00062a011