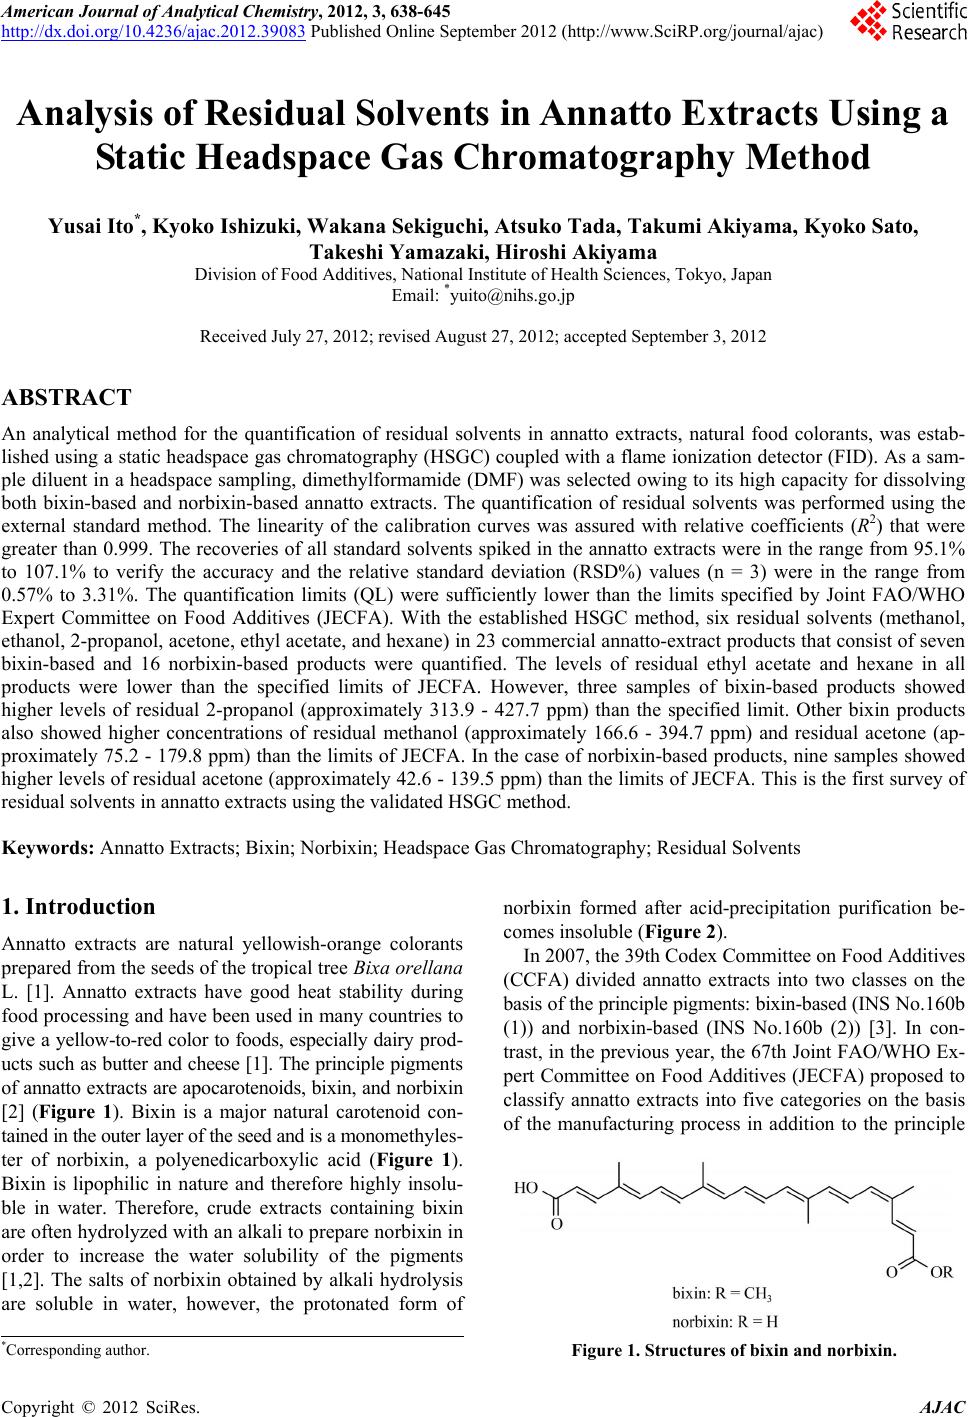
 American Journal of Analytical Chemistry, 2012, 3, 638-645 http://dx.doi.org/10.4236/ajac.2012.39083 Published Online September 2012 (http://www.SciRP.org/journal/ajac) Analysis of Residual Solvents in Annatto Extracts Using a Static Headspace Gas Chromatography Method Yusai Ito*, Kyoko Ishizuki, Wakana Sekiguchi, Atsuko Tada, Takumi Akiyama, Kyoko Sato, Takeshi Yamazaki, Hiroshi Akiyama Division of Food Additives, National Institute of Health Sciences, Tokyo, Japan Email: *yuito@nihs.go.jp Received July 27, 2012; revised August 27, 2012; accepted September 3, 2012 ABSTRACT An analytical method for the quantification of residual solvents in annatto extracts, natural food colorants, was estab- lished using a static headspace gas chromatography (HSGC) coupled with a flame ionization detector (FID). As a sam- ple diluent in a headspace sampling, dimethylformamide (DMF) was selected owing to its high capacity for dissolving both bixin-based and norbixin-based annatto extracts. The quantification of residual solvents was performed using the external standard method. The linearity of the calibration curves was assured with relative coefficients (R2) that were greater than 0.999. The recoveries of all standard solvents spiked in the annatto extracts were in the range from 95.1% to 107.1% to verify the accuracy and the relative standard deviation (RSD%) values (n = 3) were in the range from 0.57% to 3.31%. The quantification limits (QL) were sufficiently lower than the limits specified by Joint FAO/WHO Expert Committee on Food Additives (JECFA). With the established HSGC method, six residual solvents (methanol, ethanol, 2-propanol, acetone, ethyl acetate, and hexane) in 23 commercial annatto-extract products that consist of seven bixin-based and 16 norbixin-based products were quantified. The levels of residual ethyl acetate and hexane in all products were lower than the specified limits of JECFA. However, three samples of bixin-based products showed higher levels of residual 2-propanol (approximately 313.9 - 427.7 ppm) than the specified limit. Other bixin products also showed higher concentrations of residual methanol (approximately 166.6 - 394.7 ppm) and residual acetone (ap- proximately 75.2 - 179.8 ppm) than the limits of JECFA. In the case of norbixin-based products, nine samples showed higher levels of residual acetone (approximately 42.6 - 139.5 ppm) than the limits of JECFA. This is the first survey of residual solvents in annatto extracts using the validated HSGC method. Keywords: Annatto Extracts; Bixin; Norbixin; Headspace Gas Chromatography; Residual Solvents 1. Introduction Annatto extracts are natural yellowish-orange colorants prepared from the seeds of the tropical tree Bixa orellana L. [1]. Annatto extracts have good heat stability during food processing and have been used in many countries to give a yellow-to-red color to foods, especially dairy prod- ucts such as butter and cheese [1]. The principle pigments of annatto extracts are apocarotenoids, bixin, and norbixin [2] (Figure 1). Bixin is a major natural carotenoid con- tained in the outer layer of the seed and is a monomethyles- ter of norbixin, a polyenedicarboxylic acid (Figure 1). Bixin is lipophilic in nature and therefore highly insolu- ble in water. Therefore, crude extracts containing bixin are often hydrolyzed with an alkali to prepare norbixin in order to increase the water solubility of the pigments [1,2]. The salts of norbixin obtained by alkali hydrolysis are soluble in water, however, the protonated form of norbixin formed after acid-precipitation purification be- comes insoluble (Figure 2). In 2007, the 39th Codex Committee on Food Additives (CCFA) divided annatto extracts into two classes on the basis of the principle pigments: bixin-based (INS No.160b (1)) and norbixin-based (INS No.160b (2)) [3]. In con- trast, in the previous year, the 67th Joint FAO/WHO Ex- pert Committee on Food Additives (JECFA) proposed to classify annatto extracts into five categories on the basis of the manufacturing process in addition to the principle *Corresponding author. Figure 1. Structures of bixin and norbixin. C opyright © 2012 SciRes. AJAC 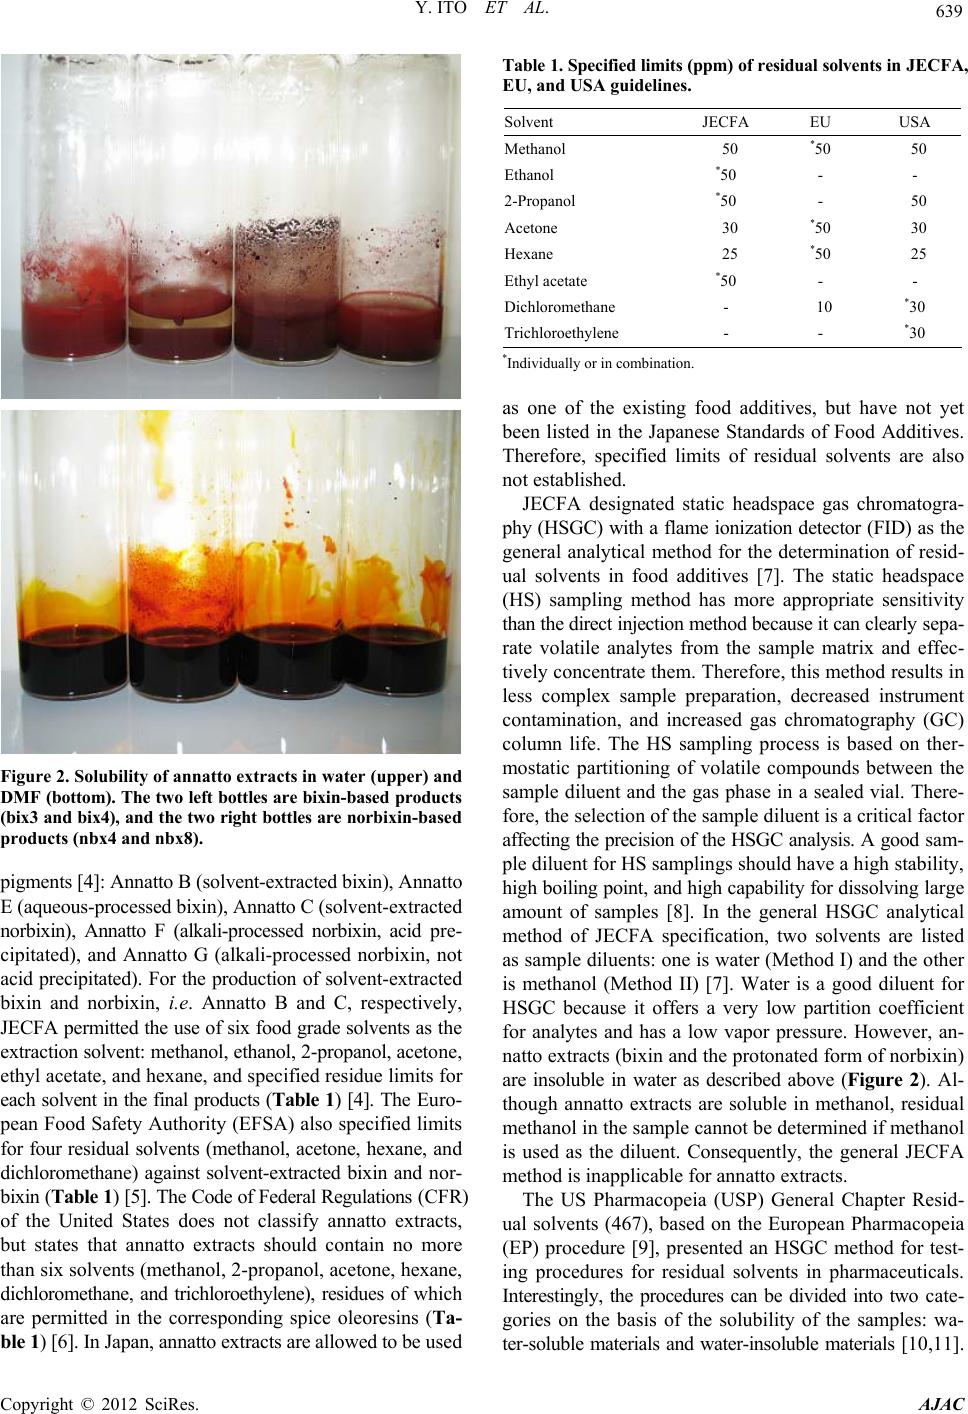 Y. ITO ET AL. 639 Figure 2. Solubility of annatto extracts in water (upper) and DMF (bottom). The two left bottles are bixi n-based produc ts (bix3 and bix4), and the two right bottles are norb ixi n-ba sed products (nbx4 and nbx8). pigments [4]: Annatto B (solvent-extracted bixin), Annatto E (aqueous-processed bixin), Annatto C (solvent-extracted norbixin), Annatto F (alkali-processed norbixin, acid pre- cipitated), and Annatto G (alkali-processed norbixin, not acid precipitated). For the production of solvent-extracted bixin and norbixin, i.e. Annatto B and C, respectively, JECFA permitted the use of six food grade solvents as the extraction solvent: methanol, ethanol, 2-propanol, acetone, ethyl acetate, and hexane, and specified residue limits for each solvent in the final products (Table 1) [4]. The Euro- pean Food Safety Authority (EFSA) also specified limits for four residual solvents (methanol, acetone, hexane, and dichloromethane) against solvent-extracted bixin and nor- bixin (Table 1) [5]. The Code of Federal Regulations (CFR) of the United States does not classify annatto extracts, but states that annatto extracts should contain no more than six solvents (methanol, 2-propanol, acetone, hexane, dichloromethane, and trichloroethylene), residues of which are permitted in the corresponding spice oleoresins (Ta- ble 1) [6]. In Japan, annatto extracts are allowed to be used Table 1. Specified limits (ppm) of residual solvents in JE C F A, EU, and USA guidelines. Solvent JECFA EU USA Methanol 50 *50 50 Ethanol *50 - - 2-Propanol *50 - 50 Acetone 30 *50 30 Hexane 25 *50 25 Ethyl acetate *50 - - Dichloromethane - 10 *30 Trichloroethylene - - *30 *Individually or in combination. as one of the existing food additives, but have not yet been listed in the Japanese Standards of Food Additives. Therefore, specified limits of residual solvents are also not established. JECFA designated static headspace gas chromatogra- phy (HSGC) with a flame ionization detector (FID) as the general analytical method for the determination of resid- ual solvents in food additives [7]. The static headspace (HS) sampling method has more appropriate sensitivity than the direct injection method because it can clearly sepa- rate volatile analytes from the sample matrix and effec- tively concentrate them. Therefore, this method results in less complex sample preparation, decreased instrument contamination, and increased gas chromatography (GC) column life. The HS sampling process is based on ther- mostatic partitioning of volatile compounds between the sample diluent and the gas phase in a sealed vial. There- fore, the selection of the sample diluent is a critical factor affecting the precision of the HSGC analysis. A good sam- ple diluent for HS samplings should have a high stability, high boiling point, and high capability for dissolving large amount of samples [8]. In the general HSGC analytical method of JECFA specification, two solvents are listed as sample diluents: one is water (Method I) and the other is methanol (Method II) [7]. Water is a good diluent for HSGC because it offers a very low partition coefficient for analytes and has a low vapor pressure. However, an- natto extracts (bixin and the protonated form of norbixin) are insoluble in water as described above (Figure 2). Al- though annatto extracts are soluble in methanol, residual methanol in the sample cannot be determined if methanol is used as the diluent. Consequently, the general JECFA method is inapplicable for annatto extracts. The US Pharmacopeia (USP) General Chapter Resid- ual solvents (467), based on the European Pharmacopeia (EP) procedure [9], presented an HSGC method for test- ing procedures for residual solvents in pharmaceuticals. Interestingly, the procedures can be divided into two cate- gories on the basis of the solubility of the samples: wa- ter-soluble materials and water-insoluble materials [10,11]. Copyright © 2012 SciRes. AJAC  Y. ITO ET AL. 640 For the water-insoluble procedure, polar organic solvents, such as dimethyl sulfoxide (DMSO) and dimethylforma- mide (DMF), are designated as the sample diluent. These polar organic solvents have a higher boiling point than water and a high capacity for dissolving a wide range of organic substances. The HSGC method using DMF as the sample diluent has a higher precision than when water is used in the quantification of residual solvents in drug sub- stances [12]. In the JECFA specification of bixin-based products, DMF is designated as the solvent to dissolve and dilute samples in high-performance liquid chroma- tography (HPLC) analysis for impurities [9]. Therefore, we thought that DMF could become a suitable sample diluent for HSGC analysis of annatto extracts. There are a few reports on the determination of resid- ual solvents in annatto extracts [13-15]. In these reports, some samples showed high levels of residual methanol. However, most samples analyzed in these reports were not technical products (powder form) but liquid prepara- tions. In addition, the principle pigments of the samples were not described. To our best knowledge, there is no information about residual solvents in annatto extracts after the specification was issued by the 67th JECFA. In order to secure the safety and assure good manufacture practices (GMP) of commercial food additives, a precise quantification of residual solvents is essential. In the pre- sent study, we first developed a reliable and analytical method using HSGC for quantification of residual solvents in annatto extracts, and then precisely determined the levels of six residual solvents specified by JECFA in 23 com- mercial annatto extracts, including both bixin-based and norbixin-based products. 2. Experimental 2.1. Samples Twenty-three commercial products containing annatto ex- tracts were collected from Japanese food additives manu- facturers in 2011. The samples consisted of six bixin-based products (bix1-6) and 17 norbixin-based products (nbx1- 17). All samples were red or reddish purple powder and were stored at −20˚C until analyzed. 2.2. Chemical Reagents Organic solvents (methanol, ethanol, 2-propanol, acetone, ethyl acetate, and hexane) with ≥98% purity were pur- chased from Wako Pure Chemical Industries, Ltd (Osaka, Japan). DMF was used for residual solvent analyses and purchased from Kanto Chemical. Co., Inc. (Tokyo, Japan). Water was deionized using a Milli-Q water purification system (Millipore, Bedford, MA). 2.3. Sample Preparation A quantity (200 mg) of each annatto extract sample was accurately weighed in an Agilent 20 mL HS sample vial and DMF (2.5 mL) was added. The vial was immediately capped and sealed with a Teflon-lined septum and alumi- num crimp cap, and then mixed thoroughly until the en- tire sample was dissolved. Then, the capped vial was placed in the oven of the HS sampler. All samples were prepared in triplicate. 2.4. Standard Solutions and Calibration Curves A stock standard solution for each solvent was prepared as follows. Each 250 μL of methanol, ethanol, 2-propanol, and ethyl acetate, and each 150 μL of acetone and hexane was pipetted into a volumetric flask (20 mL) into which DMF (10 mL) had previously been added. The flasks were weighed to within 0.01 mg and then filled to capacity with DMF. A stock standard mixture solution was pre- pared by placing each stock standard solution (3.0 mL) in a volumetric flask (20 mL) and filling the flask to capac- ity with DMF. Standard mixture solutions used for the calibration curve were prepared by sequentially diluting the stock standard mixture solution with DMF to seven concentration levels. For the HSGC analysis, the standard mixture solution (0.1 mL) was pipetted into an Agilent 20 mL headspace HS sample vial and DMF (2.4 mL) was added to the vial. The vial was immediately capped and sealed as mentioned above. The samples were prepared in triplicate. To estab- lish calibration equations, the mean peak areas (n = 3) of standard solvents observed by HSGC analysis were plot- ted against concentration. External calibration curves were established over seven datapoints covering a concentra- tion range of approximately 1.0 - 700 ppm for methanol, ethanol, 2-propanol, and ethyl acetate and approximately 0.5 - 350 ppm for acetone and hexane. All the solvent concentrations were calculated on the basis of the 200 mg annatto extracts being dissolved in 2.5 mL of DMF. The final concentration of each standard solution used for the calibration curve is shown in Table 2. 2.5. Headspace Gas Chromatography Procedure An Agilent 6890 N GC equipped with an FID and a 7694 Table 2. Retention time and linearity of six standards sol- vents. Solvent RT (min) Range (ppm) R2 Methanol 5.148 0.9 - 679.2 0.9997 Ethanol 6.452 1.0 - 726.6 0.9992 2-Propanol 7.542 1.0 - 740.5 0.9996 Acetone 8.068 0.5 - 369.5 0.9998 Hexane 9.608 0.4 - 327.8 0.9999 Ethyl acetate 12.713 1.0 - 717.4 0.9998 Copyright © 2012 SciRes. AJAC  Y. ITO ET AL. 641 K-special HS sampler was used for the experiments. The GC column was a GL Sciences AQUATIC-2 (25% phe- nyl/75% methyl polysiloxane)—fused silica capillary co- lumn: length, 60 m; internal diameter, 0.25 mm; film thick- ness, 1.40 mm (Part No. 123-1334, Serial No. US1613334- H). The initial temperature of the column oven was 40˚C, and this was maintained for 5 min, then raised at a rate of 4˚C/min to 92˚C and maintained for 2 min, and then raised at a rate of 40˚C/min to 230˚C. The injection temperature was 250˚C, and the FID detector temperature was 260˚C. Helium at 205 kPa was used as the carrier gas (constant flow, 1.8 mL/min) and the split ratio was 25:1. The head- space HS was sampled as follows: the vial was main- tained at 60˚C for 20 min with continuous agitation. The size of injection loop was 3 mL. The needle temperature was 100˚C and the transfer line temperature was 120˚C. 2.6. Recovery Recovery rates of standard solutions for three selected samples (bix1, bix4, and nbx8) were calculated using the standard addition method. The standard mixture solution spiked in the sample was individually prepared as fol- lows. Bix1: stock standard solutions of methanol (0.2 mL), ethanol (0.2 mL), 2-propanol (1.4 mL), acetone (0.4 mL), ethyl acetate (0.2 mL), and hexane (0.2 mL) were pipet- ted into a volumetric flask (20 mL) and filled with DMF. Bix4: stock solutions of methanol (1.4 mL), ethanol (0.2 mL), 2-propanol (0.2 mL), acetone (1.4 mL), ethyl ace- tate (0.2 mL), and hexane (0.2 mL) were pipetted into a volumetric flask (20 mL) and filled with DMF. Nbx8: stock solutions of methanol (0.2 mL), ethanol (0.2 mL), 2-propanol (0.2 mL), acetone (0.8 mL), ethyl acetate (0.2 mL), and hexane (0.2 mL) were pipette in a volumetric flask (20 mL) and filled with DMF. The final concentra- tion of each spiked standard solution was shown in Table 3. The samples (200 mg) were separately weighed in a HS vial (20 mL), dissolved in DMF (2.4 mL), and spiked with the standard mixture solution (0.1 mL) prepared for each sample. Quantitative analysis was performed by the Table 3. Quantification limit (QL) and detection limit (DL) and precision of six solvents. Solvent QL (ppm) DL (ppm) Precision at WL* (RSD%, n = 3) Precision at LL** (RSD%, n = 3) Methanol 12.93 3.53 2.79 8.98 Ethanol 13.22 3.61 2.69 4.61 2-Propanol 14.25 3.98 3.31 4.14 Acetone 3.64 0.92 0.82 4.79 Hexane 0.30 0.01 0.57 0.75 Ethyl acetate 6.23 1.62 0.68 4.89 *Working concentration level (20 - 50 ppm); **Low concentration level (4 - 10 ppm). HSGC procedure as described above. The recovery rate was calculated by comparing the amount of standard in the spiked sample with the amount in the non-spiked an- natto extract sample (control). Each analysis was performed in triplicate. 3. Results and Discussion 3.1. Headspace Gas Chromatography Method As the sample diluent for HSGC analysis, DMF was se- lected owing its high boiling point and high capacity for dissolving organic compounds. As expected, DMF was able to dissolve both bixin-based and norbixin-based products, while water, designated as a sample diluent by JECFA, was unable to dissolve either product (Figure 2). The equilibration temperature for HS sampling was set at 60˚C, because this is the JECFA-recommended tempera- ture for the general HSGC method, and it was reported that bixin gradually degrades to several products at tem- peratures above 70˚C [16]. The equilibration time for HS sampling was determined as 20 min on the basis of the saturation of peak areas of standard solutions on the gas chromatogram (data not shown). The established HSGC procedure using a capillary column AQUATIC-2 gave a good separation of six standard solvent peaks (methanol, ethanol, 2-propanol, acetone, ethyl acetate, and hexane) on the chromatogram (Figure 3). Retention time for each solvent is shown in Table 2. To assess linearity, calibra- tion curves of six solvents were constructed over a range of seven concentrations using standard mixture solutions. Good linearity was achieved over the concentration ranges of approximately 1.0 - 700 ppm for methanol, ethanol, 2-propanol, and ethyl acetate, and approximately 0.5 - 350 ppm for acetone and hexane (Table 2). The regression coefficients (R2) for the curves of six solvents range from 0.9992 to 0.9999 (Table 2). The sensitivity of the HSGC method is presented as QL with a signal-noise ratio of 10:1, and detection limit (DL) with a signal-noise ratio of 3:1. The QL values of methanol, ethanol, and 2-propanol are evaluated in the range from 12.93 to 14.25 ppm and the values of other solvents ranged from 0.30 to 6.23 ppm (Table 3). Because the QL values of all solvents are sat- isfactorily lower than the specified limits required by the JECFA guideline, the results demonstrate that the estab- lished HSGC method is sufficiently sensitive for the quan- tification of residues of six solvents in annatto extracts. To assess the accuracy of the method, recovery rates for six solvents were calculated using the spike of a standard solution mixture to three samples (bix1, bix4, and nbx8). Each concentration of the spiked solvent standard was se- lected on the basis of the specified limits of JECFA (Ta- ble 4). When the concentrations of the residual solvent measured using the HSGC method significantly exceeded the specified limits, the concentrations of spiked solvent Copyright © 2012 SciRes. AJAC 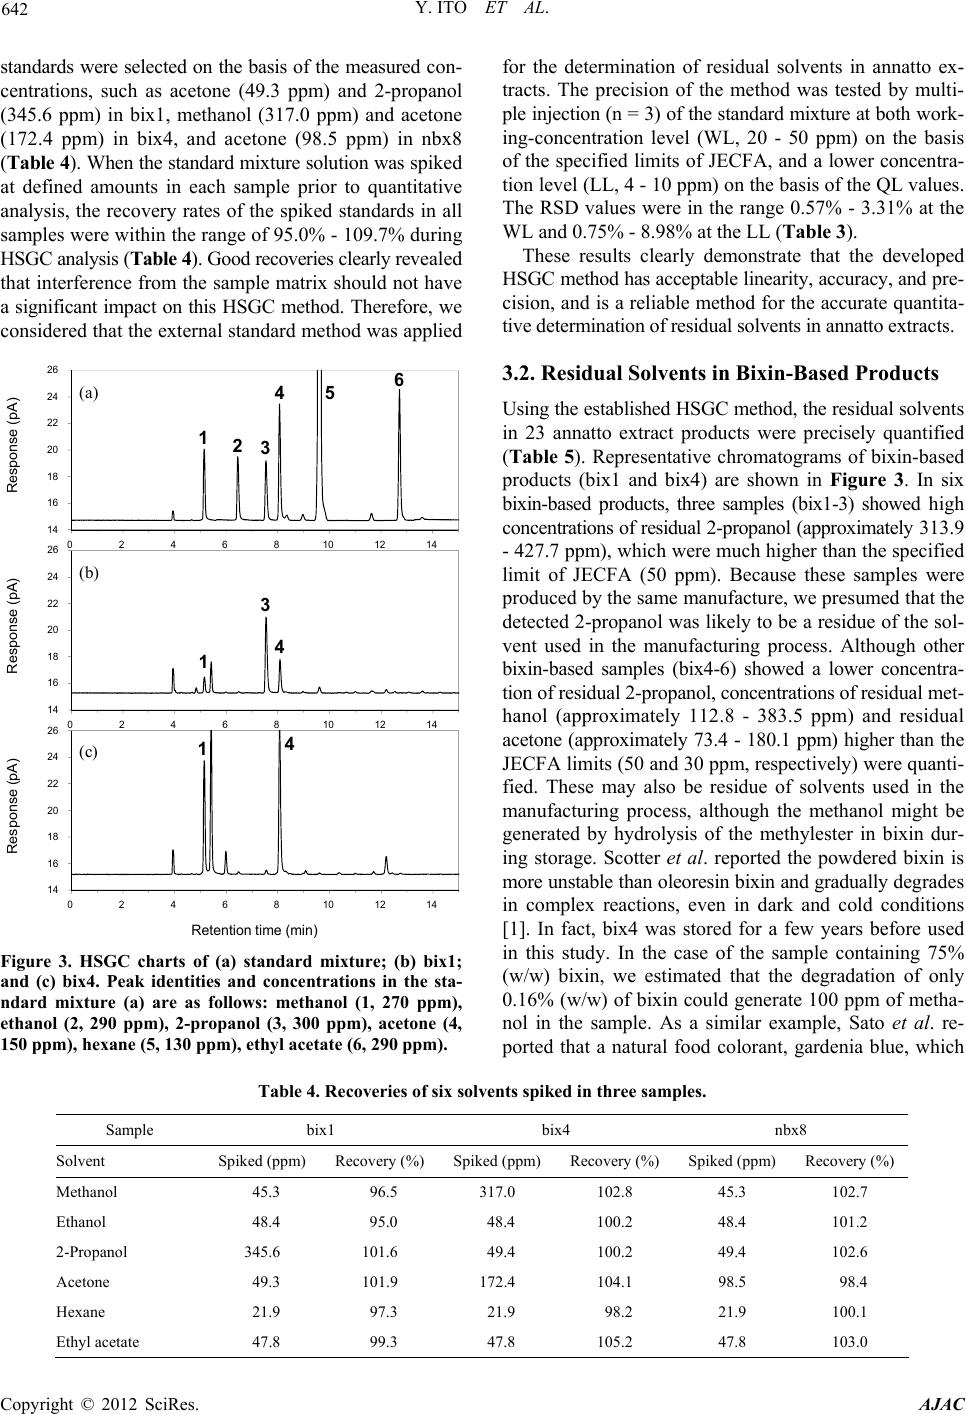 Y. ITO ET AL. Copyright © 2012 SciRes. AJAC 642 standards were selected on the basis of the measured con- centrations, such as acetone (49.3 ppm) and 2-propanol (345.6 ppm) in bix1, methanol (317.0 ppm) and acetone (172.4 ppm) in bix4, and acetone (98.5 ppm) in nbx8 (Table 4). When the standard mixture solution was spiked at defined amounts in each sample prior to quantitative analysis, the recovery rates of the spiked standards in all samples were within the range of 95.0% - 109.7% during HSGC analysis (Table 4). Good recoveries clearly revealed that interference from the sample matrix should not have a significant impact on this HSGC method. Therefore, we considered that the external standard method was applied 14 16 18 20 22 24 26 024681 Response (pA) for the determination of residual solvents in annatto ex- tracts. The precision of the method was tested by multi- ple injection (n = 3) of the standard mixture at both work- ing-concentration level (WL, 20 - 50 ppm) on the basis of the specified limits of JECFA, and a lower concentra- tion level (LL, 4 - 10 ppm) on the basis of the QL values. The RSD values were in the range 0.57% - 3.31% at the WL and 0.75% - 8.98% at the LL (Table 3). These results clearly demonstrate that the developed HSGC method has acceptable linearity, accuracy, and pre- cision, and is a reliable method for the accurate quantita- tive determination of residual solvents in annatto extracts. 3.2. Residual Solvents in Bixin-Based Products 01214 14 16 18 20 22 24 26 024681 Response (p A ) 01214 14 16 18 20 22 24 26 024681 Response (pA ) a b c Retention time 01214 min 123 45 1 3 4 14 6 (a) (b) (c) Using the established HSGC method, the residual solvents in 23 annatto extract products were precisely quantified (Table 5). Representative chromatograms of bixin-based products (bix1 and bix4) are shown in Figure 3. In six bixin-based products, three samples (bix1-3) showed high concentrations of residual 2-propanol (approximately 313.9 - 427.7 ppm), which were much higher than the specified limit of JECFA (50 ppm). Because these samples were produced by the same manufacture, we presumed that the detected 2-propanol was likely to be a residue of the sol- vent used in the manufacturing process. Although other bixin-based samples (bix4-6) showed a lower concentra- tion of residual 2-propanol, concentrations of residual met- hanol (approximately 112.8 - 383.5 ppm) and residual acetone (approximately 73.4 - 180.1 ppm) higher than the JECFA limits (50 and 30 ppm, respectively) were quanti- fied. These may also be residue of solvents used in the manufacturing process, although the methanol might be generated by hydrolysis of the methylester in bixin dur- ing storage. Scotter et al. reported the powdered bixin is more unstable than oleoresin bixin and gradually degrades in complex reactions, even in dark and cold conditions [1]. In fact, bix4 was stored for a few years before used in this study. In the case of the sample containing 75% (w/w) bixin, we estimated that the degradation of only 0.16% (w/w) of bixin could generate 100 ppm of metha- nol in the sample. As a similar example, Sato et al. re- ported that a natural food colorant, gardenia blue, which Figure 3. HSGC charts of (a) standard mixture; (b) bix1; and (c) bix4. Peak identities and concentrations in the sta- ndard mixture (a) are as follows: methanol (1, 270 ppm), ethanol (2, 290 ppm), 2-propanol (3, 300 ppm), acetone (4, 150 ppm), hexane (5, 130 ppm), ethyl acetate (6, 290 ppm). Table 4. Recoveries of six solvents spiked in three samples. Sample bix1 bix4 nbx8 Solvent Spiked (ppm) Recovery (%)Spiked (ppm)Recovery (%)Spiked (ppm) Recovery (%) Methanol 45.3 96.5 317.0 102.8 45.3 102.7 Ethanol 48.4 95.0 48.4 100.2 48.4 101.2 2-Propanol 345.6 101.6 49.4 100.2 49.4 102.6 Acetone 49.3 101.9 172.4 104.1 98.5 98.4 Hexane 21.9 97.3 21.9 98.2 21.9 100.1 Ethyl acetate 47.8 99.3 47.8 105.2 47.8 103.0  Y. ITO ET AL. 643 Table 5. Concentrations of residual solvents in 23 commerc i al products. Concentrations of residual solvents (ppm) and RSD (%) Type No. Methanol Ethanol 2-Propanol Acetone Hexane Ethyl acetate bix1 49.7 (0.4) nd 369.3 (1.2) 44.0 (2.0) 0.6 (1.4) nd bix2 38.2 (5.0) nd 316.2 (1.0) 28.2 (3.7) 0.7 (9.9) nd bix3 35.0 (2.9) nd 438.4 (2.8) 27.5 (1.7) nd nd bix4 394.5 (4.7) nd nd 179.8 (5.0) nd nd bix5 119.4 (1.1) nd nd 95.7 (1.8) nd nd Bixin bix6 166.0 (0.7) nd nd 75.2 (0.2) nd nd nbx1 nd nd nd 27.1 (2.4) nd nd nbx2 nd nd nd 23.4 (2.2) nd nd nbx3 nd nd nd 26.8 (4.2) nd nd nbx4 41.1 (1.5) nd nd 106.0 (0.8) nd nd nbx5 nd nd nd 102.7 (1.8) nd nd nbx6 nd nd nd 45.0 (3.1) nd nd nbx7 432.9 (1.9) 4375 (1.0) nd 36.0 (1.8) nd 11.5 (2.5) nbx8 23.8 (2.0) nd nd 98.8 (2.0) nd nd nbx9 25.6 (1.2) nd nd 24.8 (0.2) nd nd nbx10 51.2 (0.5) nd nd 19.3 (2.1) nd nd nbx11 nd nd nd 44.2 (4.4) nd nd nbx12 nd nd nd 33.6 (0.8) nd nd nbx13 nd nd nd 25.1 (2.6) nd nd nbx14 nd nd nd nd nd nd nbx15 nd nd nd nd nd nd nbx16 nd nd nd 42.6 (1.4) nd nd Norbixin nbx17 nd 26.0 (0.8) 29.8 (1.6) 139.5 (3.6) nd nd Data are means for three trials; nd = not determined. contains methylester structures, showed a high concen- tration of residual methanol, and suggested that methanol could be generated by spontaneous hydrolysis of the me- thylester [17]. Based on this knowledge, the concentra- tion limit of residual methanol in gardenia blue is set as 1000 ppm in Japanese Standards of Food Additives. It might be necessary to investigate the generation of metha- nol by the degradation of bixin during storage. The resi- due levels of other solvents (ethanol, ethyl acetate, and hexane) were lower than QL in bixin-based samples. 3.3. Residual Solvents in Norbixin-Based Products The represented chromatograms of norbixin-based prod- ucts were shown in Figure 4 (nbx4, nbx7, and nbx14). In the case of norbixin-based samples, the levels of residual 2-propanol, hexane, and ethyl acetate were lower than the limits of JECFA. However, residual acetone was detected at a higher concentration than the JECFA limit (30 ppm) in nine samples (nbx4, 5, 6, 7, 8, 11, 12, 16, and 17). Although the origin of acetone in the norbixin-based prod- ucts is not as clear as in the bixin-based products, it should be noted that residual acetone was determined in 15 out of 17 samples examined. Residual methanol in the nor- bixin-based samples was at a lower level than the speci- fied limit, with the exception of nbx7. In nbx7, ethanol was also detected at high concentration (4375 ppm) in addition to residual methanol, suggesting that the results may be caused by imperfect purification in the manufac- turing process. 4. Conclusion In this study, a reliable HSGC method using DMF as sam- ple diluent is established for the determination of residual solvents in annatto extracts. With the established method, six residual solvents (methanol, ethanol, 2-propanol, ace- tone, ethyl acetate, and hexane) specified by JECFA were precisely determined in 23 commercial bixin-based and norbixin-based products. The results revealed that some bixin-based products contained a higher concentration of residual methanol and 2-propanol than the JECFA-spec- ified limit (50 ppm). Furthermore, 13 samples showed a higher concentration of residual acetone than the speci- fied JECFA limit (30 ppm). We would like to note that Copyright © 2012 SciRes. AJAC  Y. ITO ET AL. 644 14 16 18 20 22 24 26 0246810 Response (pA) 1214 14 16 18 20 22 24 26 0246810 Response (pA) 1214 14 16 18 20 22 24 26 0246810 Response (pA) 1214 14 16 18 20 22 24 26 0246810 Response (pA ) a b c d 123 45 1 1 4 4 4 2 Retention time 1214 6 min (a) (b) (c) (d) Figure 4. HSGC charts of (a) standard mixture; (b) nbx4; (c) nbx7; and (d) nbx14. Peak identities and concentrations in the standard mixture (a) are the same as in Figure 3. all products used in this study were imported and were not processed by Japanese manufactures. In short, the find- ings of this study imply that annatto extracts distributed worldwide also contained a similar level of residual sol- vents as detected in this study. Based on the results, fur- ther investigation on worldwide products and a reevalu- ation of the current specified limits for residual solvents in annatto extracts is required. REFERENCES [1] M. Scotter, “The Chemistry and Analysis of Annatto Food Colouring: A Review,” Food Additives and Con- taminants, Vol. 26, No. 8, 2009, pp. 1123-1145. doi:10.1080/02652030902942873 [2] M. J. Scotter, S. A. Thorpe, S. L. Reynolds, L. A. Wilson and P. R. Strutt, “Characterization of the Principal Col- ouring Components of Annatto Using High Performance Liquid Chromatography with Photodiode-Array Detec- tion,” Food Additives and Contaminants, Vol. 119, No. 3, 1994, pp. 301-315. doi:10.1080/02652039409374229 [3] Codex Alimentarius Commission, “Report of the 39th Session of the Codex Committee on Food Additives,” Beijing, 24-28 April 2007. [4] Joint FAO/WHO Expert Committee of Food Additives, “FAO JECFA Monographs 3 Combined Compendium of Food Additive Specification,” Vol. 3, Food and Agricul- ture Organization of the United Nations, Rome, 2006, pp. 3-7. [5] “Commission Directive 2008/128/EC of December 22, 2008 Laying down Specific Purity Criteria Concerning Colours for Use in Foodstuffs,” Official Journal of the European Union, Vol. 6, 2009, pp. 20-63. [6] “Code of Federal Regulations, Title 21, Part 73 Listing of Color Additives Exempt from Certification, Subpart A Foods, Sec. §73.30 Annatto Extract,” 2011. [7] Joint FAO/WHO Expert Committee of Food Additives, “FAO JECFA Monographs 1, Combined Compendium of Food Additive Specification,” Vol. 4, Food and Agricul- ture Organization of the United Nations, Rome, 2006, pp. 87-89. [8] C. Cheng, S. Liu, B. J. Mueller and Z. Yan, “A Generic Static Headspace Gas Chromatography Method for De- termination of Residual Solvents in Drug Substance,” Journal of Chromatography A, Vol. 1217, No. 41, 2010, pp. 6413-6421. doi:10.1016/j.chroma.2010.08.016 [9] R. Otero, G. Carrera, J. F. Dulsat, J. L. Fabregas and J. Claramunt, “Static Headspace Gas Chromatographic Me- thod for Quantitative Determination of Residual Solvents in Pharmaceutical Drug Substances According to Euro- pean Pharmacopoeia Requirements,” Journal of Chro- matography A, Vol. 1057, No. 1-2, 2004, pp. 193- 201. doi:10.1016/j.chroma.2004.09.023 [10] “US Pharmacopeia 32-National Formulary 27, Residual Solvents <467>,” Suppl. 1, Rockville, MD: USP, 2009, p. 3948. [11] J. L. Belsky, A. J. Ashley, P. A. Bhatt, K. V. Gilbert, H. R. Joyce, C. Pan, H. Pappa and S. Z. Wahab, “Optimiza- tion of the Water-Insoluble Procedures for USP General Chapter Residual Solvents <467>,” AAPS PharmSciTech, Vol. 2, No. 2, 2010, pp. 994-1004. doi:10.1208/s12249-010-9460-6 [12] S. Klick and A. Sköld, “Validation of a Generic Analyti- cal Procedure for Determination for Residual Solvents in Drug Substances,” Journal of Pharmaceutical and Bio- medical Analysis, Vol. 36, No. 2, 2004, pp. 401-409. doi:10.1016/j.jpba.2004.06.014 [13] Y. Uematsu, M. Hirokado, K. Hirata, K. Nakajima and M. Karamu, “Determination of Residual Organic Solvent in Natural Color Preparations by Standard Addition Head- Space Gas Chromatography,” Journal of the Food Hygi- enic Society of Japan, Vol. 34. No. 3, 1993, pp. 232-238. doi:10.3358/shokueishi.34.232 [14] Y. Uematsu, M. Ogimoto, K. Suzuki, J. Kabashima, K. Ito and M. Nakazato, “Survey of Residue Levels of Or- ganic Solvents in ‘Existing Food Additives’ and Health Food Materials by Head-Space GC,” Journal of the Food Hygienic Society of Japan, Vol. 49, No. 5, 2008, pp. Copyright © 2012 SciRes. AJAC  Y. ITO ET AL. Copyright © 2012 SciRes. AJAC 645 366-375. doi:10.3358/shokueishi.49.366 [15] Y. Uematsu, K. Hirata, K. Suzuki, K. Iida and K. Kamata, “Survey of Residual Solvents in Natural Food Additives by Standard Addition Head-Space GC,” Food Additives and Contaminants, Vol. 19, No. 4, 2002, pp. 335-342. doi:10.1080/02652030110088301 [16] M. J. Scotter, L. A. Wilson, G. P. Appleton and L. Castle, “Analysis of Annatto (Bixa orellana) Food Coloring For- mulations. 1. Determination of Coloring Components and Colored Thermal Degradation Products by High-Per- formance Liquid Chromatography with Photodiode Array Detection,” Journal of Agricultural and Food Chemistry, Vol. 46, No. 3, 1998, pp. 1031-1038. doi:10.1021/jf970063+ [17] K. Sato and T. Maitani, “Determination of Methanol in Gardenia Blue and Gardenia Red,” ShokuhinEiseigaku- Zasshi, Vol. 44, No. 1, 2003, pp. 73-76. doi:10.3358/shokueishi.44.73
|