Journal of Cancer Therapy
Vol.2 No.2(2011), Article ID:5489,10 pages DOI:10.4236/jct.2011.22031
Power Doppler Vocal Fremitus Breast Sonography: Differential Diagnosis with a New Classification Scheme
—Power Doppler Vocal Fremitus Examination of Breast Lesions
![]()
1Department of Radiology, Kasimpasa Military Hospital, Beyoglu, Turkey;
2Department of Radiology, Yeditepe University Hospital, Kozyatagi, Turkey;
3Department of Surgery, Yeditepe University Hospital, Kozyatagi, Turkey;
4E-sitopatoloji Laboratories, Valikonagi cad, Birlik Apt, Nisantasi, Turkey.
Email: {yildirimduzgun, bengur0, drbaki}@yahoo.com, esitopatoloji@gmail.com
Received February 21st, 2011; revised March 23rd, 2011; accepted May 31st, 2011.
Keywords: Breast, Ultrasonography, Doppler
ABSTRACT
Purpose: In this study, unlike the previous studies, and Power Doppler vocal fremitus test (PDVFT) is utilized and is evaluated in subcategories to assess its role in the differentiation of benign and malignant lesions. Materials and Methods Thorough the 161 lesions of 147 patients are included in this prospective study. During PDVFT, it is determined that eight different fremitus patterns have broken out according to the colour aliasing during patient’s vocal phonation. It is also grouped as, according to the lesion color aliasing pattern during vibration: (c) for central, (p) for peripheral, (d) for perilesional-desmoplastic, (e) for eccentric, (h) for heterogenous-hierarchic, (s) for septal, (t) for total, (z) for absent-zero. Thereafter, the patterns and histopathological results of the lesions are correlated and analysed statistically. Results Out of 161 lesions, (benign: 133 and malignant, 28 cases) totally 189 patterns are encountered. None of the patterns z, t, s or e was detected in any of the malignant lesions. Specific values for different patterns have been obtained which changing between 29% and 100%. After adding the PDVFT finding, the newly generated BIRADS scheme has the accuracy value as high 91%. Conclusion When it is classified according to the colour aliasing pattern(s) of lesion in PDVFT; the “p” pattern is seen about the same ratio in both malign lesion and benign lesion (nonspecific patterns); “c, d, h” patterns mostly related with malignancy, whereas “e, s, t, z” patterns related with benignity. With adding the PDVFT findings; accuracy of well known BIRADS categorization and lesion demarcation were also improved successfully.
1. Introduction
For the screening of breast cancer, still, the imaging modality of choice is mammography [1]. Since the specificity of mammography is rather limited, ultrasound (US) is performed frequently to further evaluate the lesions seen on mammography [1]. With the help of US, differentiation of solid and cystic lesions, evaluation of the vascularity in solid masses have been possible, additionally [1,2]. With the advent of technology in the US equipments, not only the imaging resolution is increased, but also the perfusion patterns of lesions can now be evaluated with power Doppler mode and the elasticity of the lesion and perilesional tissues can be evaluated with the help of elastography [3,4]. The most important driving factor for the technical advances in this area is the absence of an ideal imaging method to differentiate between benign and malignant breast lesions [4-12].
In the evaluation of focal breast lesions with US, one of the new trends is using Power Doppler US which enables demonstration of slow flow patterns without considering the directional data. Neovascularization with hierarchical vascular pattern, arteriovenous shunts can be demonstrated with power Doppler US in neoplastic lesions which aims to differentiate between benign and malignant breast tumors [1-3]. However, the extent of tumor vascularity is not a sufficient criterion for differential diagnosis and identification of fast growing tumoral capillaries has not gained clinical relevance up till now (2-5). Correspondingly, there are lots of studies about the efficiency of power Doppler US in this era [2, 4-6].
In this prospective study, real time Doppler mode US was not used in its classical form which is aimed to show vascularity of the lesions. Instead, fremitus was induced with the help of phonation during power Doppler mode. Power Doppler Vocal Fremitus Test (PDVFT) is a method that depends on the theory of the distinctive color aliasing patterns which can theoretically be used to differentiate benign and malignant lesions. This technique has first been used in the 1990s [1]. In this study, differently from previously published but limited data, the the color aliasing patterns of lesions in power Doppler mode obtained during phonation were classified. And the role of these distinct patterns were investigated in the differentiation of benign-malignant lesions.
2. Materials and Methods
Prior to this prospective study, the approval of the ethics committee was obtained and before each examination. Patients were informed about the procedure in detail and oral consent was obtained from each patient prior to the examination. Totally 359 patients with the suspicion of breast malignancy in a certain time interval examined with test and only 147 cases whose diagnosis were confirmed before the end of the study, were included. In all of these patients (patient: 147, lesion: 161; age range: 23-72; mean age: 43 years), the final diagnosis was determined by different methods. These lesions also had the diagnostic histopathology (n = 36 cases: 13 tru-cut, 23 excisional biopsy) results. In other cases, diagnoses were confirmed by dynamic breast MRI studies (n = 59), FNAB cytology results (n = 18), and third-year sonomammographic control results (n = 101).
US studies were performed with new generation system (Siemens, Antares 5.0). Linear high resolution superficial transducer (12 MHz frequency) has been used. In all patients, gray scale US (GUS), color Doppler US (CDUS) and PDVFT findings were analyzed respectively.
All of the patients were examined in the supine position with the arms above their head. After the conventional GUS and CDUS examinations, patients were instructed by a short trial about phonation during test. With beginning of inspiration, patients carried out a “humming” to produce a vibration effect through the thoracic walls. After one trial, PDVFT was performed by inserting power window mode on the lesion, which was coherent to the lesion boundaries. The effect of thoracic vibration which has been provided by phonation on lesion color aliasing was recorded during humming. Pulse repetition frequency (PRF) values have been adjusted to sub-maximal levels for each patient (ranging between 500 - 1500 Hz). Thus, no matter how much weight does patient, or how weak phonation he/she does, submaximal PRF values for each case has made possible to review each case in standard gain settings. A moderate and homogeneous compression has been provided by holding the transducer upright to the lesion and breast wall in terms of not to impede the spreading fremitus effect. In the end, all of the cine-images have been recorded. Concerning only the power Doppler fremitus acquisition time, the examination took 3 - 5 minutes (mean: 3.7 mins) additional to the conventional US procedures. All of the recorded images have been investigated individually frame by frame. The color aliasing patterns of each lesion have been determined and noted by two radiologists, who have experienced for 5 years in breast imaging. Through each recorded cine-film, images with the least motion artifact but with maximal color aliasing along the lesion boundaries homogenously were captured and recorded as representing image.
With considering the different alliasing patterns, we have grouped the fremitus patterns into special sub-types. In this classification; the codes are representatives of special aliasing patterns as following: “c”: for lesions showing fremitus centrally, “p”: for lesions showing peripheral fremitus, “d”: for lesions that exhibited thin rim like fremitus pattern, “e”: for lesions having an eccentric fremitus, “h”: in the presence of heterogeneous and also hierarchical fremitus pattern, “s”: for lesions vibrating internal septal, and “t”: for lesions showing homogeneous color aliasing by fremitus, have been used. In the presence of absent color aliasing; the code “z” has been used (Figure 1). During determination of the patterns, the pattern with ≥95% dominancy was accepted directly as the single fremitus pattern of the lesion. If the percentage for any pattern was less than that, the dominant two or three patterns were recorded. Patterns occupying less than 5% of the lesion were ignored, to prevent confusion.
Other features of examined lesions are cathegorized and numbered as following to facilitate the statistical analyses:
Lesion localization (central-subareolar: 1, upper outer quadrant: 2, upper inner quadrant: 3, the lower inner quadrant: 4, the lower outer quadrant: 5 in the form of coded), lesion depth (according to the distance from the skin; less than 0.5 cm: I, 0.5 - 1.0 cm: II, greater than 1.0 cm: III), lesion size (smaller than 1 cm: S; 1 - 2 cm: M, greater than 2cm: L) were measured for each mass and data were recorded in the table according to the codes which identified in parentheses.
In order to transform the raw data and for the analysis, the SPSS (Statistical Package for Social Sciences) for Windows 15.0 statistical software package program was
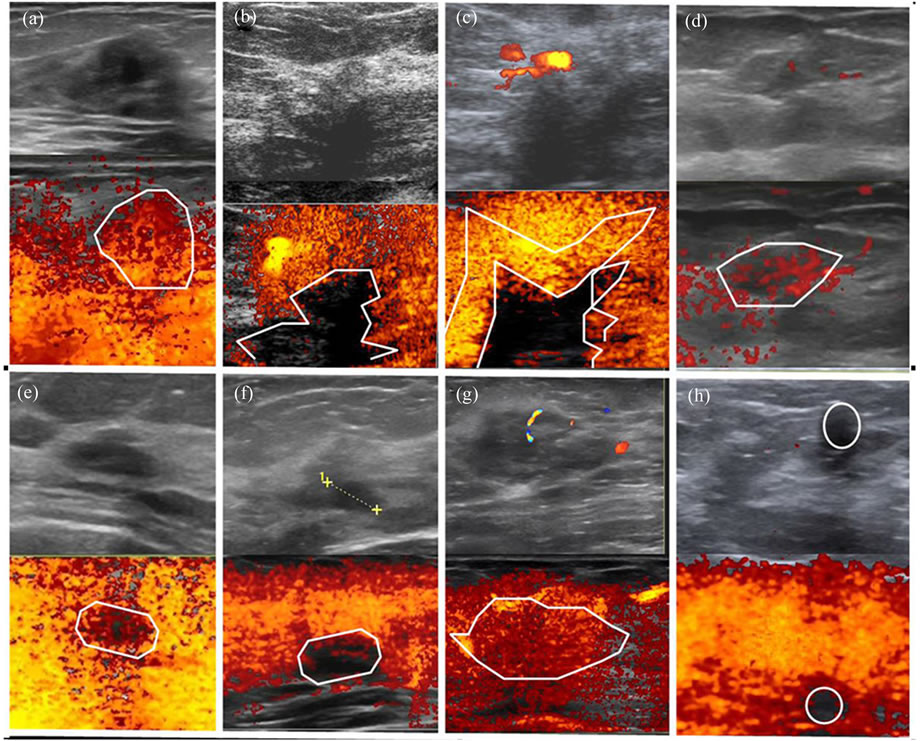
Figure 1. Classification of the patterns according to main fremitus type(s) were shown in the same image with gray scale or color Doppler images and associated (encircled with white lines) PDVF images, respectively. (a) “c”: for lesions showing fremitus centrally. (b) “p”: for lesions showing peripheral fremitus. (c) “d”: for lesions that exhibited thin rim like fremitus pattern. (d) “e”: for lesions having an eccentric fremitus. (e) “h”: in the presence of heterogeneous=hierarchical fremitus pattern. (f) “s”: for lesions vibrating internal septal. (g) “t”: for lesions showing homogeneous color aliasing. (h) “z”: for the absent color aliasing during phonation.
used. The comparisons among the lesion location, size, depth were evaluated with the Chi-square test and P < 0.05 values were regarded as significant. During data analysis through descriptive statistics, the frequency (number) and percentage (%) values were used. For differentiating malignant lesions from the benign ones, for each patterns (c, p, d, e, h, s, t, z) sensitivity (sens), specificity (spec), positive predictive value (pPV), negative predictive value (nPV) were calculated.
The lesions have been categorized primarily according to the BIRADS classification system correlation with available data (sonography, mammography, magnetic resonance imaging and/or prior exminations) prior to the PDVFT examination by one of the authors (radiologist). The same author, who was also blinded to the end-diagnoses, has compared the gray scale and color Doppler with the selected PDVFT images for determineing the demarcation (contour features) of the lesions. For each lesion, the observer compared the optimum gray scale image with the corresponding PDVFT image and marked the image with better demarcation as “positive”. After obtaining the statistical results, the same radiologist who is blinded to the diagnostic data have composed new BIRADS categories with adding PDFVT findings (new classification scheme). With this scheme, lesions which have been showing e, s, t, z patterns during PDVFT were accepted as benign. Than pre and post test “sens, spec, pPV, nPV, acc” values were compared statistically.
During the study, some special color aliasing types on PDVT images which have distinguishing forms according to the tissue composition noted and commented, also.
3. Results
At the end of this study, 161 lesions (malignant: 28, benign: 133) detected in 147 patients (Table 1). During phonation under power Doppler mode, in one lesion there were three fremitus patterns; and in 26 lesions, two patterns have occurred simultaneously. In all of the other lesions, only single pattern which was dominantly seen has been taken into consideration. Because of the concurrent two or three patterns, the total number of patterns included in this study has been determined as 189.
Depth, size and location differences between lesions were found statistically insignificant (p = 0.16; p = 0.40; p = 0.91, respectively).
The data including sens, spec, ppv, npv, acc values is summarized briefly for each pattern, in Table 2. None of the fremitus patterns; “z”, “t”, “s”, or “e” were observed as the dominant pattern in malignant lesions (Table 3).
These patterns which have high (100%) specifity values for benignity were reviewed for new BIRADS classification (post-test) and lesions which shows these patterns accepted as benign and category revised (Table 4). In 8 benign cases recorded as BIRADS-IV (2 hamartomas, 2 adenosis foci, 1 complicated cyst, 1 degenerated fibroadenoma, 1 fatty necrosis, 1 fibroadenoma which is in very close contact with a fat lobule), the BIRADS category was reduced by one category and these cases have been identified finally as BIRADS-III. Also, in 12 benign cases; focal fibrocystic changes (including adenosis and complicated cysts) (n = 5), Cooper ligament shadowings (n = 3), degenerated fibroadenoma (n = 1), fat lobules (n = 3) that were previously reported as BIRADS-III are reported as BIRADS-II. Two (n = 2) lesions (one infiltrating ductal carcinoma and one mucinous type ductal carcinoma) which were initially categorized as BIRADS III, have been classified as category IV. According to these data; it is obvious that 5 lesions in BIRADS category III and 6 benign in BIRADS category IV have to be changed though to other (I, II, V and VI) categories were accurate.
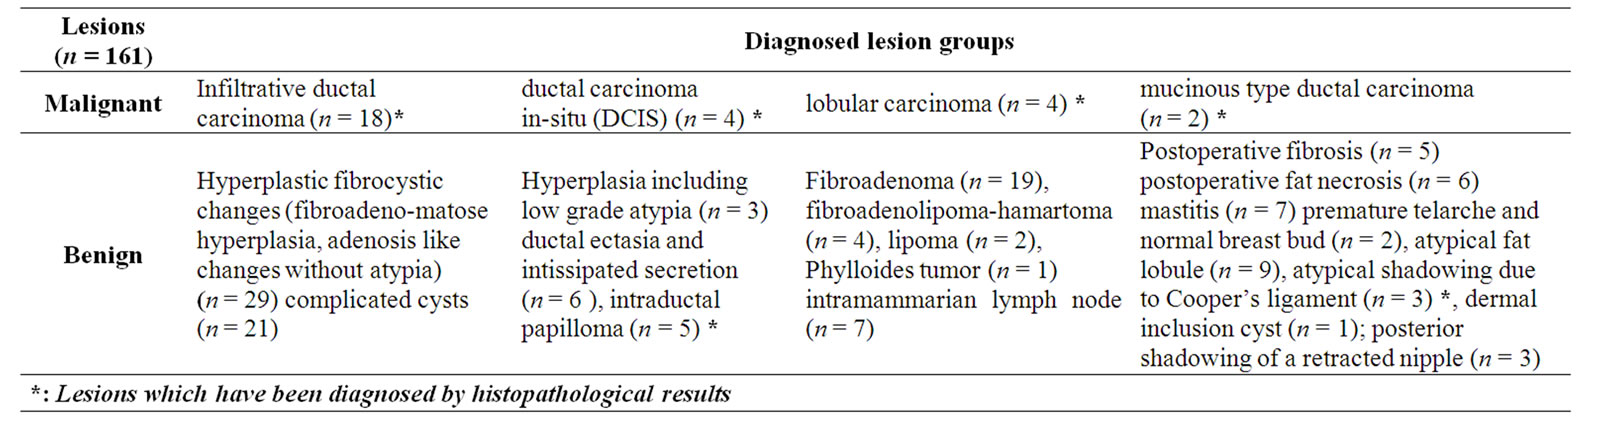
Table 1. Detailed description of the lesions in the 147 patients.
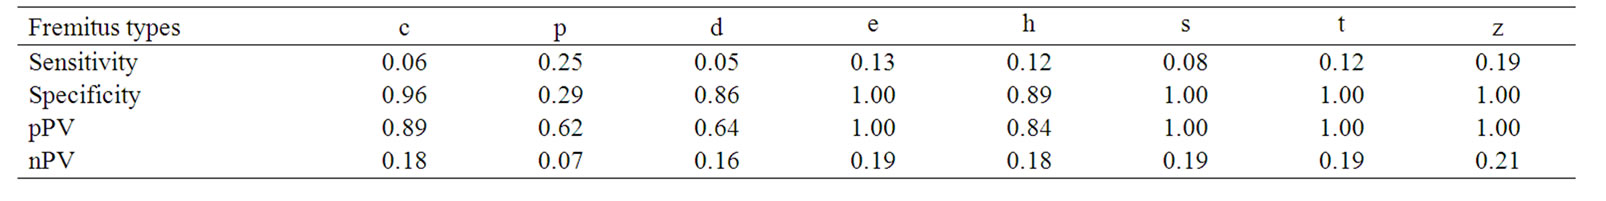
Table 2. Sensitivity-Specificity, PPV, NPV and accuracy values of different fremitus patterns in terms of discrimination between benign and malignant lesions.
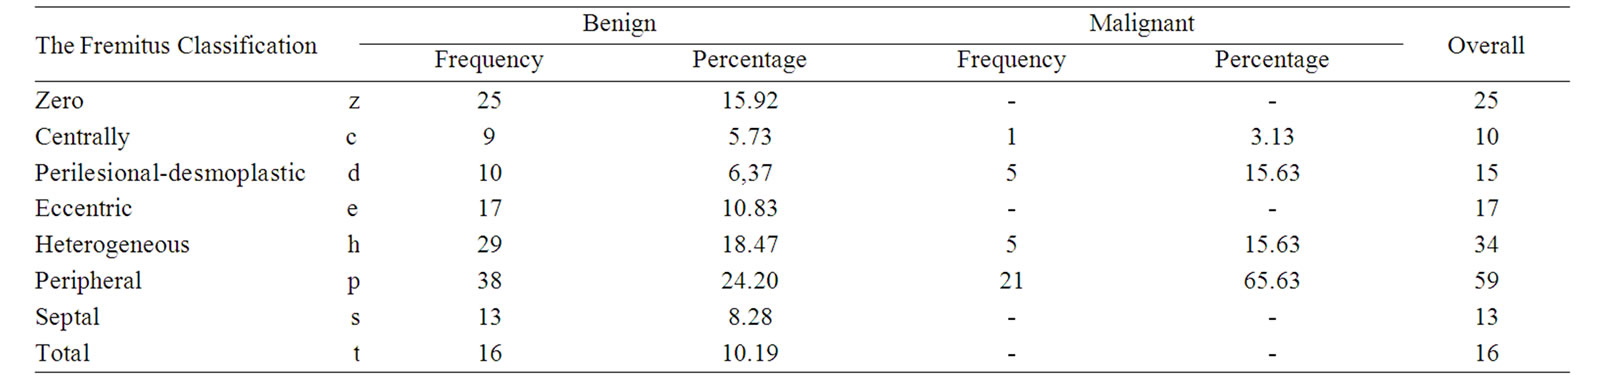
Table 3. Distribution of fremitus patterns among benign and malignant lesions.
Table 4. BIRADS categorization of the lesions before and after the implementation of the PDVFT findings.
With using the new scheme, BIRADS category in 14% of groups had to be changed and so improved with adding our PDVFT results. So, sens, spec, ppv, npv, acc values for pre and post test BIRADS classifications were calculated respectively: pre-test (86%, 85%, 55%, 96%, 85%) and post-test (96%, 90%, 68%, 99%, 91%). Ultimately, considering the determination of contour features and visibility of pathologies; in 62 lesions out of 161 (38.5%), with using the PDVFT images, clearer demarcation is achieved when compared with gray scale and color Doppler images alone.
It was found out that some of the fremitus patterns are helpful in terms of defining the tissue compositions for benign lesions. For example, insipissated secretions of 6 cases, are not clearly visualized in gray scale US; the layering and impacted debris formation were shown on PDVFT images by different color aliasing from the other ductal content. Also free filling defects within the ducts (n = 3) could be differentiated from papillomas by accompanying pedinculary fremitus patterns through the stalk. For two complicated cysts, while internal septations were not visualized on GUS and cDUS, there were lineary color aliasing through the mentioned septae during PDVFT. As an interesting finding, septal fremitus pattern which passing through the lesion boundaries in hypoechogenic fat lobule (n = 4) could be enable to differentiate it from the fibroadenomas which shows the same septal pattern but differently limited to the lesion boundaries. With these special signs, it could be possible to downgrade some lesion and also it is possible to presume the histopathology of some lesion’s content. In 16 benign lesions (fibroadenoma, n = 5; intramammarian lymph node, n = 4; fibroadenolipoma, n = 2; focal area fibrocystic hyperplasia, n = 3; complicated cysts, n = 2) fremitus has originated through a stalk and mentioned lesions have showed eccentrical aliasing.
The patterns with these types were (inspissated secretion, septa, debris, papilloma, fibrotic tissue-ligamentous structure and vascular pedicle) shown on Figures 2-6, respectively.
4. Discussion
The primary imaging modalities used for the evaluation
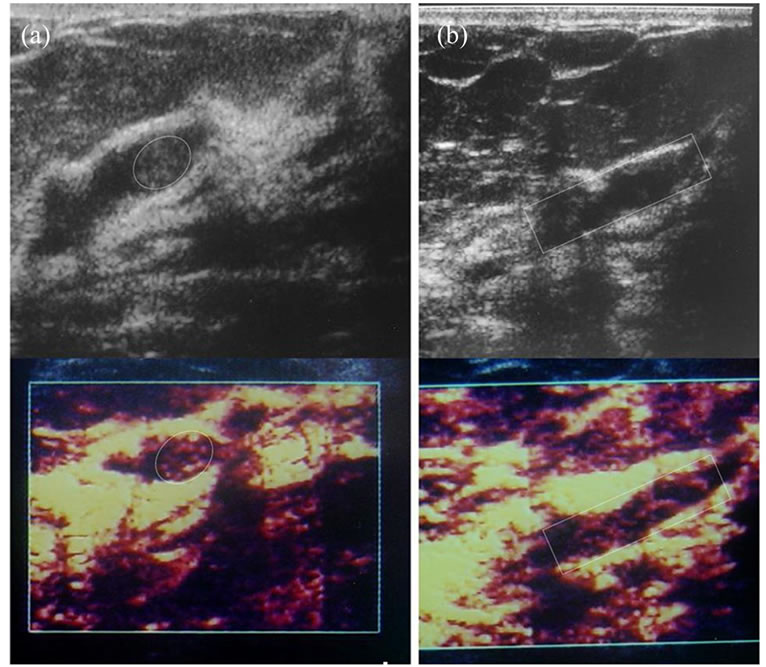
Figure 2. Papilloma and insipissated matterial can be differentiated with PDVFT. (a) a papilloma with complete, demarcated, more homogenous fremitus (encircled-oval area), (b) whereas an insipissated secretion shows septated nonuniform pattern (encircled-rectangular area).

Figure 3. Gray scale (a) and PDVF image (b) shows a fibroadenoma (encircled oval area with line) located adjacent to a fat lobule (encircled oval area with dashed-line). Gray scale image can not differentiate these two entities. At PDVFT examination, contrary to the short septal fremitus confined to the lesion boundaries (fibroadenoma), the fat lobule established continuous septal aliasing with uninterrupted long planes. Indirectly, PDVFT can show ultrastructural anatomy.
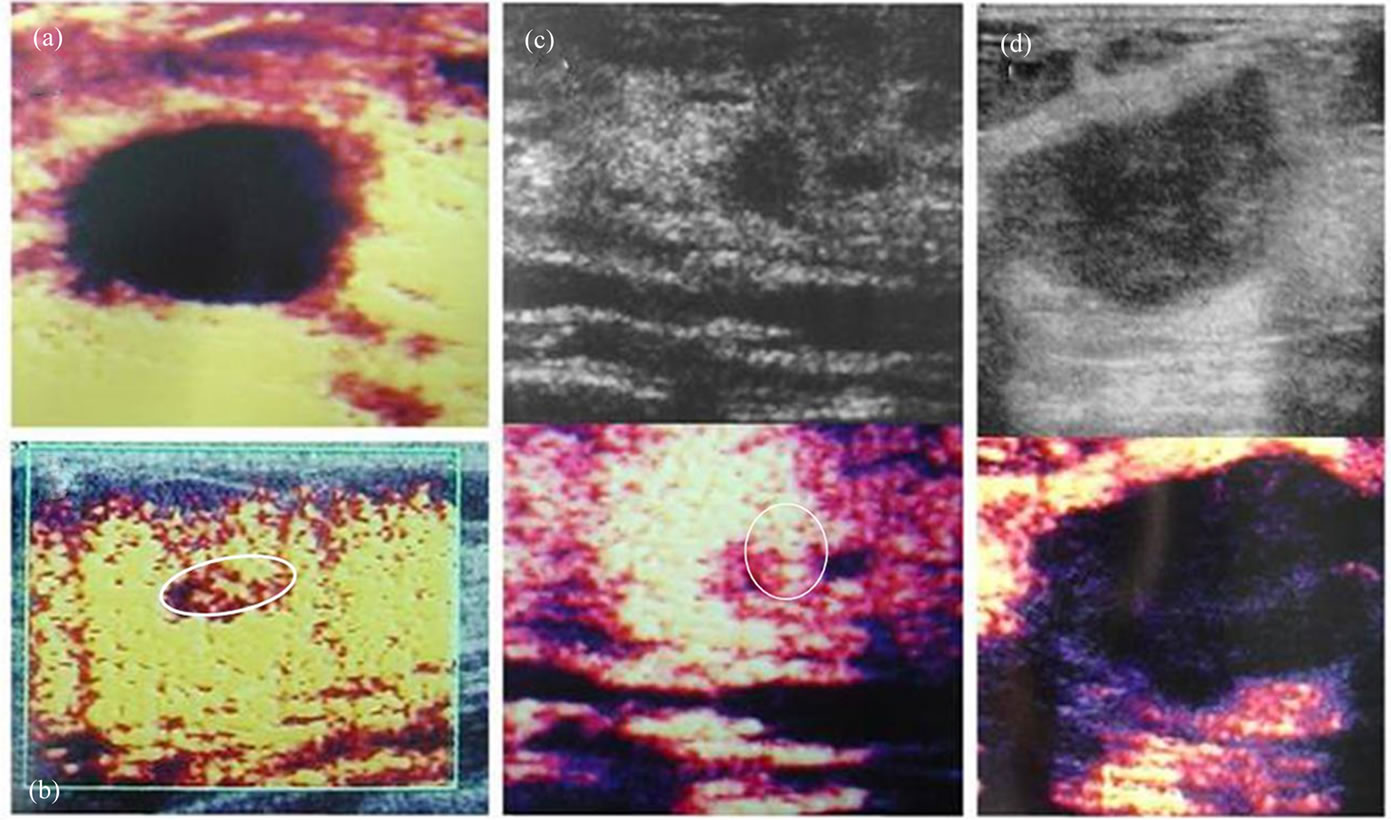
Figure 4. It is possible to predict the mobility of internal content of a cystic or cyst-like lesions (collection, complicated cysts, impacted secretions, debris or papillomas in ectatic ducts) by PDVFT examination. a) A simple cyst not attending to fremitus to fremitus is shown on PDVF image. b) An impacted (mucoid) dependant secretion which has noticeable boundaries (encircled oval area) through the aliasing artifacts in PDVF image. c) Despite to the non-discernible lesion on gray scale image (arrow in upper image in c), with PDVFT has shown the intracystic (intraductal) tumor (papilloma) by demarcated (encircled) an homogenous fremitus pattern. d) Suspected internal echoes of a heterogenous hypoechoic lesion on gray scale image. Bu it resembles an unicompartimental cyst at PDVFT images like a simple cyst (as in a) which allows to evaluate it as a benign lesion (hemorrhagic cyst).
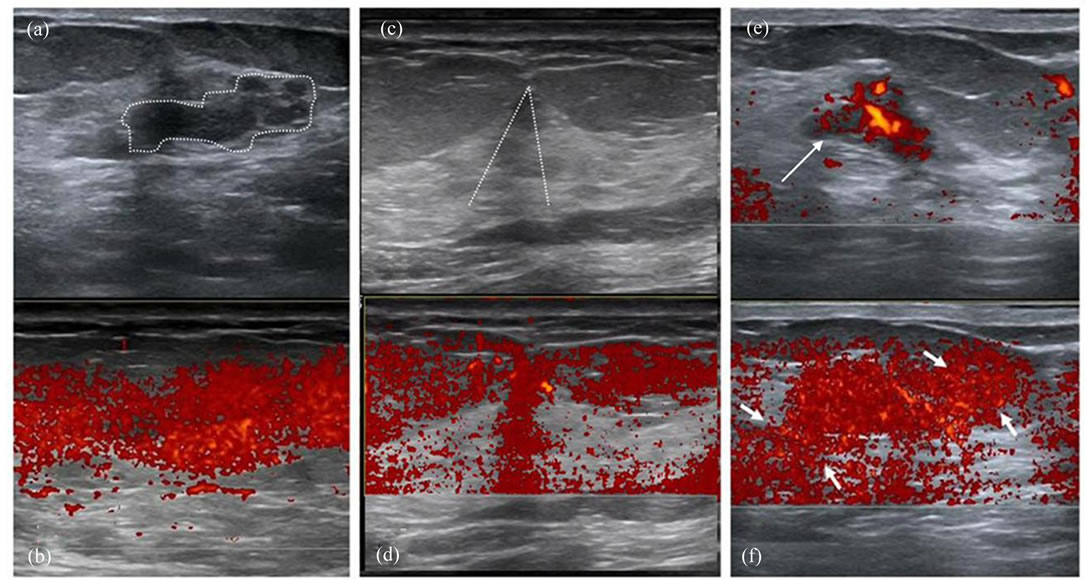
Figure 5. Interesting findings of lesions which showed diffusely internal color aliasing (also benign). Gray scale (a) and PDVF images (b) show; a focal fibrocystic hyperplastic (adenosis) area (dashed lines in a). In a different case, gray scale (c) and PDVF images (d) show the total fremitus aliasing through the shadowing due to cooper ligaments (area under the two crossing dashed lines). On power Doppler image (e) of a highly vascularized fibroadenoma (arrow) showed “t” pattern (f) during PDVFT test (between arows in f).
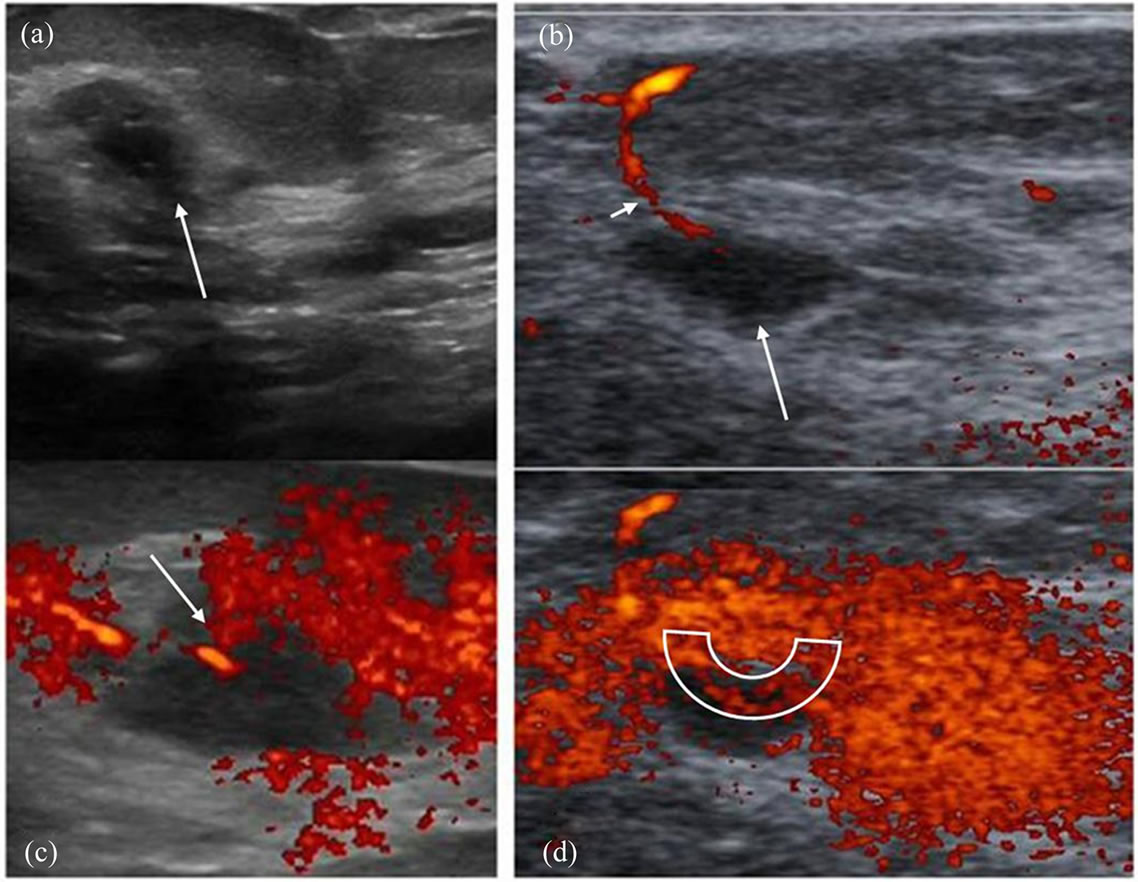
Figure 6. Fremitus which begins at the point of the vascular pedicle may propagates through the lesion boundaries via that stalk. (a) Gray scale US image of an intramammarian lymph node (arrow) shows hypoechogenic oval shaped lesion with no obvious hilary structure. (b) On Doppler US image, vascular pedicle (short arow) is seen towards the assumed hilum of the node (long arrow). (c) With the beginning of the PDVFT, aliasing near the vascular pedicle (arrow). (d) The color spreading progressed as “e” type pattern traversing the upper eccentric border of the examined lesion (encircled area).
of breast lesions are mammography and breast ultrasound [7]. US is used as an adjunct to mammography, since the specificity of mammography is low especially in dense breast patterns [7]. The main indication for breast US is differentiation of solid lesions from cystic ones [8]. Altough there are useful gray scale sonographic criteria for the differentiation of benign and malignant lesions, none of them is specific enough [7,8]. Indeed, it has been shown that 25% of ductal cancers exhibit sharp contour demarcation and 12% of them have posterior acoustic enhancement [7,8].
A number of studies have suggested that color Doppler US (cDUS) could be useful in the differentiation of benign and malignant lesions based on the vascularisation characteristics [9,10]. Also power Doppler US (pDUS), which is independent from directional data, has also been used in the demonstration of tumoral angigogenesis [12]. While cDUS uses frequency shift principle, pDUS encounters the total amplitude of the Doppler signal [11-14]. Since pDUS is independent from directional data, and it is more sensitive to slow flow, it has the capability to demonstrate tumoral vascularity better than cDUS [14,15]. On the other hand, it is noteworthy to indicate that as a disadvantage, pDUS is more sensitive to motion artefacts when compared with cDUS [12]. In our study, this motion sensitivity of pDUS is used for diagnostic purposes. Color aliasing patterns in and around the lesion (fremitus) which induced by patient phonation were recorded and investigated. By this test (PDVFT), which was described first by Sohn et al., it is well-known that the radiating vibrations could be monitorized in the form of color aliasing artefacts [16,17]. In another study, it has been specified that benign and malignant lesions could have been screened according to the contribution patterns to the fremitus radiating from thoracic wall during phonetic vibration [18]. Stavros has suggested that although lesion differentiation can not be done with this technique, however he also mentioned that lesions can be more clearly demarcated with PDVFT [18]. Our results were different from these studies, probably because used different parameters for lesion and tissue characterizations. Although it has been shown that demarcation is better demonstrated with pDUS, its role in the detection of malignancy is not clearly established for two main reasons. We believe that the first reason is that radiologists are not very familiar to this technique and there are a small number studies published in the literature [19,20]. The second is that it is timeconsuming and rather subjective [21,22]. In our study, although the body weight, respiration and phonation of different subjects were not exactly the same, we tried to standardize the method with quick PRF and gain settings for each case as previously stated in the metod section. In this study, we have not only revealed successful demarcation, we have also investigated the role of this test in the differentiation of malignant and benign lesions. So, we have classified the fremitus patterns into subgroups to characterize the internal nature of the lesion. As to our knowledge, it is the first study including further classification of the patterns to categorize different lesion groups for evaluation of PDVFT.
The variability of dimensions of the lesions before and after the fremitus test in some studies has been used as an indirect indicator of differentiating benign and malignant ones [3,7]. In those studies, the presence of peripheral type fremitus has been assumed as malignancy. Although relatively high accuracy of this theory, 21 patients with benign lesions had peripheral type of fremitus pattern, not as the sole pattern, but together with other patterns in our cases. For a benign lesion which contains fibrosis, scar formation and retraction can exist. On the other hand in a malignant lesion, nondestructed ligamentous structures may persist and show fremitus. And in both malignnant or benign groups, post-treatment changes may alter the fremitus patterns.
The lesions with homogenous color aliasing during phonation and lesions with no aliasing were detected to be benign in nature. Totally, 25 lesions displayed no fremitus throughout the examination (12 simple cysts, 3 adenosis foci, 3 fibroadenomas, 3 ductal ectasia-intissipated secretion, 2 fat lobules sorrounded by parenchyma). Probably the capsular reaction around the lesion or narrow transition zone which is made up of normal adjacent tissue reflects the fremitus and does not let it to penetrate inside the lesion which explains the absence of color aliasing. On the other hand, the lesions showing entirely homogenous fremitus patterns (2 adenosis-microcystic degeneration-hyperplasia, 4 fat lobules, 2 intramammarian lymph nodes, 1 shadowing in the Cooper ligament trace, 3 fibroadenomas) are thought to be in continuity with the adjacent breast tissue based on histopathological results. Although the principles of the fremitus stated in study of Sohn et al. are also supported here, the positive fremitus sign has not only been attributed to malignant ones [17]. Instead, adequate connective tissue in a benign lesion can show the fremitus participation because of permitting the transmission of the aliasing that comes from the thoracic wall. And conversely, though having similar histology in malignant lesions, fremitus patterns may change according to whether perilesional fibrotic ligaments are destructed or not. This feature explains while some malignnant tumors cause less color dispersion which is settled in loose connective area that is not able to transmit vibration pulses. Contrary to the previous theories, some benign tumors may show powerful fremitus response which are seated into the vibratory connective network area. If the technique is used consistently; the lesions which have the same gray scale characteristics (hyperplastic, fibrocystic changes, adenosis etc), can be differentiated from each-other by special distinguishing fremitus patterns and so from the malignant degenerations according to our results.
Actually, it is not difficult to predict the tissue composition of the lesions during pDUS examination. Moreover, knowing that fibrotic changes are more fixed in architectture than the normal parenchyma; the mobile character of the lesions cystic or cystic-like lesions (liquid, complicated cysts, impacted secretions, debris, and papillomas in ectatic ducts) can be predicted. In our patients, the test has successfully determined the nature of these lesions: in patients with complicated cysts, contrary to the avascularity at color scale images, the inspissated and murally impacted solid components showed color aliasing during fremitus. By using these subjective PDVFT features, it was possible to see the internal septa or minimal debrises by increasing the gain setting afterwards. Also test could be helpful in recognizing demarcated fat lobules (pseudolesion) and differentiation from fibroadenomas. It is useful for defining the insipissated ductal secretions and differentiation from papillomas.
In some lesions, the tissue band which attaches the lesion to the background (stalk of a papilloma) or vasculary entry site are all called as peduncules. In this kind of connection, differently from the destructive malignant lesions, in benign masses, because the persistence of nomal pedinculary tissue connection, fremitus can originate through that stalk and produce an eccentical continous color aliasing. Based on this sign, we can show the patency and integrity of the vascular entry site which is protected and not destructed by malignant invasion-infiltration.
Furthermore, when BIRADS categorization has been formed again by adding PDVFT findings, the classification in 22 of patients (14%) has been changed to a more appropriate line and correlated better with histopathological diagnosis and the area remained under ROC curve has increased. With this new scheme, benign fremitus patterns and effective contour determination properties of the PDVFT were used to enhance the lesion benignity.
The largest limitation during the study, histopathological verification of the lesions had not been carried out for 26 lesions because of the patients’ refusal and for 99 lesions because of only follow-up decisions after clinical-surgical consultations. Thick needle biopsy in 18 patients who do not give informed consent has been done by FNAB, and adequate specimen obtained for diagnosis. For the other relatively large group, a total of 125 cases whose cytohistopathology results could not be needed by clinicaly, three-year follow-up data considered. If there were no sign of progression, it was accepted as benign. It has not been possible to biopsy all of the lesions during study. Because it may not be possible to achieve to biopsy of all the lesion’s of womens’ who have benign breast lesions and who dwelling in such a cosmopolite city (Istanbul) and in a very lively and active working population.
In summary, in this prospective study, the participation of PDVFT has not been performed either as positive or negative, but was classified distinctly into 8 categories, which has been performed for the first time in the literature. Although infrequently seen as the dominant pattern, “z”, “e”, “s” and “t” patterns have been found to have high accuracy for benignity. Although fremitus sensitiveity and specificity is relatively low for “p, c, d, h” patterns; it is still beneficial to use for determining possible malignity. Interestingly, structural anatomy of the lesion (loose tissue bed, loose vascular pedincle) and/or its contents (layered secretions, inspissated debri, internal septae) can be predicted to an extent. Also, DVFT has been more successful (in 38.5% of lesions in the recent study) regarding demarcation. Additionally, with the new scheme produced by using PDVFT data, in 14 % of the lesions, the consistency of BIRADS categorization has increased. In spite of significant contribution to the diagnostic accuracy, the examination time with PDVFT is less than 5 minutes (mean: 3.5 min).
In conclusion, PDVFT is a useful method in the evaluation and also differentiation of benign and malignant breast lesions. This method can offer supplementary data and must be implemented in to routine daily radiologic practice.
REFERENCES
- R. F. Chang, S. F. Huang, W. K. Moon, Y. H. Lee and D. R. Chen, “Solid Breast Masses: Neural Network Analysis of Vascular Features at Three-Dimensional Power Doppler US for Benign or Malignant Classification,” Radiology, Vol. 243, April 2007, pp. 56-62. doi:10.1148/radiol.2431060041
- Y. L. Huang, S. J. Kuo, C. C. Hsu, H. S. Tseng, Y. H. Hsiao and D. R. Chen, “Computer-Aided Diagnosis for Breast Tumors by Using Vascularization of 3-D Power Doppler Ultrasound,” Ultrasound in Medicine and Biology, Vol. 35, No. 10, October 2009, pp. 1607-1614. doi:10.1016/j.ultrasmedbio.2009.05.014
- Y. H. Hsiao, Y. L. Huang, W. M. Liang, C. Lin, S. J. Kuo and D. R. Chen, “Characterization of Benign and Malignant Solid Breast Masses: Harmonic Versus Nonharmonic 3D Power Doppler Imaging,” Ultrasound in Medicine and Biology, Vol. 35, No. 3, March 2009, pp. 353-359. doi:10.1016/j.ultrasmedbio.2008.09.010
- C. Weismann and K. Hergan, “Current Status of 3D/4D Volume Ultrasound of the Breast,” Ultrasound in Medicine, Vol. 28, No. 3, 2007, pp. 273-282. doi:10.1055/s-2007-963225
- H. Reinikainen, T. Rissanen, M. Päivänsalo, E. Pääkkö, J. Jauhiainen and I. Suramo, “B-Mode, Power Doppler and Contrast-Enhanced Power Doppler Ultrasonography in the Diagnosis of Breast Tumors,” Acta Radiologica, Vol. 42, No. 1, 2001, pp. 106-113. doi:10.1080/028418501127346341
- K. R. Cho, B. K. Seo, Y. J. Lee, E. D. Pisano, B. K. Je, J. Y. Lee, E. J. Choi, K. B. Chung and O. Y. Whan, “A Comparative Study of 2D and 3D Ultrasonography for Evaluation of Solid Breast Masses,” European Journal of Radiology, Vol. 54, No. 3, June 2005, pp. 365-370. doi:10.1016/j.ejrad.2004.07.006
- A. T. Stavros, D. Thickman, C. L. Rapp, et al. “Solid Breast Nodules: Use of Sonography to Distinguish between Benign and Malignant Lesions,” Radiology, Vol. 196, 1995, pp. 123-134.
- W. E. Svensson, “The Use of Color Doppler Vascular Morphology in Improving the Ultrasound Diagnosis of Breast Lesions,” Acta Clinica Croatica, Vol. 41, No. 2, 2002, pp. 99-100.
- P. Milz, A. Lienemann, M. Kessler and M. Reiser, “Evaluation of Breast Lesions by Power Doppler Sonography,” European Radiology, Vol. 11, No. 4, 2001, pp. 547-554. doi:10.1007/s003300000733
- R. L. Birdwell, D. M. Ikeda, S. S. Jeffrey and R. B. Jeffrey, “Preliminary Experience with Power Doppler Imaging of Solid Breast Masses,” American Journal of Roentgenolgy, Vol. 169, 1997, pp. 703-707.
- G. M. Giuseppetti, S. Baldassarre and E. Marconi, “Color Doppler Sonography,” European Journal of Radiology, Vol. 27, No. 2 (Supplement), May 1998, pp. 254-258. doi:10.1016/S0720-048X(98)00076-X
- S. W. Lee, H. Y. Choi, S. Y. Baek and S. M. Lim, “Role of Color and Power Doppler Imaging in Differantiating between Malignant and Benign Solid Breast Diseases,” Journal of Clinical Ultrasound, Vol. 30, No. 8, 2002, pp. 459-464. doi:10.1002/jcu.10100
- L. Alamo and U. Fischer, “Contrast-Enhanced Color Doppler Ultrasound Characteristics in Hypervascular Breast Tumors: Comparison with MRI,” European Radiology, Vol. 11, No. 6, 2001, pp. 970-977. doi:10.1007/s003300000691
- S. Huber, M. Vesely, I. Zuna, S. Delorme and H. Czembirek, “Fibroadenomas: Computer-Assisted Quantitative Evaluation of Contrast-Enhanced Power Doppler Features and Correlation with Histopathology,” Ultrasound in Medicine and Biology, Vol. 27, No. 1, January 2001, pp. 3-11. doi:10.1016/S0301-5629(00)00282-9
- S. H. Kook, H. W. Park and Y. R Lee, “Evaluation of Solid Breast Lesions with Power Doppler Sonography,” Journal of Clinical Ultrasound, Vol. 27, No. 5, 1999, pp. 231-237. doi:10.1002/(SICI)1097-0096(199906)27:5<231::AID-JCU2>3.0.CO;2-P
- C. Sohn, A. Baudendistel and G. Bastert, “Diagnosis of the Breast Tumor Entity with ‘Vocal Fremitus’ in Ultrasound Diagnosis,” Bildgebung, Vol. 61, No. 4, 1994, pp. 291-294.
- C. Sohn and A. Baudendistel, “Differential Diagnosis of Mammary Tumors with Vocal Fremitus in Sonography: Preliminary Report,” Ultrasound in Obstetrics & Gynecology, Vol. 6, No. 3, 1995, pp. 205-207. doi:10.1046/j.1469-0705.1995.06030205.x
- A. T. Stavros, “Doppler Evaluation of the Breast,” In: A. T. Stavros, Ed. Breast Ultrasound, 1st Edition, Lippincott, Williams & Wilkins, Philadelphia, 2003, pp. 920-946.
- S. P. Weinstein, E. F. Conant and C. Sehgal, “Technical Advances in Breast Ultrasound Imaging,” Seminars in Ultrasound, CT and MRI, Vol. 27, No. 4, August 2006, pp. 273-283. doi:10.1053/j.sult.2006.05.002
- I. Y. Whang, “Power Doppler Needle-Induced Fremitus for Breast Localization,” Archives of Gynecology and Obstetrics, Vol. 278, No. 4, 2008, pp. 337-340. doi:10.1007/s00404-008-0583-x
- S. P. Weinstein, C. Seghal, E. F. Conant and J. A. Patton, “Microcalcifications in Breast Tissue Phantoms Visualized with Acoustic Resonance Coupled with Power Doppler US: Initial Observations,” Radiology, Vol. 224, No. 1, 2002, pp. 265-269. doi:10.1148/radiol.2241010511
- M. J. Kim, E. K. Kim, H. J. Youk, J. Y. Lee, B. M. Kim and K. K. Oh, “Application of Power Doppler Vocal Fremitus Sonography in Breast Lesions,” Journal of Ultrasound in Medicine, Vol. 25, No. 7, 2006, pp. 897-906.