American Journal of Plant Sciences
Vol.5 No.18(2014), Article ID:49279,12 pages
DOI:10.4236/ajps.2014.518296
Tissue Specific Expression of a Terpene Synthase in Nicotiana benthamiana Leaves
Seifu Juneidi1*, Hieng Ming Ting2, Alexsander van der Krol2
1Adama Science and Technology University, Adama, Ethiopia
2Laboratory of Plant Physiology, Wageningen University, The Netherlands
Email: *seifujjj@yahoo.com
Copyright © 2014 by authors and Scientific Research Publishing Inc.
This work is licensed under the Creative Commons Attribution International License (CC BY).
http://creativecommons.org/licenses/by/4.0/


Received 12 June 2014; revised 22 July 2014; accepted 15 August 2014
ABSTRACT
To study transient tissue specific linalool emission and to examine its fate, plastid targeted dual linalool/nerolidol synthase (FaNES1) was introduced into Nicotiana benthamiana leaves under LTP1, SUC2, RbcS and CaMV35 promoters. Tissue specificity of the promoters was tested with β-glucuronidase (GUS) reporter gene. Promoter::GUS/FaNES1 fusion was confirmed with colony PCR and agro-infiltrated into six weeks old N. benthamiana leaves. Eight days post inoculation (dpi), promoter::GUS constructs were examined with GUS histochemical staining at 1.5 h, 3.5 h, 5.5 h and 16 h incubation times. After 4/8 days, FaNES1 construct agro-inoculated leaves were assessed for linalool emissions and its conjugates using a dynamic headspace system and LC-MS, respectively. There was high affinity of promoters to their respective cell-types although it was not as specific as in stable transformation. This is possibly due to activations of many copies of transiently introduced promotes by few transcription factors of the respective promoter that naturally exist in untargeted cell-types. GUS staining intensity was stronger in leaf veins and injured sites compared to other plant tissues under all heterologous promoters, and it was gradually increased with increase in incubation times that could be explained by promoters wounding responses and/ or GUS leakage to unstained sites. Linalool emission was obtained in the same pattern under all promoters; it was higher at day 4 than day 8. Its concentration declined 44, 12, 4.5 and 4 folds at 8 dpi under LTP1, SUC2, RbcS and CaMV35S promoters, respectively. Conversely, linalool conjugates were significantly increased at day 8. These might be due to T-DNA degradations and/or protein modifications 4 dpi. LTP1 promoter was the least efficient to drive both GUS and FaNES1 possibly due to immature plastids in epidermal cells and/or its weak performance. Hence, to study FaNES1 activity in transient assay it is suggested to use relatively shorter duration and longer inoculation times for linalool and its conjugates, respectively.
Keywords:Cell Type Specific Expression, GUS, Linalool Synthase (FaNES1), Promoter

1. Introduction
Plants produce a wide range of volatile metabolites that mediate their interaction with their environment. The largest and most diverse family of these volatiles consists of terpenoids/isoprenoids. Their molecular structures range from linear (isoprenoid) to polycyclic molecules (e.g. rubber), and they are the frequent components of oils and resins [1] [2] .
The simple C5-units of isopentenyl diphosphate (IPP) and its allylic isomer, dimethylallyl diphosphate (DMAPP), are the primary substrates in terpene biosynthesis. The most common terpenes are produced by sequential head to tail addition of IPP to DMAPP, whereas the less common ones are formed by non-head to tail addition of the two building units, or by rearranging the structures of common terpenes. The sequential head to tail addition of DMAPP to IPP primarily produces geranyl diphosphate (GPP), farnesyl diphosphate (FPP) and geranylgeranyl diphosphate (GGPP). GPP synthase, FPP synthase and GGPP synthase produce linear prenyl GPP, FPP and GGPP precursors of terpenes from DMAPP and IPP, respectively. Terpene synthases catalyze formation of hemiterpenes, monoterpenes, sesquiterpenes or diterpenes from DMAPP, GPP, FPP or GGPP in the same order and prenyltransferases use IPP/DMAPP in further extension steps [1] -[3] .
Cytosol and plastid are the cellular sites for biosynthesis of terpenoids. DMAPPs are synthesized through 2-methylerythritol 4-phosphate pathway (MEP) via deoxy-D-xylulose 5-phosphate in plastids, and IPPs are synthesized in the cytosol via the mevalonate pathway [1] .
Monoterpene synthases are the attractive targets for monoterpene modifications and they are also the essential genetic materials to produce monoterpenes in plants that naturally do not produce monoterpenes. Over-expressing monoterpene synthase increases the yield and changes the monoterpene profile of the targeted plant [2] . The genetic modification of Petunia hybrida W115 with the (S)-linalool synthase from Clarkia breweri [4] and Arabidopsis with FaNES1 from strawberry [5] that expressed a functional enzyme strengthen this fact. Over-expressing genes encoding for a linalool synthase under constitutive promoter in petunia, tomato, carnation, potato and Arabidopsis are also the achievements in biosynthetic pathway engineering of monoterpenes. These plants were manipulated to produce linalool and its glycosylated and/or hydroxylated derivatives successfully [4] [6] [7] .
As IPP and DMAPP used for biosynthesis of monoterpenes and diterpenes, modification of IPP and/or DMAPP alter both monoterpene and diterpene compositions. Down regulation of GGPP synthase and/or over-expression of GPP synthase would be expected to increase production of monoterpenes. Hence, GPP synthase and GGPP synthase are good candidates in such metabolite modifications. On the other hand, as GGPP is a precursor for essential and primary plant metabolites such manipulation could cause damage to targeted plants [6] . To reduce such adverse effects on targeted plant health, genetic engineering of GPP production is recommended to be localized to tissues that are specialized for monoterpene biosynthesis which would need the use of tissue-specific promoters [2] . As far as our knowledge is concerned, in transient assay, tissue specific expression of a terpene synthase has not done before to produce monoterpenes in specific cell types. Thus, the aims of this study were to investigate different emission properties of FaNES1 from different cell types (epidermis, mesophyll and phloem) by exploring different flux through the pathways, different emission properties of the cells and different conversions to glycosides and to determine cell type specificity of the promoters and their efficiency in transient assay.
2. Materials and Methods
2.1. Genetic Materials
Four heterologous promoters were fused to FaNES1 gene or GUS reporter gene for sub-cellular localization study of linalool in transient assay. The promoters include three Arabidopsis thaliana tissue specific promoters (epidermis, LTP1; mesophyll, pAtRbcS and phloem, SUC2) and one constitutive CaMV35S promoter as a positive control (Figure 1). The expression cassettes were at different molecular levels when this study has started.
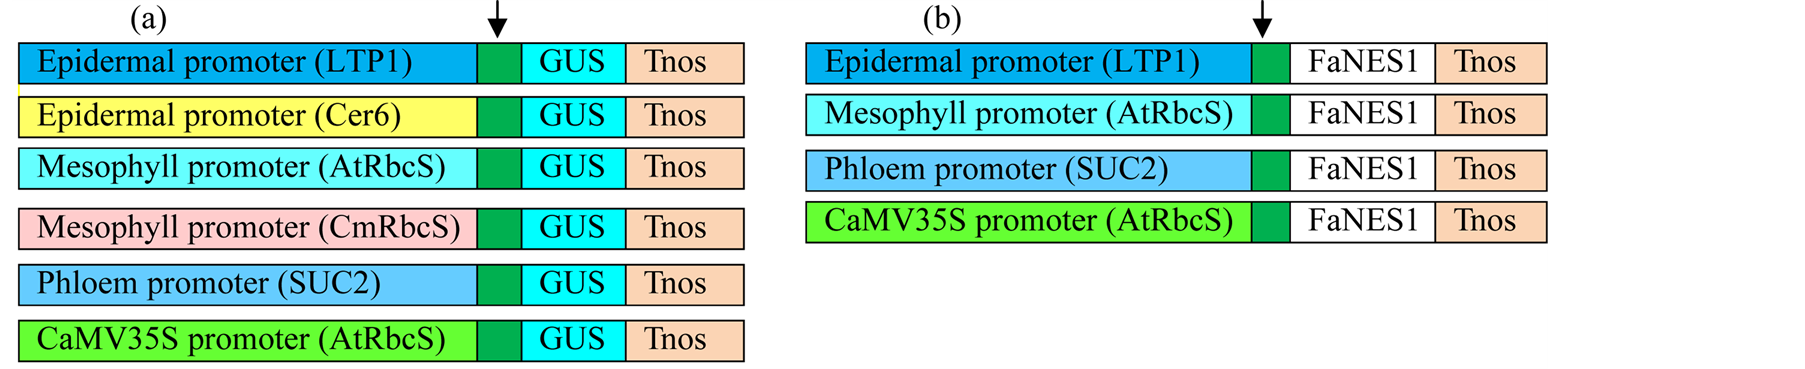
Figure 1. Schematic presentation of whole set of constructs. (a) GUS constructs; (b) FaNES1 constructs; Tnos, rubisco terminator; Arrow head, plastid targeting signal.
LTP1::FaNES1 and CaMV35S::FaNES1 expression cassettes were in Agrobacterium which were ready for agro-infiltration. LTP1::GUS, SUC2::GUS, and SUC2::FaNES1 in a binary vector in DH5α that were transformed to AGL0 [8] and CaMV35S::GUS set was in entry vector which was sub-cloned to a binary vector and then transformed to Agrobacterium. pAtRbcS::FaNES1 and pAtRbcS::GUS were cloned into entry vector and transformed to Agrobacterium as described below. Both GUS and FaNES1 constructs contain a plastid targeting signal, FvNES1 (Fragaria vesca Nerolidol Synthase1), (288 bp) that derived from a wild strawberry [5] and a rubisco terminator (20 bp). Chrysanthemum rubisco promoter (pCmRbcS) and CER6 promoters fused to GUS reporter gene were also included to test their specificity to mesophyll and epidermal cell types, respectively. And their activities were compared with their counterpart pAtRbcS and LTP1 promoters.
2.2. Cloning Arabidopsis thaliana Rubisco Promoter
For mesophyll tissue specific expression of a GUS reporter gene and a linalool synthase (FaNES1), Arabidopsis thaliana rubisco promoter (pAtRbcS) was cloned to pIVA1-2.4 (GUS reporter gene containing vector) and pIV1A-1.4 (FaNES1 harboring vectors). The Impact Vectors and the remaining constructs (LTP1::GUS, LTP1:: FaNES1, CER6::GUS, CER6::FaNES1, SUC2::GUS, SUC2::FaNES1, CaMV35S::GUS and CaMV35S::FaNES1) were generously provided by Dr. Maurice Henquet maurice.henquet@wur.nl. AtRbcS promoter was amplified from Arabidopsis thaliana genomic DNA (TAIR) http://www.arabidopsis.org/, and the PCR was performed with a Perkin-Elmer GeneAmp PCR system 9600 thermocycler in 50 µl reaction volumes containing 5 ng template DNA, 10 mM dNTP, 10 mM pAtRbcS forward primer (5’AAGGCGCGCCCTTTACCCTAACTACTCCTTTCTCAG, Tm:62.8˚C), 10 mM pAtRbcS reverse primer (3’GCCTAGGGTTGTTTCTCTTCTTCTTTTGGT, Tm:62.3˚C), 1 unit Phusion® Hot start II DNA polymerase and 5× phusion® HF buffer. PCR thermocycling conditions were performed based on guidelines in Phusion® Hot Start High-Fidality DNA Polymerase (New England BioLabs, UK). To facilitate cloning, AscI and AvrII restriction sites were incorporated to forward and reverse primers, respectively. Digestion of both vector and amplicon was performed with the same restriction enzymes (AscI and AvrII) for 2 h at 37˚C, and 40 μl digestion aliquots were applied to 1% agarose/ethidium bromide gel. The digested products were cut from the gel and purified by PCR clean up Gel extraction NucleoSpin® Extract II kit.
2.3. Cloning pAtRbcS into Impact Vector
The ligation reaction was made in 3:1 ratio molar excess of insert to vector: 54 ng pAtRbcS to 18 ng pIV1A-2.4 and 45 ng pAtRbcS to 15 ng pIV1A-1.4. DNA concentration for ligation reaction was calculated online by ligation calculator (http://www.insilico.uniduesseldorf.de/LigInput.html). Both pAtRbcS::GUS and AtRbcS::FaNES1 ligation products were then transformed to DH5α competent cells by a heat shock. The transformed bacteria were cultured on a selective LB medium (20 mg/ml gentamycin) and were grown overnight in a rotary shaker (250 rotation∙min−1 (rpm)) at 37˚C. Positive clones were screened by colony PCR and the recombination was confirmed by DNA sequencing. Finally, a single positive colony was grown overnight in a selective LB medium for recombinant plasmid DNA purification.
Double stranded 500 ng plasmid DNAs were used as a template for a sequencing PCR and it was performed by dideoxy chain termination method [9] . The sequencing reaction was resolved on Greenomics automated sequencer (Wageningen UR, The Netherland). The sequence comparisons were made by using electronic BLAST servers of National Centre for Biotechnology Information (NCBI).
2.4. Cloning pAtRbcS into Destination Vector (pBIN)
The entire expression cassettes of pAtRbcS::GUS and pAtRbcS::FaNES1 were thereafter cloned into pBIN binary vector by gateway technology (Invitrogen) and transformed to DH5α competent cells by a heat shock (NEB, UK). Briefly, DNA miniprep of each cloned promoter was chosen as an entry clone. Aliquots of 150 ng miniprep DNAs were incubated with 150 ng pBIN binary vector (linearized with kanamycin resistance-ccdB region) in 10 µl reactions containing 2 µl of LR clonaseTM II enzyme mix. The reactions were incubated overnight at room temperature. Then, proteinase K (2 µg in 1 µl) was added and kept at 37˚C for 10 min to stop reaction. Three micro litre of each reaction was transformed to DH5α competent cells and plated on 100 mg/ml kanamycin LB medium overnight at 37˚C. Miniprep DNAs of the resulting expression clones were prepared from each reaction, and 1 µl aliquots (about 80 ng DNA) were transformed to AGL0 competent cells [8] .
2.5. Agrobacterium Transformation
Agrobacterium transformation method was adopted from previous study as described by [10]. AGL0 [8] competent cells were prepared according to [11] and their growth was optimized by culturing on a YEP medium (Bacto-Trypton, 10 g/l; yeast extract, 10 g/l, NaCl, 5 g/l; pH 7). The recombinant binary vectors were introduced into Agrobacterium by electroporation as illustrated by [12]. Transformed cells were diluted in antibiotics free 1 ml YEP medium and incubated with shaking for 1 h. After recovery, 1 h in a YEP medium with 250 rpm, the cells were centrifuged at 3500 rpm for 5 min and half of the supernatant was discarded. The pellet was re-suspended in the remaining solution and 20 µl of the collected cells were grown at 28˚C for 2 days on a YEP selective medium (50 mg/ml rifampicin and 50 mg/ml kanamycin).
Transformation of binary vectors to A. tumefaciens and fusion of the promoters to FaNES1gene or GUS reporter gene were confirmed by colony PCR prior to agro-infiltrations. Primers for colony PCR were designed based on sequences of the promoters (forward primers) and FaNES1/GUS (reverse primers) with Primer3Plus software.
2.6. Agrobacterium Infiltration and Transient Expression System
Agrobacterium mediated transient expression was performed as previously described by [10] . Three hundred micro litre overnight grew culture of transformed A. tumefaciens was used for inoculation of 10 ml LB broth medium supplemented with 50 mg/ml kanamycin and 50 mg/ml rifampicin. The culture was grown overnight at 28˚C, and cells were precipitated at 3600 rpm for 20 min and re-suspended to 0.5 nm optical density within infiltration buffer containing 10 mM MgCl2, 10 mM MES and 100 mM acetosyringone.
Six weeks old wild-type N. benthamiana, grown under standard greenhouse conditions, was used for agroinfiltrations. The 5th and 6th top leaves of a plant, for each set of constructs, were screened and infiltrated as previously described by [12] [13] . The experiment was repeated three times in four biological replicates for 4 days and 8 days time periods.
The leaves were agro-infiltrated with a binary vector harbouring promoter::GUS/FaNES1 expression cassettes mixed with a binary vector cell suspension containing p19 (silencing suppressor) in a 1:1 ratio (v/v). The combined culture suspensions were incubated at room temperature for 3 h on a horizontal shaker with 50 rpm prior to agro-infiltration.
2.7. Histochemical GUS Assay and Microscopy
Agro-infiltrated leaf discs were manually produced by a cork borer and immediately immersed in fixation buffer containing 0.1 M NaHPO4 (pH, 7), 0.1% formaldehyde, 0.1% Triton X-100 and 0.1% β-mercaptoethanol in 24- well micro litre plate and vacuum infiltrated for 10 min. Fixing buffer was removed after 5 min incubation at room temperature and washed twice with 0.1 M NaHPO4 (pH, 7) washing buffer. Washing buffer was replaced by staining solution (0.1 M NaHPO4, pH 7; 10 mM EDTA, pH 7; 0.5 mM K+ ferricyanide; 0.5 mM K+ ferrocyanide; 1 mg/ml X-Gluc and 0.1% Triton X-100) and vacuum infiltrated for 10 min followed by 1.5 h, 3.5 h, 5.5 h and 16 h incubation times at 37˚C. Chlorophyll was removed by incubating the leaf discs in 50% and 75% ethanol (15 min in each) and by washing several times with 95% ethanol until all the chlorophylls was completely removed. Finally, the leaf discs were scanned for blue pixel intensity quantification by ImageJ software ((http://rsb.info.nih.gov/ij/), and the leaf disc cross sections were observed under bright field microscope to verify cell types/tissue specificity of the promoters in transient assay.

2.8. Headspace Analysis
Four/eight days post agro-infiltration, volatiles were sampled from N. benthamiana detached leaves by a dynamic headspace trapping system as previously described by [14] . Briefly, the 5th and 6th top agro-infiltrated leaves were harvested and immediately transferred to 10 ml glass vial filled with tape water. The vial was placed in a 1 L glass cuvatte in a climate chamber at 20˚C. The cuvette was closed with a Teflon-lined lid with a Tenax cartridge (140 mm × 4 mm; 150 mg Tenax [20/35 mesh; Alltech, Breda, The Netherlands]) to clean incoming air and a second Tenax cartridge (140 mm × 4 mm) on the outlet to trap the volatiles. Air was pumped by a vacuum pump through the glass cuvette at about 100 mL per min. The volatiles were collected for 1 h between 10:30 - 11:30 AM.
The volatiles trapped in the outlet cartridges were analysed by Thermodesorption GC-MS using a thermal desorber (Unity, Markes International Limited) and a Trace GC Ultra (Thermo Electron Corporation) coupled with a DSQ mass spectrometer (Thermo Electron Corporation) as previously illustrated by [14] .
2.9. LC-MS Analysis
Non-volatile compounds were analyzed using a protocol for untargeted metabolomics of plant tissues as previously described by [15] . Priestly, 4/8 dpi N. benthamiana leaves were harvested, frozen and ground in liquid nitrogen to fine powders. From each ground plant materials, 100 mg was subjected to 300 µl methanol: formic acid (1000:1, v/v) solvent extraction. The extracts were prepared by brief vortexing and sonication for 15 min, centrifuged and filtered through 0.2 µm inorganic membrane filters (RC4, Sartorius, Germany). LC-PDA-MS analysis was performed using a Waters Alliance 2795 HPLC connected to a Waters 2996 PDA detector and subsequently a QTOF Ultima V4.00.00 mass spectrometer (Waters, MS technologies, UK) operating in negative ionization mode. The employed analytical column (2.0 mm × 150 mm; Phenomenex, USA) was attached to C18 pre column (2.0 mm × 4 mm; Phenomenex, USA).
LC-MS data were obtained using MassLynx 4.0 (Waters) and were processed using MetAlign version 1.0 (www.metAlign.nl) for baseline correction, noise elimination and for subsequent spectral data alignment [15] . The obtained data were analyzed by Statistical Package for Social Science (SPSS) version 17 software to determine mean and percentage. Least significant differences (LSD) of mean separations at 5% confidence interval and correlation coefficients were analyzed by student’s t-test.
3. Results
3.1. Tissue Specificity of Promoters in Agrobacterium tumefaciens Transient Assay (ATTA)
Heterogonous promoter::GUS constructs agro-infiltrated leaves were harvested 8 dpi and assayed for GUS expression during 1.5 h, 3.5 h, 5.5 h and 16 h incubation times. There was similarity in GUS staining pattern showing a very intense coloration at wounded margins under CER6, pAtRbcS, pCmRbcS, CaMV35S and SUC2 promoters (Figure 2). Veins staining had a comparable intensity under all employed promoters and it was steadily increased with increase in incubation time. On the other hand, the entire leaf discs were less stained in comparison with their counterpart leaves stain (Figure 2 leaf discs stain and Figure 3(a) counterpart leaves stain). There were also slight differences in GUS staining intensity between similar tissue specific promoters, LTP1 and CER6. The GUS activity revealed that wounded site of leaf discs showed deeper staining under CaMV35S, pAtRbcS and pCmRbcS compared to LTP1, CER6 and SUC2. Under SUC2, the entire leaf disc staining intensity was relatively stronger than the other promoters. Hand sections of leaves’ midrib histochemical assays (Figure 3(b)) also showed differences in their staining patterns; there was higher stain intensity for SUC2 compared to the rest promoters at this region. pAtRbcS and pCmRbcS exhibit higher GUS activity compared to LTP1 and CER6 which did not cause any GUS expressions in leaf midribs. Moreover, LTP1 showed faint coloration in all incubation durations, and empty vector (pBIN) did not show any visible stains.
Intensity of blue colors was consistent in the time courses to quantitatively estimate GUS activity driven by
Figure 2. ATTA of 3.5 h X-gluc stained leaf discs and β-glucuronidase (GUS) activity in N. benthamiana leaf tissues. The transformants contain different promoters::GUS fusions: LTP1 and CER6, epidermal tissue specific promoters; AtRbcS and CmRbcS, mesophyll tissue specific promoters; SUC2, Phloem tissue specific promoter and CaMV35S constitutive promoter as a positive control. pBIN, empty vector as a negative control.
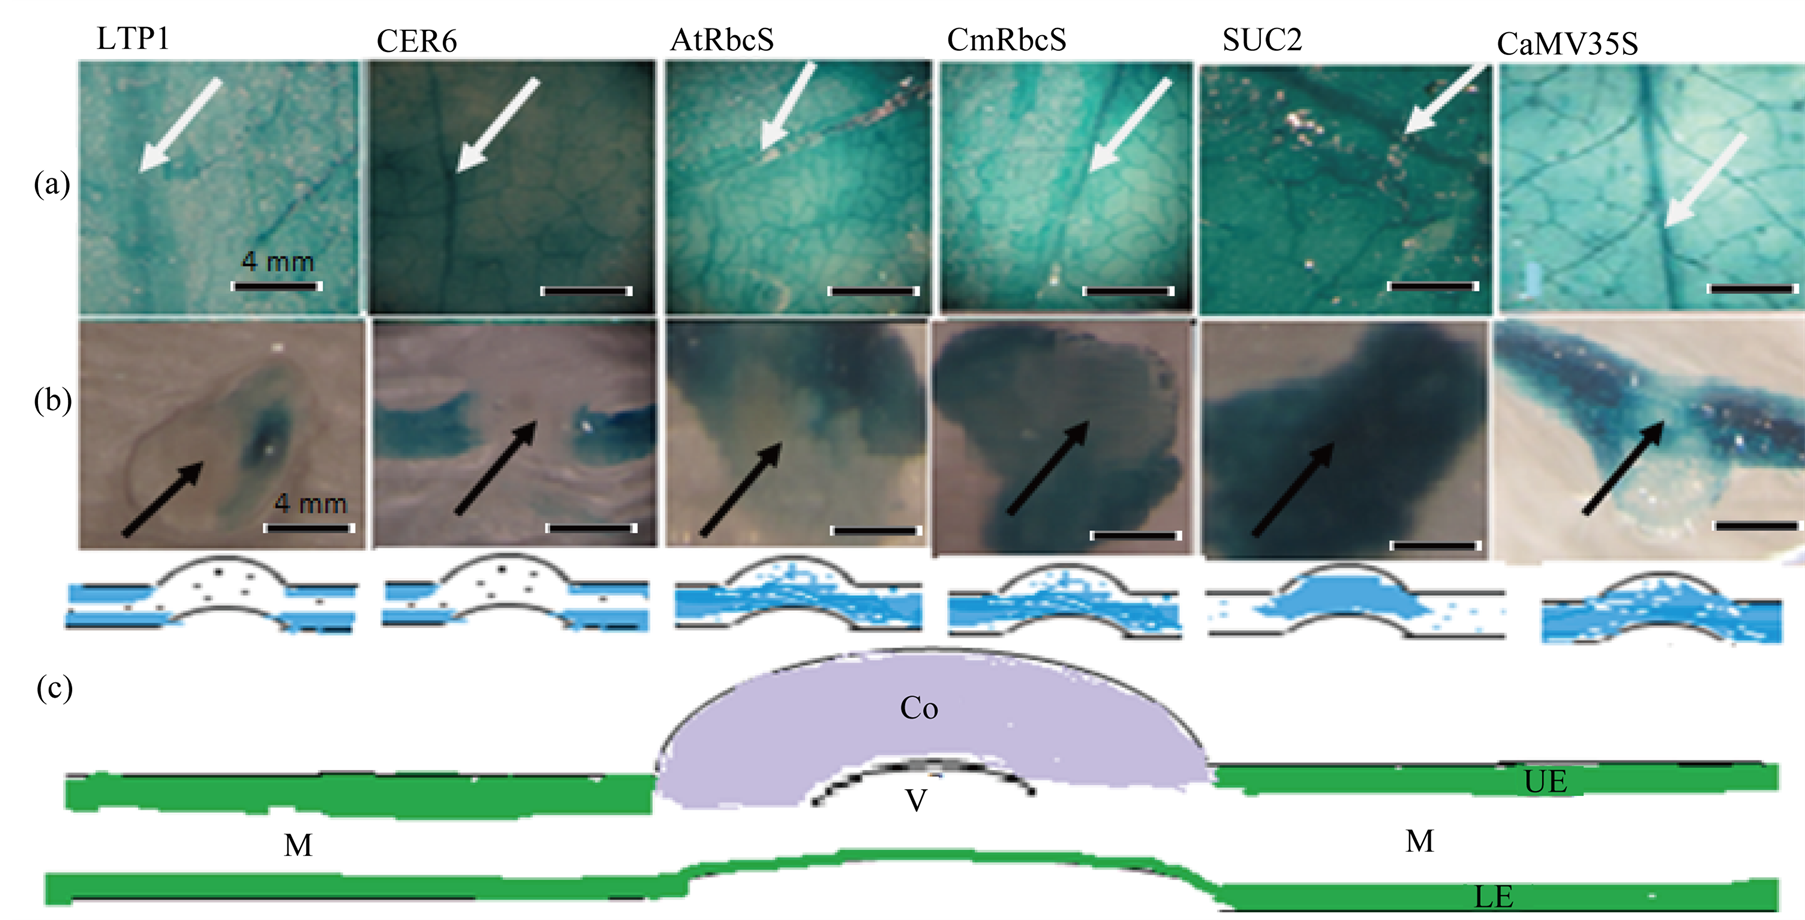
Figure 3. Transiently, plastid targeted GUS agro-infiltrated N. benthamiana leaves assay. GUS reporter gene was fused to LTP1, CER6, AtRbcS, CmRbcS, SUC2 and CaMV35S promoters. (a) bright field image of X-gluc stained leaves; (b) midrib cross-section of the same leaves, (a) (Black arrow head); (c) schematic representation of stained leaf layers; white arrow head, leaf midrib. Each leaf is representative of each promoter::GUS fusion expression assays. M, mesophyll; Co, Cortex; V, vascular bundles; UE, upper epidermis; LE, lower epidermis.
different promoters. pAtRbcS was the strongest to drive GUS gene followed by CaMV35S, pCmRbcS and SUC2 in the same order during 3.5 h, 5.5 h and 16 h incubation times. However, there was slight difference in pixel color intensity at 1.5 h in which GUS under pCmRbcS showed relatively higher color intensity than pAtRbcS and CaMV35S promoters. GUS gene expression directed by LTP1 promoter had a comparable intensity with GUS gene driven by CER6 promoter, and it showed the least blue color intensity compared to the rest used promoters (Figure 4(a)).
Saturation of GUS staining was assessed to determine the relative expression and protein stability under different promoters (Figure 4(b)). From 1.5 h to 3.5 h incubation times, GUS activity was steadily increased under all promoters. It attained saturation under LTP1 and SUC2 at 5.5 h incubation time. Thus, 3.5 h was the rational
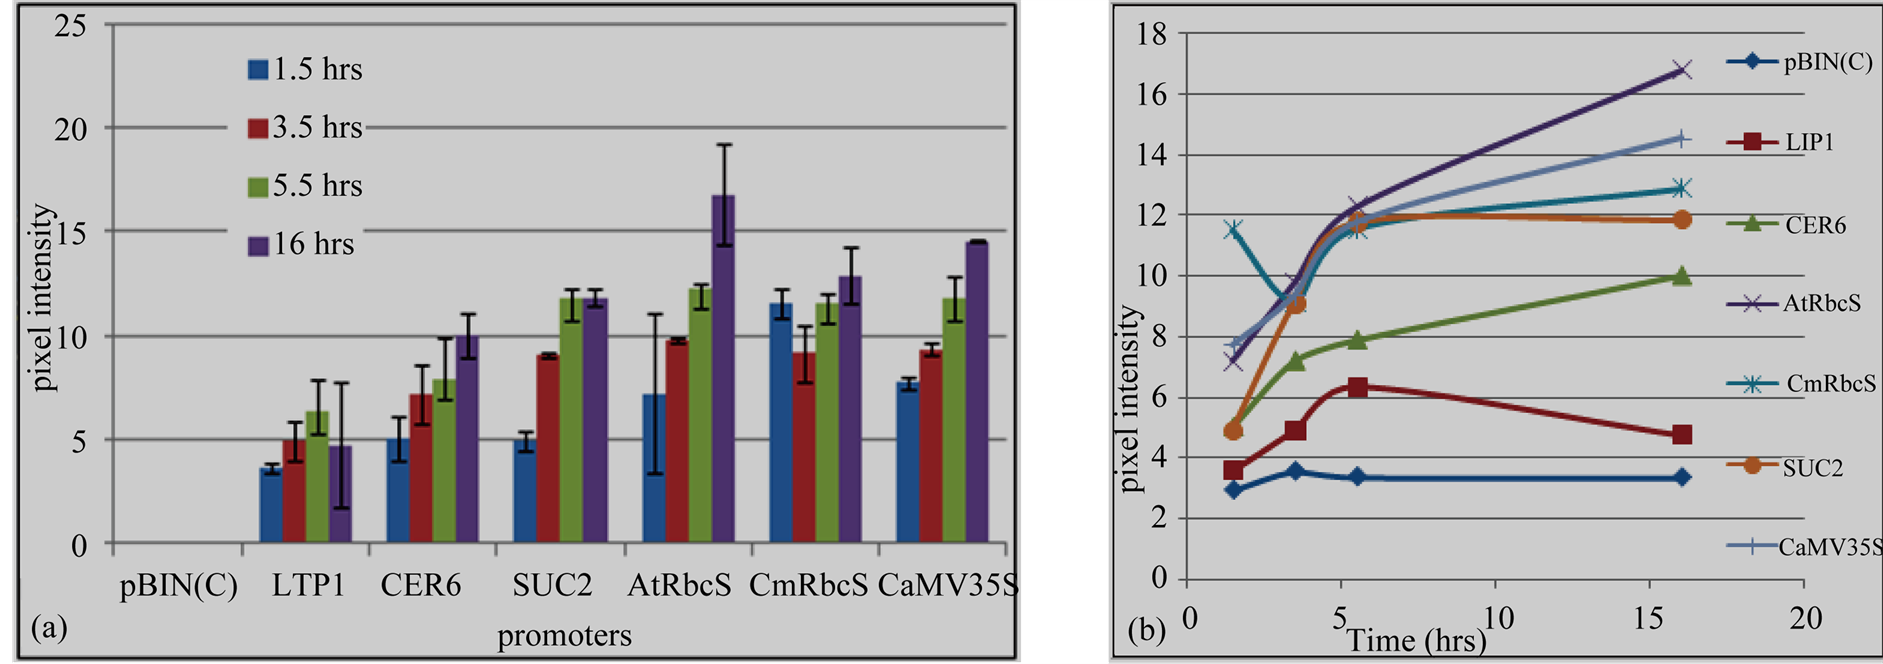
Figure 4. GUS gene expression directed by heterologous promoters. (a) Quantified blue colors of GUS protein; (b) GUS proteins accumulation overtime. pBIN, empty vector; LTP1 and CER6, epidermis tissue specific promoters; AtRbcS and CmRbcS, mesophyll tissue specific promoters; SUC2, Phloem tissue specific promoter and CaMV35S constitutive promoter.
incubation time to compare expression and stability of GUS protein under these promoters. GUS expression driven by pAtRbcS, pCmRbcS, CER6 and CaMV35S promoters were progressively increased with increase in incubation times that agrees with the quantified blue colors. Under these promoters, the result showed that GUS proteins were not totally covered by staining solution even at the longest incubation time, 16 h. But, GUS protein was saturated under LTP1 and SUC2 promoters at 5.5 h and gradually degraded under LTP1. No GUS staining was observed from empty vector (pBIN) during all the incubation times under all the employed promoters.
3.2. Linalool Emissions from FaNES1 Agro-Infiltrated N. benthamiana Leaves
Volatiles from N. benthamiana detached leaves were sampled by a dynamic headspace trapping system and analysed by GC-MS 4/8 dpi. The result of the headspace analysis showed that linalool was emitted with all the expression cassettes (LTP1::FaNES1, pAtRbcS::FaNES1, SUC2::FaNES1 and CaMV35S::FaNES1) with significant differences in linalool concentration and with inoculation time courses (4/8 dpi) (Figure 5(a)). CaMV35S:: FaNES1construct emitted the highest linalool level followed by pAtRbcS and SUC2 driven promoters, respectively. The lowest result was obtained from LTP1::FANES1 construct. Trace amount of linalool was also observed from empty vector which was comparable with LTP1::FaNES1 at 8 dpi emissions. On the other hand, linalool emission was followed the same production pattern under all the employed promoters during day 4 and day 8 inoculation time periods. i.e., linalool emission was higher at day 4 compared to day 8. And no linalool emission differences were observed at day 4 and day 8 from empty vector (pBIN).
3.3. LC-MS/MS Identification of the Most Distinct New Compound from FaNES1 Agro-Infiltrated Leaves
As monoterpene alcohols conjugate to other compounds and exist in non-volatile forms, linalool derived compounds from FaNES1 agro-inoculated N. benthamiana leaves were also analysed by LC-MS/MS to investigate the fate of linalool from ATTA. Metabolites profiling results showed that RbcS::FaNES1, SUC2::FaNES1, CaMV35S::FaNES1expression intensity was increased at 8 dpi compared to 4 dpi. No expressions were obtained from LTP1::FaNES1 and empty vector (pBIN) during both day 4 and day 8 inoculation time periods.
Out of 1226 m/z (mass to charge ratio) signals, two m/z (801.35 and 803.36) were observed with significant difference (p < 0.05) between FaNES1 (directed by RbcS, SUC2 and CaMV35S) and pBIN (empty vector) agroinfiltrated leaves. These significantly different masses were then analysed by LC-MS/MS fragmentations and m/z 803.36 was putatively identified as linalool conjugates: linayl-acetyl-β-D glucopyranoside, hydroxylinayl- β-D glucopyranoside and linayl-acetyl-β-D glucopyranoside-formate. The m/z signals of these linalool conjugates were not detected from LTP1::FaNES1 and empty vector (Table 1, Figure 6). Intensity differences of the novel compounds at 4 dpi and 8 dpi were quantified and the multivariate analysis result showed that the expression intensity was significantly increased (p < 0.05) at day 8 compared to day 4. Their relative mass abundance followed the same pattern during day 4 and day 8; it was higher at 8 dpi than 4 dpi (Figure 5(b)).
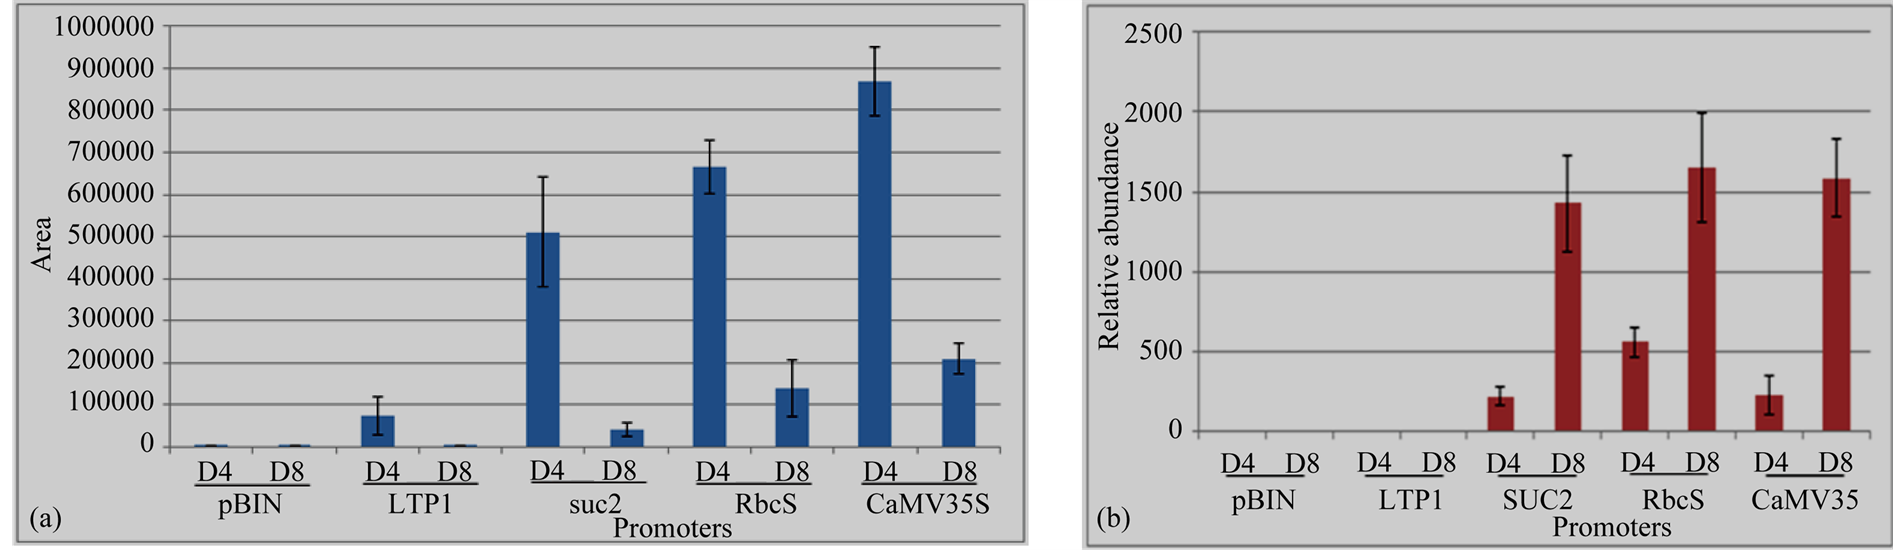
Figure 5. Transgenic N. benthamiana leaves expressing FaNES1 with a plastidic targeting signal (FvNES1) during 4/8 dpi. (a) Linalool; (b) m/z 401.11; m/z 803.36 is adduct of 401.11. Notice stronger m/z signals intensity at day 4 compared to day 8 for linalool and the reverse intensity for its conjugates. D4, day 4; D8, day 8; pBIN, Empty vector.

Table 1. Non-volatile metabolites that significantly increased and putatively identified as linalool conjugates by LC-MS/MS at 26.22 min retention time.
Note: Since no m/z signals were detected from LTP1::FaNES1 and pBIN at both 4 dpi and 8 dpi, these constructs were not included in this table for m/z intensity comparisons. Peak intensity is the mean of four agro-infiltrated leaves. The masses were detected in negative mode of LC-QTOF-MS; Ret(min), retation time in minute; ID, identification; ND, not detected.
4. Discussion and Conclusion
4.1. Tissue Specificity of Promoters in Transient Assay
The aims of this study were to transiently produce linalool in N. benthamiana leaves and to investigate the fate of linalool in different cell types. To attain these goals, tissue specific epidermal (LTP1), mesophyll (RbcS) and phloem (SUC2) promoters were fused to GUS reporter gene and their tissue specificity, in ATTA, were examined. GUS is one of the most stable reporter genes for expression studies [16] . These promoters were selected as their cell type specificity has already been confirmed and successfully used in sub-cellular localization studies in stable transformation [17] [18] .
GUS expression pattern was similar under the employed promoters with slightly different in staining intensities. It was darkly stained under pCmRbcS, pAtRbcS and CaMV35S promoters around injured sites of the leaf discs, and it was relatively less stained under LTP1, CER6 and SUC2 promoters at damaged areas. These could be due to wounding responses of mesophyll tissue specific and constitutive promoters. The wounding responses was consistent with [19] findings in which GUS was deposited at cut ends of fresh sample from leaves and stem tissues under these promoters. There was extremely higher GUS stain deposition under SUC2 promoter in leaf midrib cross-sections compared to other promoters. Preferentially, GUS accumulation under SUC2 was in veins indicating higher tendency of SUC2 promoter to phloem tissues. GUS protein was predominately accumulated in mesophyll cell under pCmRbcS and pAtRbcS. Under epidermal promoters, GUS expression was hardly detected both in phloem and mesophyll cell types (Figure 2). Overall, there was high affinity of promoters to their respective cell types though it was not as specific as in stable transformation. The most likely reason is the activa-
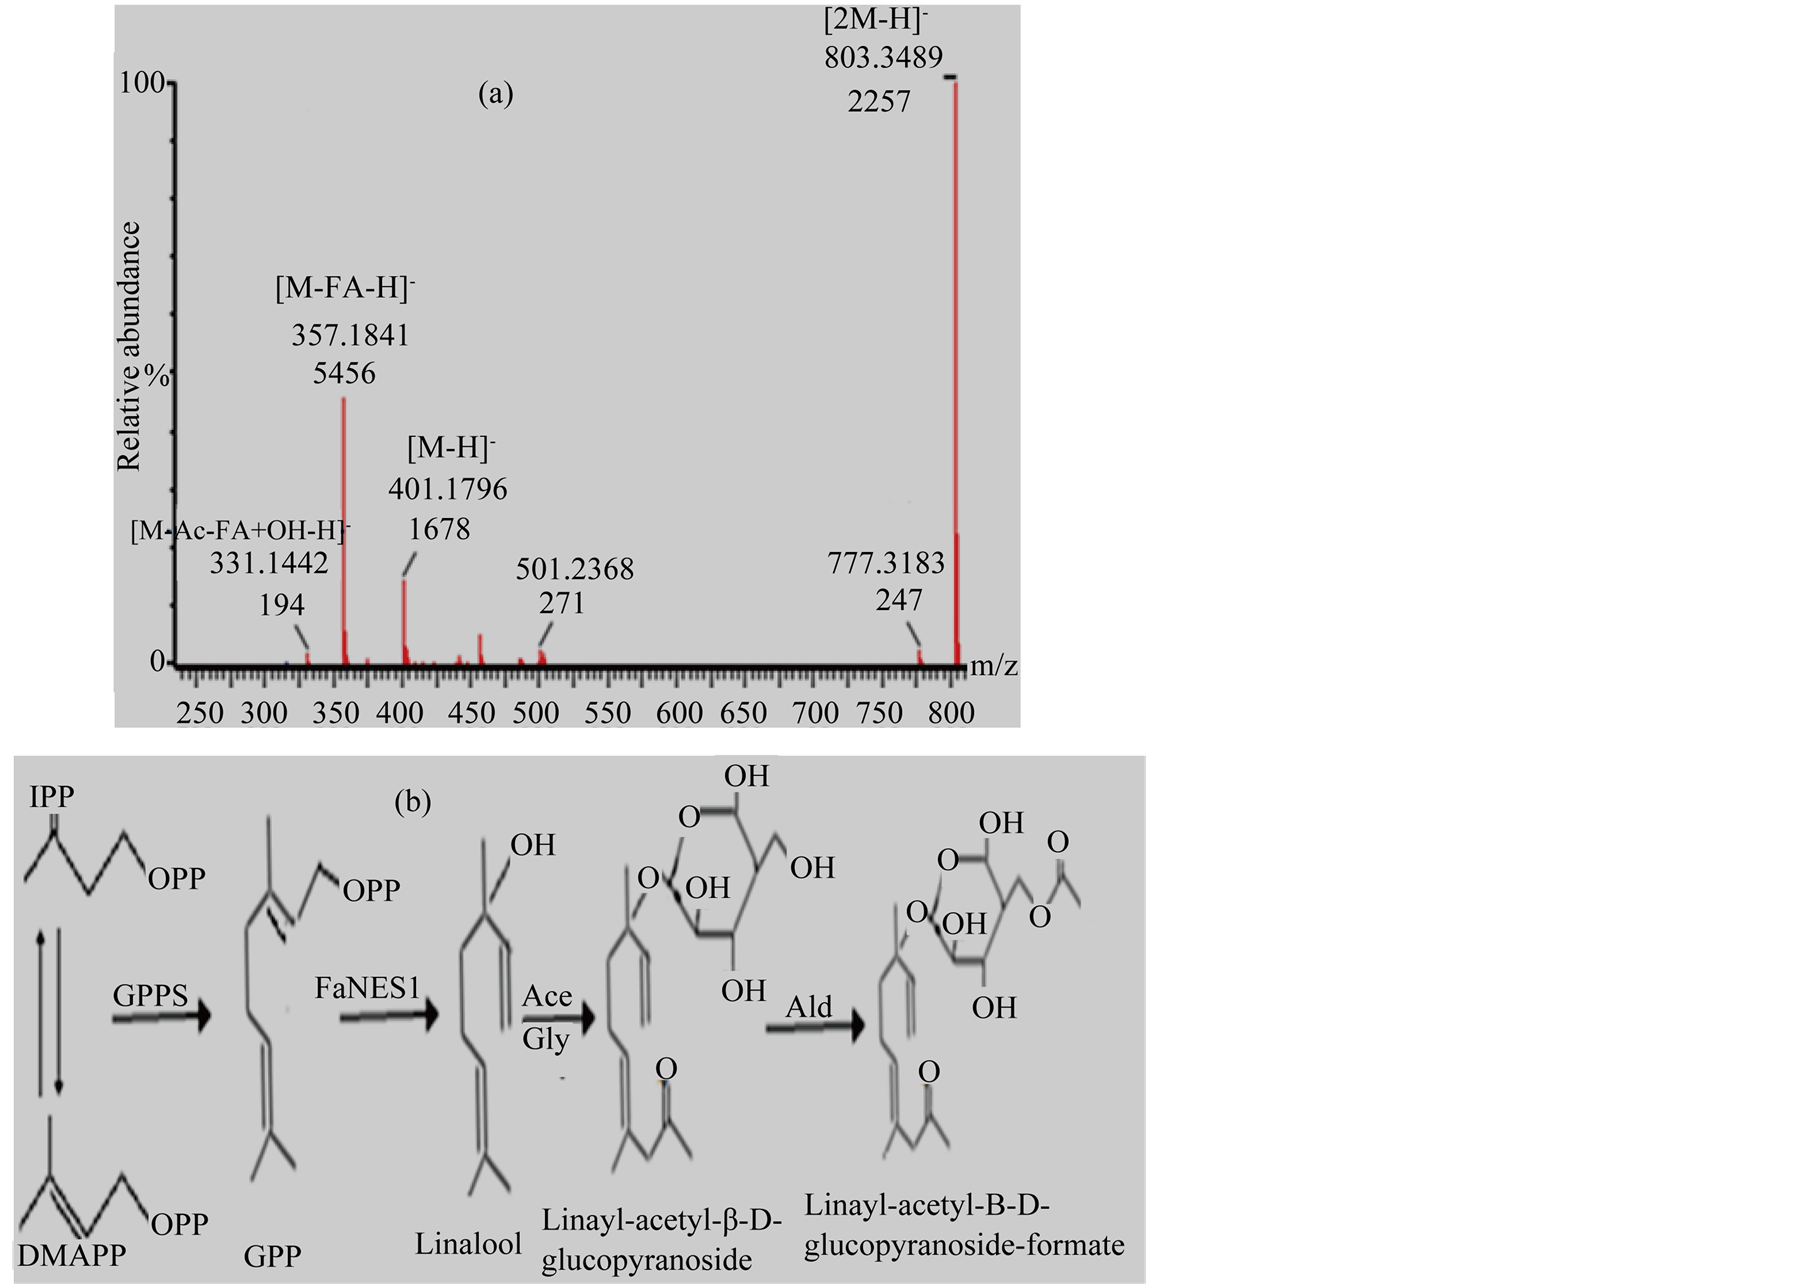
Figure 6. Negative mode LC-QTOF-MS/MS putatively identified linalool derivatives from FaNES1 agro-infiltrated N. benthamiana leaves (a). Schematic presentation of linalool and linalool conjugates biosynthetic pathways (b). Gly, glycosylation; Ace, Acetylation; Ac, Acetly; Ald, Aldyhade.
tions of many copies of the promoter, transiently introduced to leaves, by a few transcription factors of the corresponding promoter that naturally exist in untargeted cell types.
Under all employed promoters, relatively GUS staining intensity was stronger in veins than other plant tissues that gradually increased with increase in incubation times. This similarity might be partly explained by GUS leakage to unstained site. Strong GUS gene expression and prolonged incubation time causes outflow of GUS product and colorations to the neighboring cells/tissues [16] [20] -[22] . Reference [23] also reported ferrocyanide reagent in GUS staining solution causes more diffused GUS proteins in GUS histochemical staining assays.
Rubisco promoter is a strong tissue specific, light regulated and chlorophyll a/b binding protein promoter [24] and CaMV35S promoter is the constitutive plant virus origin that widely used in transgenic plant expression. With respect to efficiency, pAtRbcS promoter was found to be the strongest to direct GUS expression followed by CaMV35S and SUC2 in the same order. As the assay was made 8 dpi, increase in leaf ages could be a reason for less efficiency of CaMV35S promoter compare to pAtRbcS promoter. GUS expression under CaMV35S promoter is relatively lower in matured leaves than younger leaves in stable transformation [25] . On the other hand, GUS activity under CaMV35S promoter was slightly higher than CmRbcS promoter which contradicts with [26] report that CmRbcS promoter was 7 and 17 folds higher than CaMV35S promoter expressing GUS in tobacco and chrysanthemum, respectively. Reference [6] also reported that CmRbcS promoter was 10 times more efficient than CaMV35S promoter by over-expressing FaNES1 in transgenic potato. LTP1 promoter was the least efficient to drive GUS in this transient assay which agrees with [27] report that LTP1 promoter directed GUS required longer incubation time even to detect a signal in thin sections.
4.2. Linalool Emission under Different Promoters
FaNES1, from strawberry [5] , was transiently transformed to N. benthamiana leaves to express linalool under different promoters. The expression cassette contains plastid targeted signal [6] , and the time selected for a dynamic headspace trapping system was from 10:30-11:30 AM (morning) as the highest monoterpenes emissions have been reported during this time [5] [28] .
Over-expressed terpene synthase in Clarkia stored various linalool levels and linalool conjugates in different organs, and it was reported that linalool biosynthesis depends more on the availability of GPP substrate than linalool synthase [4] [29] . In this study, it was expected higher or at least the same linalool level emission at 8 dpi assay compared to 4 dpi since the GPP substrate supposedly the same for both time courses. However, our result showed extremely lower linalool emission at day 8 compared to day 4. Its emission decreased 44, 12, 4.5 and 4 folds at day 8 under LTP1, SUC2, RbcS and CaMV35S promoters, respectively (Figure 5(a)). The most likely reason is the degradation of T-DNA at 8 dpi. Low level and drop-off expression from T-DNA 5 dpi was stated as one of the limitations in transient expression assay [30] . T-DNA transiently introduced to a plant immediately transported to nucleus, transcribed and then inactivate by modification or degradation [31] . It might be also partly explained by protein instability and/or linalool conjugation to other compounds. Most plant species conjugate linalool to other compounds and transport from site of synthesis to other plant tissues to reduce auto toxicity [32] . Reference [4] also reported linalool plant tissue content is affected with the availability of the GPP substrate, storage in the tissue, emission, conjugation, degradation and transportation. The least linalool emission was obtained from LTP1::FaNES1 which could be due to immature plastids in the epidermal cell types. Leaf epidermal cells generally have smaller, immature and a few numbers of chloroplasts compared to mesophyll and phloem chloroplasts [33] .
Trace amount of linalool was also obtained from empty vector which was emitted by endogenous terpene synthase from host plant. Reference [28] reported low linalool level from wild type leaves in their study (S)- linalool synthase functional characterization from Kiwifruit. Over-expressed terpene synthase in tobacco [4] , potato [6] and Arabidopsis [7] produced low level linalool from their counterpart wild types by endogenous terpene synthase.
Regarding phenotype, there was no visible damage on the targeted host plant although other reports showed adverse effects on plant health by over-expressing terpene synthase in plants: Arabidopsis, growth retardation [5] ; potato, leaves bleaching and growth retardation [6] and tomato, fruit failure to develop normal red color [7] . Our result agrees with the study of [14] in which maize plants grew normally by LdGES over-expression. This is possibly due to GPP substrate is sufficiently available in the plastid to support both endogenous terpene synthase and agro-inoculated FaNES1, and/or plastid endogenous terpene synthase is very low to compete with FaNES1 for GPP substrates. This gives clue to study GPP substrates contents and endogenous terpene synthase level in N. benthamiana to use ATTA as means to study linalool synthase from other plant sources.
4.3. Fate of Linalool from FaNES1 under Heterologous Promoters in Transient Assay
Over-expressed linalool synthases in plants do not produce only linalool, but also linalool derivates. The targeted plant endogenous enzymes such as glycosyltrasferase [4] , P450, hydrogenase, reductase, oxidase and cyclase [28] conjugate linalool to other linalool derived compounds. In addition to linalool, FaNES1 gene introduced to Arabidopsis [5] and potato [6] under CaMV35S and chrysanthemum rubisco promoters produced and emitted E-8-hydroxy linalool, 8-hydroxy linalool, E-8-hydroxy-6,7-dihydrolinalool and glycosides as well. Linalool synthase over-expressed in petunia produced linalool and linalyl-β-D glucopyranoside [4] . Reference [29] also reported linalool and linalool oxide production in transgenic carnation flowers expressing Clarkia breweri linalool synthase. Thus, the fate of linalool was analyzed, and two significantly increased masses (801.35 and 803.36) were detected under RbcS, SUC2 and CaMV35S promoters at 4/8 dpi. These m/z signals were not detectable under LTP1 promoter and empty vector. The LC-MS/MS fragmentations of m/z 803.36 were putatively identified as linalool conjugates (linayl-acetyl-β-D glucopyranoside, hydroxylinayl-β-D glucopyranoside and linayl-acetyl- β-D glucopyranoside-formate) (Figure 6) with slight differences from [4] [5] studies. This differences might be due to differences in methods employed to transform the targated plants. Hence, it is possible to identify novel compounds by applying non-targeted LC-MS to study any changes in metabolite profiles by transiently expressing terpene synthases in plant.
There was a significant relative mass abundance difference between day 4 and day 8 for m/z 803.36 from RbcS::FaNES1, SUC2::FaNES1 and CaMV35S::FaNES1 constructs which may be due to transcript accumulations and/or protein modifications overtime. Linalool was depleted under all promoters during day 8 agro-inoculation. Conversely, LC-MS/MS which putatively identified linalool conjugates (Table 1, Figure 5) were progressively increased at day 8 compared to day 4. This shows that there was conjugation of linalool to other compounds. There were also significant intensity differences between day 4 and day 8 for m/z 803.36 MS-MS fragments that increased 1.2 (331.15) to 8 folds (357.18) at 8 dpi under Rbcs and CaMV35S promoters, respectively. Similar expression pattern of LTP1::FaNES1with a control (pBIN) for 803.36 m/z signal might be due to immature plastids in epidermal cells and/or less LTP1 promoter efficiency as discussed above.
Linalool and its derivatives have a positive correlation with the duration of the assay. Linalool emission was higher during shorter time period (4 dpi) and was lower during longer time course (8 dpi). This expression pattern was opposite for linalool conjugated compounds. Hence, to study FaNES1 in transient assay it is suggested to use relatively shorter time and longer duration for linalool and linalool conjugates, respectively.
References
- Dorothea, T. (2006) Terpene Synthases and the Regulation, Diversity and Biological Roles of Terpene Metabolism. Current Opinion in Plant Biology, 9, 297-304. http://dx.doi.org/10.1016/j.pbi.2006.03.014
- Mahmoud, S.S. and Croteau, R.B. (2002) Strategies for Transgenic Manipulation of Monoterpene Biosynthesis in Plants. Trends in Plant Science, 7, 366-373. http://dx.doi.org/10.1016/S1360-1385(02)02303-8
- Jonathan Gershenzon, M.E. (2000) Regulation of Monoterpene Accumulation in Leaves of Peppermint. Plant Physiology, 122, 205-214. http://dx.doi.org/10.1104/pp.122.1.205
- Lücker, J., Bouwmeester, H.J., Schwab, W., Blaas, J., Van Der Plas, L.H.W. and Verhoeven, H.A. (2001) Expression of Clarkia S-Linalool Synthase in Transgenic Petunia Plants Results in the Accumulation of S-Linalyl-β-d-glucopyranoside. The Plant Journal, 27, 315-324. http://dx.doi.org/10.1046/j.1365-313x.2001.01097.x
- Aharoni, A., Giri, A.P., Deuerlein, S., Griepink, F., De Kogel, W.J., Verstappen, F.W.A., Verhoeven, H.A., Jongsma, M.A., Schwab, W. and Bouwmeester, H.J. (2003) Terpenoid Metabolism in Wild-Type and Transgenic Arabidopsis Plants. Plant Cell, 15, 2866-2884. http://dx.doi.org/10.1105/tpc.016253
- Aharoni, A., Jongsma, M., Kim, T.-Y., Ri, M.-B., Giri, A., Verstappen, F., Schwab, W. and Bouwmeester, H. (2006) Metabolic Engineering of Terpenoid Biosynthesis in Plants. Phytochemistry Reviews, 5, 49-58. http://dx.doi.org/10.1007/s11101-005-3747-3
- Davidovich-Rikanati, R., Sitrit, Y., Tadmor, Y., Iijima, Y., Bilenko, N., Bar, E., Carmona, B., Fallik, E., Dudai, N., Simon, J.E., Pichersky, E. and Lewinsohn, E. (2007) Enrichment of Tomato Flavor by Diversion of the Early Plastidial Terpenoid Pathway. Nature Biotechnology, 25, 899-901. http://dx.doi.org/10.1038/nbt1312
- Lazo, G.R., Stein, P.A. and Ludwig, R.A. (1991) A DNA Transformation-Competent Arabidopsis Genomic Library in Agrobacterium. Nature Biotechnology, 9, 963-967. http://dx.doi.org/10.1038/nbt1091-963
- Sanger, F.A., Nicklin, S. and Coulson, A.R. (1977) DNA Sequencing with Chain Termination Inhibitors. Proceedings of the National Academy of Sciences of USA, 74, 5463-5467. http://dx.doi.org/10.1073/pnas.74.12.5463
- McCormac, A., Elliott, M. and Chen, D. (1998) A Simple Method for the Production of Highly Competent Cells of Agrobacterium for Transformation via Electroporation. Molecular Biotechnology, 9, 155-159. http://dx.doi.org/10.1007/BF02760816
- Main, D.G., Reynold, S. and Jill, S.G. (1995) Methods in Molecular Biology, Electroporation for Agrobacterium. Humana Press Inc, Totowa, 405-512.
- Yang, Y., Li, R. and Qi, M. (2000) In Vivo Analysis of Plant Promoters and Transcription Factors by Agroinfiltration of Tobacco Leaves. The Plant Journal, 22, 543-551. http://dx.doi.org/10.1046/j.1365-313x.2000.00760.x
- Zottini, M., Barizza, E., Costa, A., Formentin, E., Ruberti, C., Carimi, F. and Lo Schiavo, F. (2008) Agroinfiltration of Grapevine Leaves for Fast Transient Assays of Gene Expression and for Long-Term Production of Stable Transformed Cells. Plant Cell Reports, 27, 845-853. http://dx.doi.org/10.1007/s00299-008-0510-4
- Yang, T., Stoopen, G., Yalpani, N., Vervoort, J., de Vos, R., Voster, A., Verstappen, F.W.A., Bouwmeester, H.J. and Jongsma, M.A. (2011) Metabolic Engineering of Geranic Acid in Maize to Achieve Fungal Resistance Is Compromised by Novel Glycosylation Pattern. Metabolic Engineering, 13, 414-425. http://dx.doi.org/10.1016/j.ymben.2011.01.011
- De Vos, R.C.H., Moco, S., Lommen, A., Keurentjes, J.J.B., Bino, R.J. and Hall, R.D. (2007) Untargeted Large-Scale Plant Metabolomics Using Liquid Chromatography Coupled to Mass Spectrometry. Nature Protocols, 2, 778-791. http://dx.doi.org/10.1038/nprot.2007.95
- Jefferson, R.A., Kavanagh, T.A. and Bevan, M.W. (1987) GUS Fusions: Beta-Glucuronidase as a Sensitive and Versatile Gene Fusion Marker in Higher Plants. EMBO Journal, 6, 3901-3907.
- Ranjan, A., Ansari, S.A., Srivastava, R., Mantri, S., Asif, M.H., Sawant, S.V. and Tuli, R. (2009) A T9G Mutation in the Prototype TATA-Box TCACTATATATAG Determines Nucleosome Formation & Synergy with Upstream Activator Sequences in Plant Promoters. Plant Physiology, 151, 2174-2186. http://dx.doi.org/10.1104/pp.109.148064
- Truernit, E. and Sauer, N. (1995) The Promoter of the Arabidopsis thaliana SUC2 Sucrose-H+ Symporter Gene Directs Expression of β-Glucuronidase to the Phloem: Evidence for Phloem Loading and Unloading by SUC2. Planta, 196, 564-570. http://dx.doi.org/10.1007/BF00203657
- Torbert, K.A., Gopalraj, M., Medberry, S.L., Olszewski, N.E. and Somers, D.A. (1998) Expression of the Commelina Yellow Mottle Virus Promoter in Transgenic Oat. Plant Cell Reports, 17, 284-287. http://dx.doi.org/10.1007/s002990050393
- Bara ski, R. and Puddephat, I. (2004) Tissue Specific Expression of β-Glucuronidase Gene Driven by Heterologous Promoters in Transgenic Cauliflower Plants. Acta Physiologiae Plantarum, 26, 307-315.
- Lojda, Z. (1970) Indigogenic Methods for Glycosidases. Histochemistry & Cell Biology, 23, 266-288. http://dx.doi.org/10.1007/BF00306428
- Mascarenhas, J.P. and Hamilton, D.A. (1992) Artifacts in the Localization of GUS Activity in Anthers of Petunia Transformed with a CaMV35S-GUS Construct. Plant Journal, 2, 405-408. http://dx.doi.org/10.1111/j.1365-313X.1992.00405.x
- Martin, V.J.J., Piteral, D.J., Withers, S.T., Newman, J.D. and Keasling, J.D. (2003) Engineering a Mevalonate Pathway in Escherichia coli for Production of Terpenoids. Nature Biotechnology, 21, 796-802. http://dx.doi.org/10.1038/nbt833
- Nap, J.P., Spanje, M., Dirkse, W.G., Baarda, G., Mlynarova, L., Loonen, A., Grondhuis, P. and Stiekema, W.J. (1993) Activity of the Promoter of the Lhca3.St.1 Gene, Encoding the Potato Apoprotein 2 of the Light-Harvesting Complex of Photosystem I, in Transgenic Potato and Tobacco Plants. Plant Molecular Biology, 23, 605-612. http://dx.doi.org/10.1007/BF00019307
- Maghuly, F., Khan, M.A., Fernandez, E.B., Druart, P., Watillon, B. and Laimer, M. (2008) Stress Regulated Expression of the GUS-Marker Gene (uidA) under the Control of Plant Calmodulin and Viral 35S Promoters in a Model Fruit Tree Rootstock: Prunus incisa × serrula. Journal of Biotechnology, 135, 105-116. http://dx.doi.org/10.1016/j.jbiotec.2008.02.021
- Outchkourov, N.S., Peters, J., de Jong, J., Rademakers, W. and Jongsma, M.A. (2003) The Promoter-Terminator of Chrysanthemum SMALL Rbcs1directs High Expression Levels in Plants. Planta, 216, 1003-1012.
- Baroux, C., Blanvillain, R., Moore, R. and Gallois, P. (2001) Transactivation of BARNASE under the AtLTP1 Promoter Affects the Basal Pole of the Embryo and Shoot Development of the Adult Plant in Arabidopsis. The Plant Journal, 28, 503-515. http://dx.doi.org/10.1046/j.1365-313X.2001.01174.x
- Chen, X., Yauk, Y.K., Nieuwenhuizen, N.J., Matich, A.J., Wang, M.Y., Perez, R.L., Atkinson, R.G. and Beuning, L.L. (2010) Characterisation of an (S)-linalool Synthase from Kiwifruit (Actinidia arguta) that Catalyses the First Committed Step in the Production of Floral Lilac Compounds. Functional Plant Biology, 37, 232-243. http://dx.doi.org/10.1071/FP09179
- Lavy, M., Zuker, A., Lewinsohn, E., Larkov, O., Ravid, U., Vainstein, A. and Weiss, D. (2002) Linalool and Linalool Oxide Production in Transgenic Carnation Flowers Expressing in Clarkia breweri Linalool Synthase Gene. Molecular Breeding, 9, 103-111. http://dx.doi.org/10.1023/A:1026755414773
- Lindbo, J.A. (2007) TRBO: A High-Efficiency Tobacco Mosaic Virus RNA-Based Overexpression Vector. Plant Physiology, 145, 1232-1240. http://dx.doi.org/10.1104/pp.107.106377
- Miyamoto, T., Nakamura, T., Nagao, I. and Obokata, J. (2000) Quantitative Analysis of Transiently Expressed mRNA in Particle-Bombarded Tobacco Seedlings. Plant Molecular Biology Reporter, 18, 101-107. http://dx.doi.org/10.1007/BF02824017
- Raguso, R.A. and Pichersky, E. (1995) Floral Volatiles from Clarkia breweri: Recent Evolution of Floral Scent and Moth Pollination. Plant Systematics and Evolution, 194, 55-67. http://dx.doi.org/10.1007/BF00983216
- Fujiwara, M., Kazama, Y., Abe, T. and Itoh, R. (2010) Plastid Replication in Leaf Epidermis: Insights from the atminE1 Mutant of Arabidopsis. 21st International Conference on Arabidopsis Research, Yokohama, 6-10 June 2010, 203-204.
NOTES

*Corresponding author.