Paper Menu >>
Journal Menu >>
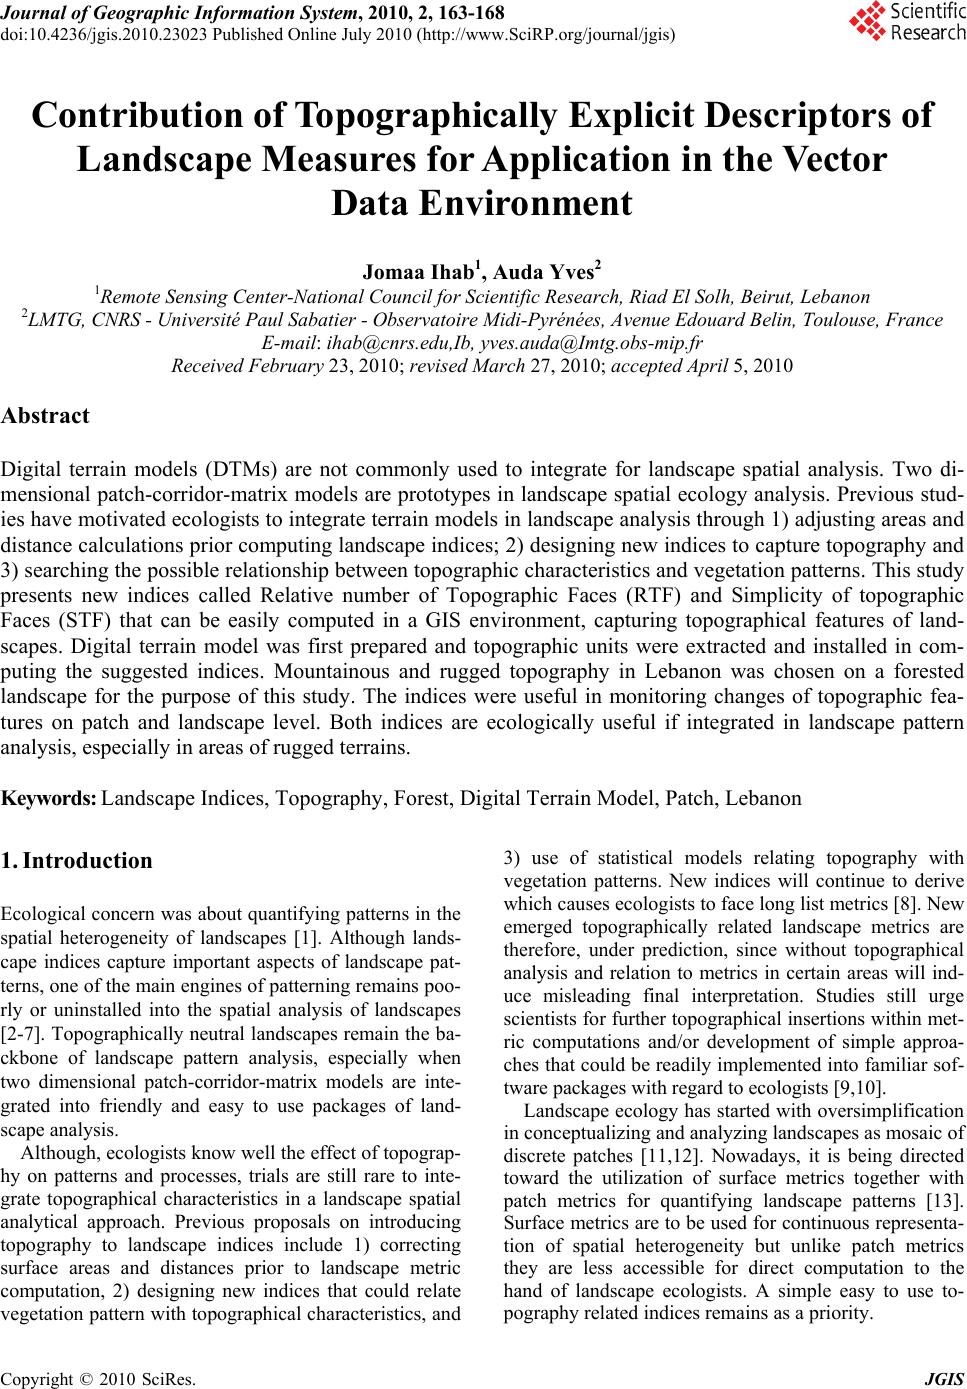 Journal of Geographic Information System, 2010, 2, 163-168 doi:10.4236/jgis.2010.23023 Published Online July 2010 (http://www.SciRP.org/journal/jgis) Copyright © 2010 SciRes. JGIS Contribution of Topographically Explicit Descriptors of Landscape Measures for Application in the Vector Data Environment Jomaa Ihab1, Auda Yves2 1Remote Sensing Center-National Council for Scientific Research, Riad El Solh, Beirut, Lebanon 2LMTG, CNRS - Université Paul Sabatier - Observatoire Midi-Pyrénées, Avenue Edouard Belin, Toulouse, France E-mail: ihab@cnrs.edu,Ib, yves.auda@Imtg.obs-mip.fr Received February 23, 2010; revised March 27, 2010; accepted April 5, 2010 Abstract Digital terrain models (DTMs) are not commonly used to integrate for landscape spatial analysis. Two di- mensional patch-corridor-matrix models are prototypes in landscape spatial ecology analysis. Previous stud- ies have motivated ecologists to integrate terrain models in landscape analysis through 1) adjusting areas and distance calculations prior computing landscape indices; 2) designing new indices to capture topography and 3) searching the possible relationship between topographic characteristics and vegetation patterns. This study presents new indices called Relative number of Topographic Faces (RTF) and Simplicity of topographic Faces (STF) that can be easily computed in a GIS environment, capturing topographical features of land- scapes. Digital terrain model was first prepared and topographic units were extracted and installed in com- puting the suggested indices. Mountainous and rugged topography in Lebanon was chosen on a forested landscape for the purpose of this study. The indices were useful in monitoring changes of topographic fea- tures on patch and landscape level. Both indices are ecologically useful if integrated in landscape pattern analysis, especially in areas of rugged terrains. Keywords: Landscape Indices, Topography, Forest, Digital Terrain Model, Patch, Lebanon 1. Introduction Ecological concern was about quantifying patterns in the spatial heterogeneity of landscapes [1]. Although lands- cape indices capture important aspects of landscape pat- terns, one of the main engines of patterning remains poo- rly or uninstalled into the spatial analysis of landscapes [2-7]. Topographically neutral landscapes remain the ba- ckbone of landscape pattern analysis, especially when two dimensional patch-corridor-matrix models are inte- grated into friendly and easy to use packages of land- scape analysis. Although, ecologists know well the effect of topograp- hy on patterns and processes, trials are still rare to inte- grate topographical characteristics in a landscape spatial analytical approach. Previous proposals on introducing topography to landscape indices include 1) correcting surface areas and distances prior to landscape metric computation, 2) designing new indices that could relate vegetation pattern with topographical characteristics, and 3) use of statistical models relating topography with vegetation patterns. New indices will continue to derive which causes ecologists to face long list metrics [8]. New emerged topographically related landscape metrics are therefore, under prediction, since without topographical analysis and relation to metrics in certain areas will ind- uce misleading final interpretation. Studies still urge scientists for further topographical insertions within met- ric computations and/or development of simple approa- ches that could be readily implemented into familiar sof- tware packages with regard to ecologists [9,10]. Landscape ecology has started with oversimplification in conceptualizing and analyzing landscapes as mosaic of discrete patches [11,12]. Nowadays, it is being directed toward the utilization of surface metrics together with patch metrics for quantifying landscape patterns [13]. Surface metrics are to be used for continuous representa- tion of spatial heterogeneity but unlike patch metrics they are less accessible for direct computation to the hand of landscape ecologists. A simple easy to use to- pography related indices remains as a priority. 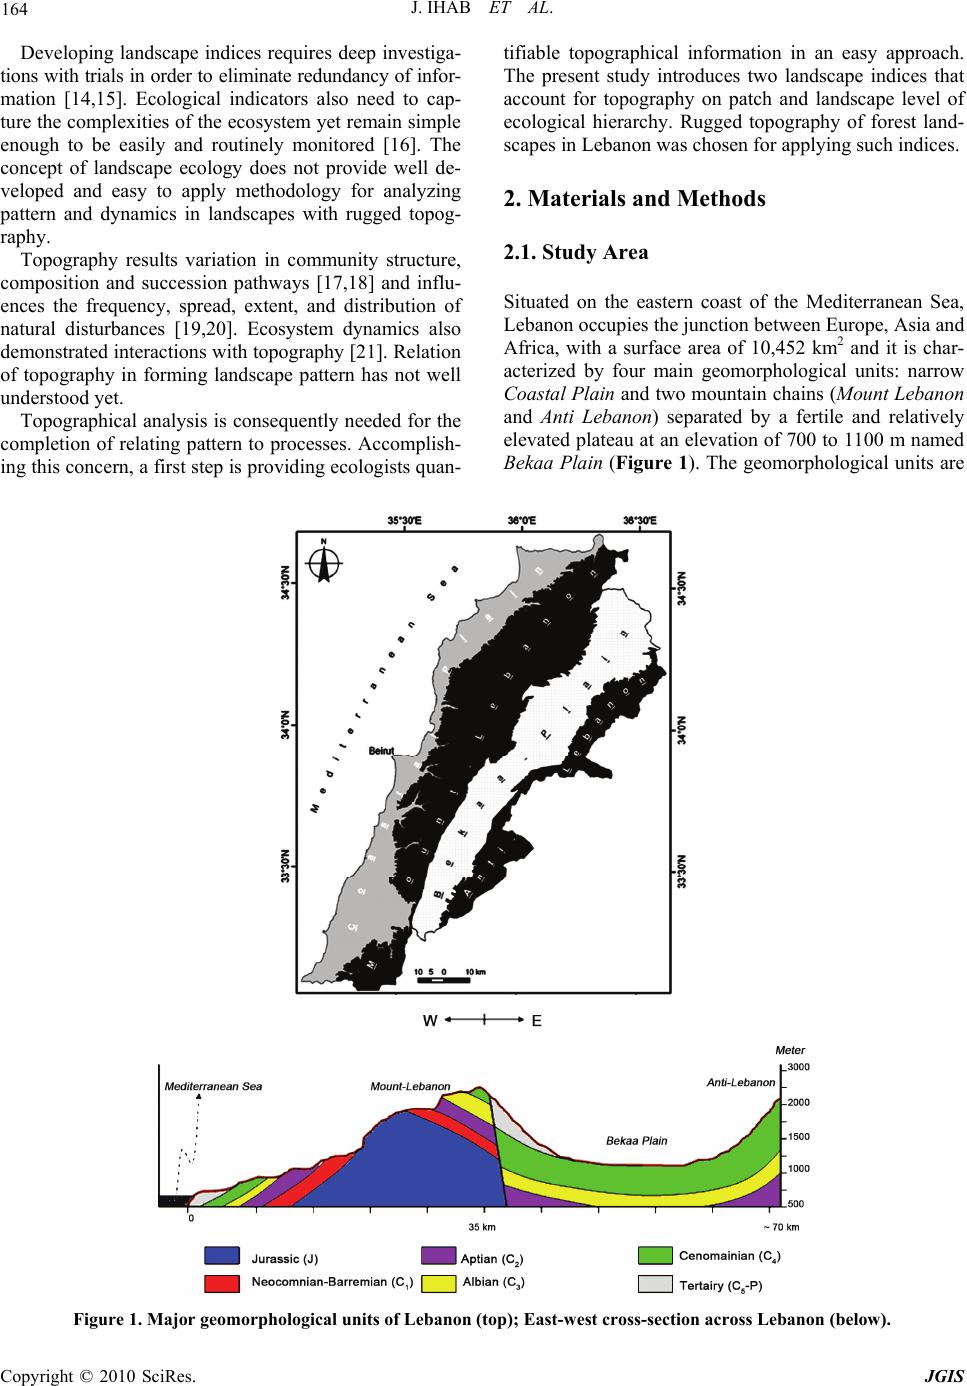 J. IHAB ET AL. Copyright © 2010 SciRes. JGIS 164 Developing landscape indices requires deep investiga- tions with trials in order to eliminate redundancy of infor- mation [14,15]. Ecological indicators also need to cap- ture the complexities of the ecosystem yet remain simple enough to be easily and routinely monitored [16]. The concept of landscape ecology does not provide well de- veloped and easy to apply methodology for analyzing pattern and dynamics in landscapes with rugged topog- raphy. Topography results variation in community structure, composition and succession pathways [17,18] and influ- ences the frequency, spread, extent, and distribution of natural disturbances [19,20]. Ecosystem dynamics also demonstrated interactions with topography [21]. Relation of topography in forming landscape pattern has not well understood yet. Topographical analysis is consequently needed for the completion of relating pattern to processes. Accomplish- ing this concern, a first step is providing ecologists quan- tifiable topographical information in an easy approach. The present study introduces two landscape indices that account for topography on patch and landscape level of ecological hierarchy. Rugged topography of forest land- scapes in Lebanon was chosen for applying such indices. 2. Materials and Methods 2.1. Study Area Situated on the eastern coast of the Mediterranean Sea, Lebanon occupies the junction between Europe, Asia and Africa, with a surface area of 10,452 km2 and it is char- acterized by four main geomorphological units: narrow Coastal Plain and two mountain chains (Mount Lebanon and Anti Lebanon) separated by a fertile and relatively elevated plateau at an elevation of 700 to 1100 m named Bekaa Plain (Figure 1). The geomorphological units are Figure 1. Major geomorphological units of Lebanon (top); East-west cross-section across Lebanon (below). 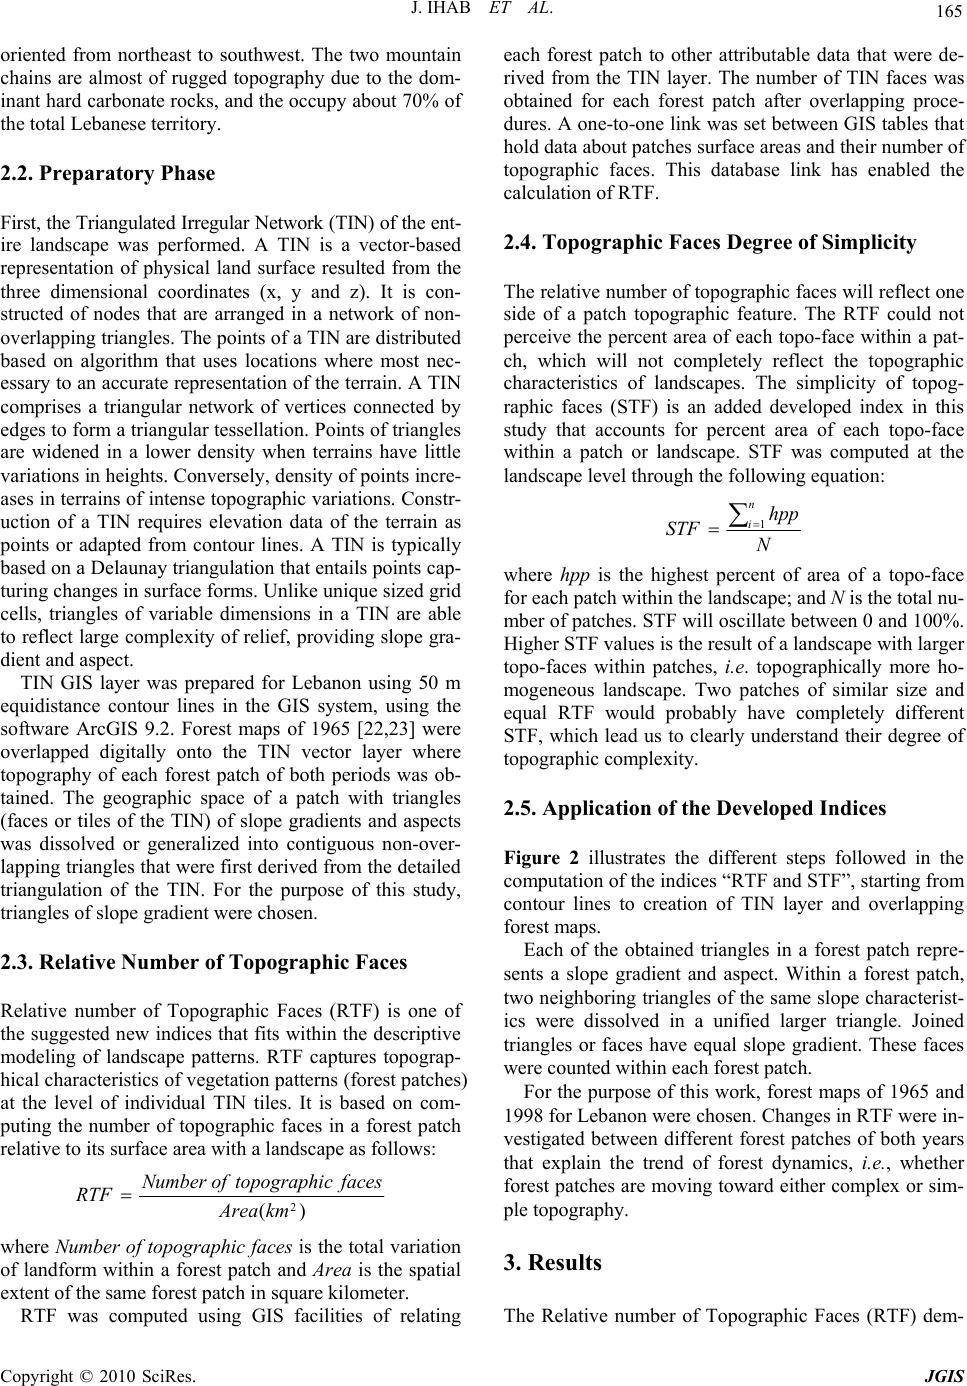 J. IHAB ET AL. Copyright © 2010 SciRes. JGIS 165 oriented from northeast to southwest. The two mountain chains are almost of rugged topography due to the dom- inant hard carbonate rocks, and the occupy about 70% of the total Lebanese territory. 2.2. Preparatory Phase First, the Triangulated Irregular Network (TIN) of the ent- ire landscape was performed. A TIN is a vector-based representation of physical land surface resulted from the three dimensional coordinates (x, y and z). It is con- structed of nodes that are arranged in a network of non- overlapping triangles. The points of a TIN are distributed based on algorithm that uses locations where most nec- essary to an accurate representation of the terrain. A TIN comprises a triangular network of vertices connected by edges to form a triangular tessellation. Points of triangles are widened in a lower density when terrains have little variations in heights. Conversely, density of points incre- ases in terrains of intense topographic variations. Constr- uction of a TIN requires elevation data of the terrain as points or adapted from contour lines. A TIN is typically based on a Delaunay triangulation that entails points cap- turing changes in surface forms. Unlike unique sized grid cells, triangles of variable dimensions in a TIN are able to reflect large complexity of relief, providing slope gra- dient and aspect. TIN GIS layer was prepared for Lebanon using 50 m equidistance contour lines in the GIS system, using the software ArcGIS 9.2. Forest maps of 1965 [22,23] were overlapped digitally onto the TIN vector layer where topography of each forest patch of both periods was ob- tained. The geographic space of a patch with triangles (faces or tiles of the TIN) of slope gradients and aspects was dissolved or generalized into contiguous non-over- lapping triangles that were first derived from the detailed triangulation of the TIN. For the purpose of this study, triangles of slope gradient were chosen. 2.3. Relative Number of Topographic Faces Relative number of Topographic Faces (RTF) is one of the suggested new indices that fits within the descriptive modeling of landscape patterns. RTF captures topograp- hical characteristics of vegetation patterns (forest patches) at the level of individual TIN tiles. It is based on com- puting the number of topographic faces in a forest patch relative to its surface area with a landscape as follows: )( 2 kmArea facesctopographiofNumber RTF where Number of topographic faces is the total variation of landform within a forest patch and Area is the spatial extent of the same forest patch in square kilometer. RTF was computed using GIS facilities of relating each forest patch to other attributable data that were de- rived from the TIN layer. The number of TIN faces was obtained for each forest patch after overlapping proce- dures. A one-to-one link was set between GIS tables that hold data about patches surface areas and their number of topographic faces. This database link has enabled the calculation of RTF. 2.4. Topographic Faces Degree of Simplicity The relative number of topographic faces will reflect one side of a patch topographic feature. The RTF could not perceive the percent area of each topo-face within a pat- ch, which will not completely reflect the topographic characteristics of landscapes. The simplicity of topog- raphic faces (STF) is an added developed index in this study that accounts for percent area of each topo-face within a patch or landscape. STF was computed at the landscape level through the following equation: N hpp STF n i 1 where hpp is the highest percent of area of a topo-face for each patch within the landscape; and N is the total nu- mber of patches. STF will oscillate between 0 and 100%. Higher STF values is the result of a landscape with larger topo-faces within patches, i.e. topographically more ho- mogeneous landscape. Two patches of similar size and equal RTF would probably have completely different STF, which lead us to clearly understand their degree of topographic complexity. 2.5. Application of the Developed Indices Figure 2 illustrates the different steps followed in the computation of the indices “RTF and STF”, starting from contour lines to creation of TIN layer and overlapping forest maps. Each of the obtained triangles in a forest patch repre- sents a slope gradient and aspect. Within a forest patch, two neighboring triangles of the same slope characterist- ics were dissolved in a unified larger triangle. Joined triangles or faces have equal slope gradient. These faces were counted within each forest patch. For the purpose of this work, forest maps of 1965 and 1998 for Lebanon were chosen. Changes in RTF were in- vestigated between different forest patches of both years that explain the trend of forest dynamics, i.e., whether forest patches are moving toward either complex or sim- ple topography. 3. Results The Relative number of Topographic Faces (RTF) dem- 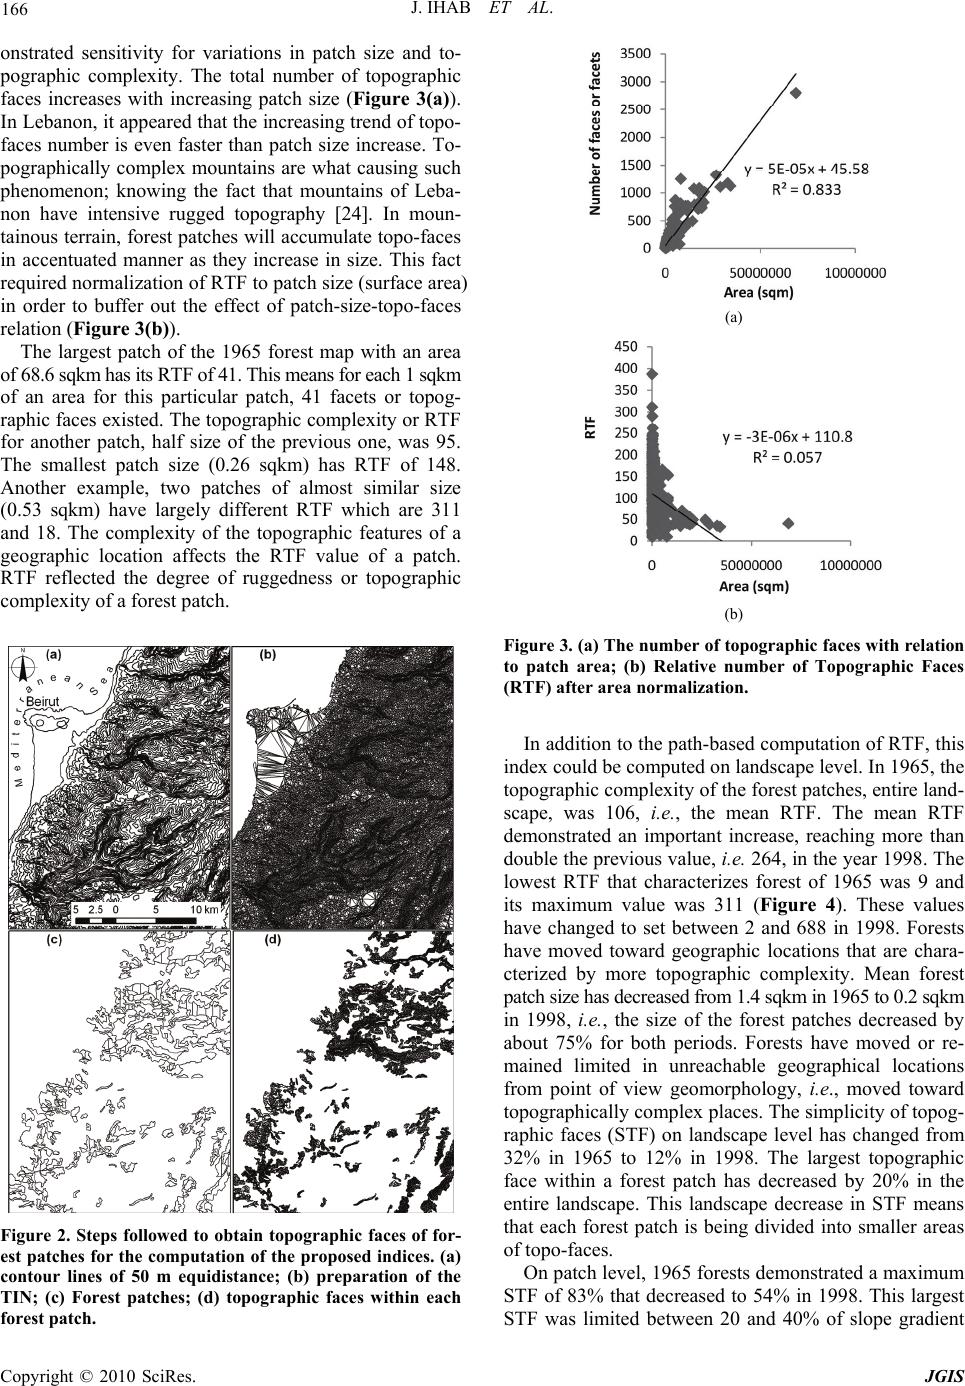 J. IHAB ET AL. Copyright © 2010 SciRes. JGIS 166 onstrated sensitivity for variations in patch size and to- pographic complexity. The total number of topographic faces increases with increasing patch size (Figure 3(a)). In Lebanon, it appeared that the increasing trend of topo- faces number is even faster than patch size increase. To- pographically complex mountains are what causing such phenomenon; knowing the fact that mountains of Leba- non have intensive rugged topography [24]. In moun- tainous terrain, forest patches will accumulate topo-faces in accentuated manner as they increase in size. This fact required normalization of RTF to patch size (surface area) in order to buffer out the effect of patch-size-topo-faces relation (Figure 3(b)). The largest patch of the 1965 forest map with an area of 68.6 sqkm has its RTF of 41. This means for each 1 sqkm of an area for this particular patch, 41 facets or topog- raphic faces existed. The topographic complexity or RTF for another patch, half size of the previous one, was 95. The smallest patch size (0.26 sqkm) has RTF of 148. Another example, two patches of almost similar size (0.53 sqkm) have largely different RTF which are 311 and 18. The complexity of the topographic features of a geographic location affects the RTF value of a patch. RTF reflected the degree of ruggedness or topographic complexity of a forest patch. Figure 2. Steps followed to obtain topographic faces of for- est patches for the computation of the proposed indices. (a) contour lines of 50 m equidistance; (b) preparation of the TIN; (c) Forest patches; (d) topographic faces within each forest patch. (a) (b) Figure 3. (a) The number of topographic faces with relation to patch area; (b) Relative number of Topographic Faces (RTF) after area normalization. In addition to the path-based computation of RTF, this index could be computed on landscape level. In 1965, the topographic complexity of the forest patches, entire land- scape, was 106, i.e., the mean RTF. The mean RTF demonstrated an important increase, reaching more than double the previous value, i.e. 264, in the year 1998. The lowest RTF that characterizes forest of 1965 was 9 and its maximum value was 311 (Figure 4). These values have changed to set between 2 and 688 in 1998. Forests have moved toward geographic locations that are chara- cterized by more topographic complexity. Mean forest patch size has decreased from 1.4 sqkm in 1965 to 0.2 sqkm in 1998, i.e., the size of the forest patches decreased by about 75% for both periods. Forests have moved or re- mained limited in unreachable geographical locations from point of view geomorphology, i.e., moved toward topographically complex places. The simplicity of topog- raphic faces (STF) on landscape level has changed from 32% in 1965 to 12% in 1998. The largest topographic face within a forest patch has decreased by 20% in the entire landscape. This landscape decrease in STF means that each forest patch is being divided into smaller areas of topo-faces. On patch level, 1965 forests demonstrated a maximum STF of 83% that decreased to 54% in 1998. This largest STF was limited between 20 and 40% of slope gradient  J. IHAB ET AL. Copyright © 2010 SciRes. JGIS 167 Figure 4. Two different forest patches showing minimum and maximum RTF of 1965 map. in 1965 and between 27% and 44% of slope gradient in 1998. 4. Discussions and Conclusions Metrics are still challenging for their ecological applica- tions relating pattern to process. This study gives an insi- ght about how to integrate topography into pattern analy- sis at the landscape or patch level. New landscape indic- es were proposed that could be computed in GIS system with automated method. Both indices account directly for topographic characteristics of a patch or landscape. They are designed to assess topographic variation, follo- wing detailed topographic segmentation of area through the triangulated irregular network (TIN). Analysis could undergo on any level of subdividing topographic units or faces. Also, a topographic face could remain in the poss- ible smallest subdivision generated through TIN compu- tation or generalization of faces also could be practiced depending on the study purpose. Detailed information of slope gradient or aspect was provided in TIN layer of GIS. The user has to decide whether to establish the anal- ysis on the basis of slope gradient or aspect or on both divisions. Our example uses forests of Lebanon that are characterized by their mountainous habitat. In such rug- ged mountains, topography play prominent role in pat- terning the landscape. While landscape indices alone do not account for topographic characteristics of an area, the indices ‘RTF and STF’, as presented here, integrate topo- graphy in a simple manner without the need to pass into complicated transformation of grid computation sugges- ted in previous studies [9]. Through, the computation of RTF and STF, forest patches are separated into different ranges of topographic complexity. Different landscapes could also be analyzed for variations topographic chara- cteristics. The developed indices could also investigate changes of topography through different time periods. In Lebanon, forest patches demonstrated more topographi- cal complexity when comparing forest maps of 1965 and 1998. During this period, such increase in topographic complexity was accompanied with patch size decrease. Some forest patches have moved towards less topograp- hically complex areas while others forest residues remain- ned in rugged areas. RTF has doubled with 20% decrease in STF and 75% decrease in patch size. This reveals the importance and explains what valuable information could be obtained of computing RTF and STF together with other landscape indices. Previous studies were sati- sfied in monitoring changes of landscape spatial pattern- ing through the computation of landscape indices that have no relation to topography although the landscapes were mostly of mountainous characteristics. Many land- scape indices have limited or no/undiscovered relation to processes. It is therefore, recommended to work on land- scape indices basis that are more creditable to answer changes in processes. Processes are largely connected to topography as well as its changes [6]. The presented in- dices are easy to apply in a GIS system. Their automa- tion is also possible through their future implementation in a landscape spatial analysis software package. 5. References [1] R. V. O’Neill, J. R. Krummel, R. H. Gardner, G. Sugi- hara, B. Jackson, D. L. DeAngelis, B. T. Milne, M. G. Turner, B. Zygmunt, S. W. Christensen, V. H. Dale and R. L. Graham, “Indices of Landscape Pattern,” Landscape Ecology, Vol. 1, No. 3, 1988, pp 153-162. [2] N. Lele, P. K.Joshi and S. P. Agrawal, “Assessing Forest Fragmentation in Northeastern Region (NER) of India Using Landscape Matrices,” Ecology Indicators, Vol. 8, No. 5, 2008, pp. 657-663. [3] I. Jomaa, Y. Auda, B. Abi Saleh, M. Hamze and S. Safi, “Landscape Spatial Dynamics over 38 Years under Natu- ral and Anthropogenic Pressures in Mount Lebanon,” Landscape and Urban Plan, Vol. 87, No. 1, 2008, pp. 67-75. [4] M. Li, C. Huang, Z. Zhu, H. Shi, H. Lu and S. Peng, “Assessing Rates of Forest Change and Fragmentation in Alabama, USA, Using the Vegetation Change Tracker Model,” Forest Ecology and Management, Vol. 257, No. 6, 2009, pp. 1480-1488. [5] W. Kong, O. J. Sun, W. Xu and Y. Chen, “Changes in Vegetation and Landscape Patterns with Altered River Water-Flow in Arid West China,” Journal of Arid Envi-  J. IHAB ET AL. Copyright © 2010 SciRes. JGIS 168 ronments, Vol. 73, No. 3, 2009, pp. 306-313. [6] M. Sano, A. Miyamoto, N. Furuya and K. Kogi, “Using Landscape Metrics and Topographic Analysis to Examine Forest Management in a Mixed Forest, Hokaido, Japan: Guidelines for Management Interventions and Evaluation of Cover Changes,” Forest Ecology and Management, Vol. 257, No. 4, 2009, pp. 1208-1218. [7] I. Jomaa, Y. Auda, M. Hamze, B. Abi Saleh and S. Safi, “Analysis of Eastern Mediterranean Oak Forests over the Period 1965-2003 Using Landscape Indices on a Patch Basis,” Landscape Research, Vol. 34, No. 1, 2009, pp. 105-124. [8] E. J. Gustafson, “Quantifying Landscape Spatial Pattern: What is the State of the Art?” Ecosystems, Vol. 1, No. 2, 1998, pp. 143-156. [9] B. Dorner, K. Lertzman and J. Fall, “Landscape Pattern in Topographically Complex Landscapes: Issues and Techniques for Analysis,” Landscape Ecology, Vol. 17, No. 8, 2002, pp. 729-743. [10] S. Hoechstetter, U. Walz, L. H.Dang and N. X. Thinh, “Effects of Topography and Surface Roughness in Analyses of Landscape Structure—A Proposal to Modify the Existing Set of Landscape Metrics,” Landscape Online, Vol. 3, 2008, pp. 1-14. [11] R. T. T. Forman, “Land Mosaic: The Ecology of Land- scapes and Regions,” Cambridge University Press, Cam- bridge, 1995. [12] M. G. Turner, R. H. Gardner and R. V. O’Neill, “Land- scape Ecology in Theory and Practice: Pattern and Proc- ess,” Springer, New York, 2001. [13] K. McGarical, S. Tagil and S. A. Cushman, “Surface Metrics: An Alternative to Patch Metrics for the Quanti- fication of Landscape Structure,” Landscape Ecology, Vol. 24, No. 3, 2009, pp. 433-450. [14] B. Traub and C. Kleinn, “Measuring Fragmentation and Structural Diversity,” Forstw Centralblatt, Vol. 118, 1999, pp. 39-50. [15] S. A. Cushman, K. McGarigal and M. C. Neel, “Pari- mony in Landscape Metrics: Strength, Universability, and Consistency,” Ecology Indicators, Vol. 8, No. 5, 2008, pp. 691-703. [16] V. H. Dale and S. C. Beyeler, “Challenges in the Devel- opment and Use of Ecological Indicators,” Ecology Indi- cators, Vol. 1, No. 1, 2001, pp. 3-10. [17] W. H. McNab, “Terrain Shape Index: Quantifying Effect of Minor Landforms on Tree Height,” Forest Science, Vol. 35, No. 1, 1989, pp. 91-104. [18] J. L. Ohmann and T. A. Spies, “Regional Gradient Analysis and Spatial Pattern of Woody Plant Communi- ties of Oregon,” Ecological Monographs, Vol. 68, No. 2, 1998, pp. 151-182. [19] W. H. Romme and D. H Knight, “Fire Frequency and Subalpine Forest Succession along a Topographic Gradi- ent in Wyoming,” Ecology, Vol. 62, No. 2, 1981, pp. 319-326. [20] M. G. A. Kramer, A. J. Hansen and M. L. Taper, “Abiotic Controls on Long-Term Windthrow Disturbance and Temperate Rain Forest Dynamics in Southeast Alaska,” Ecology, Vol. 82, No. 10, 2001, pp. 2749-2768. [21] F. J. Swanson, T. K. Kratz, N. Caine, R. G. Woodmansee, “Landform Effects on Ecosystem Patterns and Proc- esses,” Bio-Science, Vol. 38, No. 2, 1998, pp. 92-98. [22] K. El Husseini and R. Baltaxe, “Forest Map of Lebanon at 1/50,000 Scale,” Forestry Education, Training and Re- search Project, Green Plan, Lebanon. United Nations Special Fund/FAO, 1965. [23] MOA/MoE, “Landcover Map of Lebanon for the Year 1998 (MOS: Mode d’Occupation du Sol),” Prepared by the Lebanese National Council for Scientific Research (CNRS)-Remote Sensing Center with the Collaboration of IAURIF (Institut d’Aménagement et d’Urbanisme de la Région d’Ile de France). LEDO Program, UNDP, Min- istry of Agriculture and Ministry of Environment (Leba- non), 2002. [24] B. Hakim, “Recherches hydrologiques et hydrochimiques sur quelques karst méditerranéennes: Liban, Syrie et Maroc,” Publications de L'université Libanaise, Section des études géographiques,Tome 2, 1985, p. 701. |