Paper Menu >>
Journal Menu >>
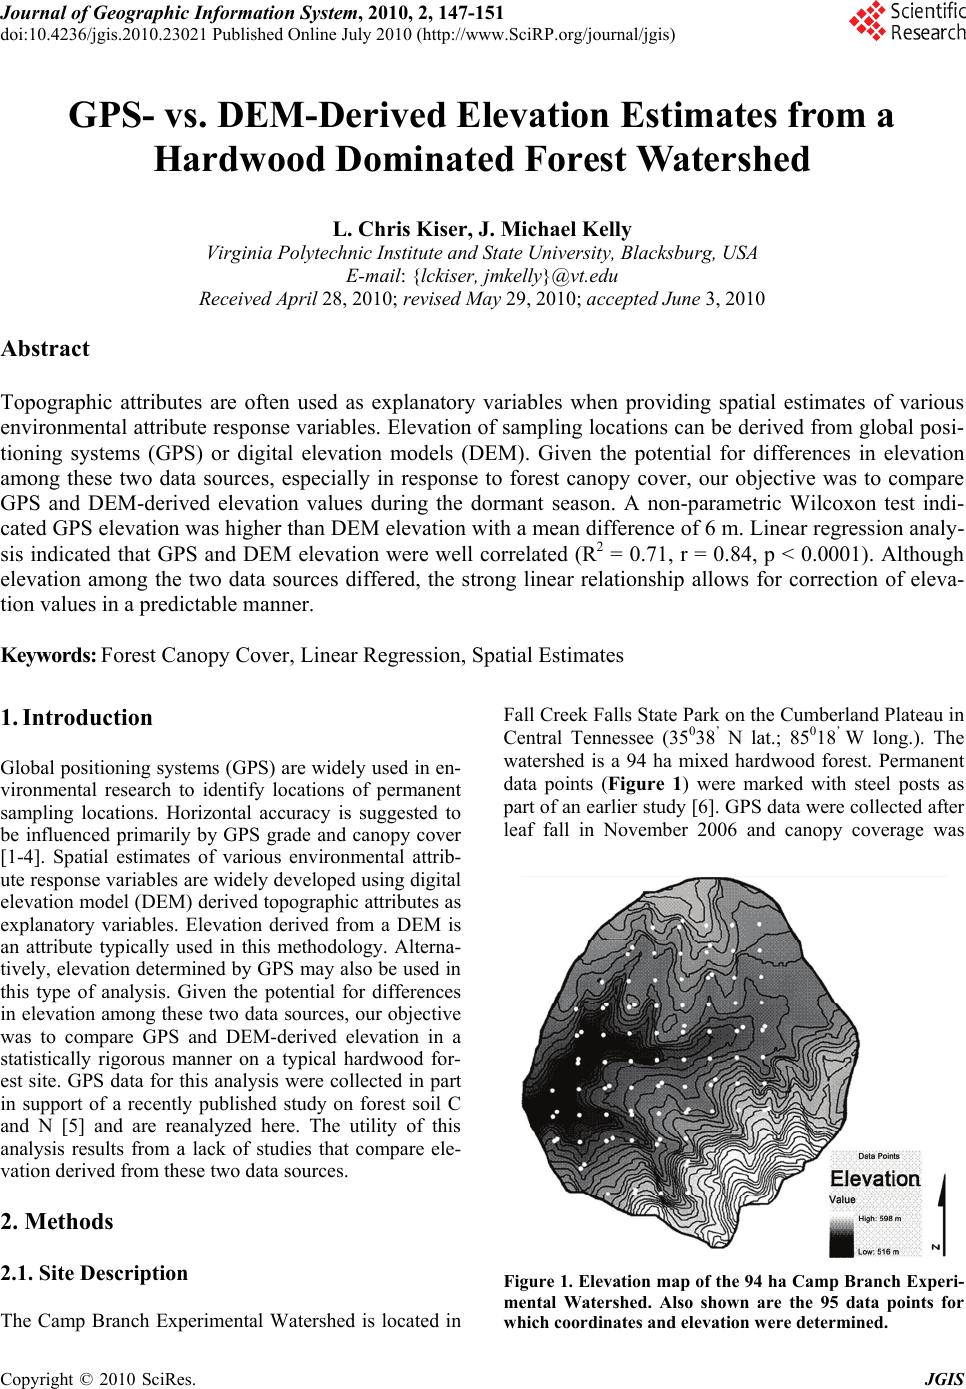 Journal of Geographic Information System, 2010, 2, 147-151 doi:10.4236/jgis.2010.23021 Published Online July 2010 (http://www.SciRP.org/journal/jgis) Copyright © 2010 SciRes. JGIS GPS- vs. DEM-Derived Elevation Estimates from a Hardwood Dominated Forest Watershed L. Chris Kiser, J. Michael Kelly Virginia Polytechnic Institute and State University, Blacksburg, USA E-mail: {lckiser, jmkelly}@vt.edu Received April 28, 2010; revised May 29, 2010; accepted June 3, 2010 Abstract Topographic attributes are often used as explanatory variables when providing spatial estimates of various environmental attribute response variables. Elevation of sampling locations can be derived from global posi- tioning systems (GPS) or digital elevation models (DEM). Given the potential for differences in elevation among these two data sources, especially in response to forest canopy cover, our objective was to compare GPS and DEM-derived elevation values during the dormant season. A non-parametric Wilcoxon test indi- cated GPS elevation was higher than DEM elevation with a mean difference of 6 m. Linear regression analy- sis indicated that GPS and DEM elevation were well correlated (R2 = 0.71, r = 0.84, p < 0.0001). Although elevation among the two data sources differed, the strong linear relationship allows for correction of eleva- tion values in a predictable manner. Keywords: Forest Canopy Cover, Linear Regression, Spatial Estimates 1. Introduction Global positioning systems (GPS) are widely used in en- vironmental research to identify locations of permanent sampling locations. Horizontal accuracy is suggested to be influenced primarily by GPS grade and canopy cover [1-4]. Spatial estimates of various environmental attrib- ute response variables are widely developed using digital elevation model (DEM) derived topographic attributes as explanatory variables. Elevation derived from a DEM is an attribute typically used in this methodology. Alterna- tively, elevation determined by GPS may also be used in this type of analysis. Given the potential for differences in elevation among these two data sources, our objective was to compare GPS and DEM-derived elevation in a statistically rigorous manner on a typical hardwood for- est site. GPS data for this analysis were collected in part in support of a recently published study on forest soil C and N [5] and are reanalyzed here. The utility of this analysis results from a lack of studies that compare ele- vation derived from these two data sources. 2. Methods 2.1. Site Description The Camp Branch Experimental Watershed is located in Fall Creek Falls State Park on the Cumberland Plateau in Central Tennessee (35038’ N lat.; 85018’ W long.). The watershed is a 94 ha mixed hardwood forest. Permanent data points (Figure 1) were marked with steel posts as part of an earlier study [6]. GPS data were collected after leaf fall in November 2006 and canopy coverage was Figure 1. Elevation map of the 94 ha Camp Branch Experi- mental Watershed. Also shown are the 95 data points for which coordinates and elevation were determined. 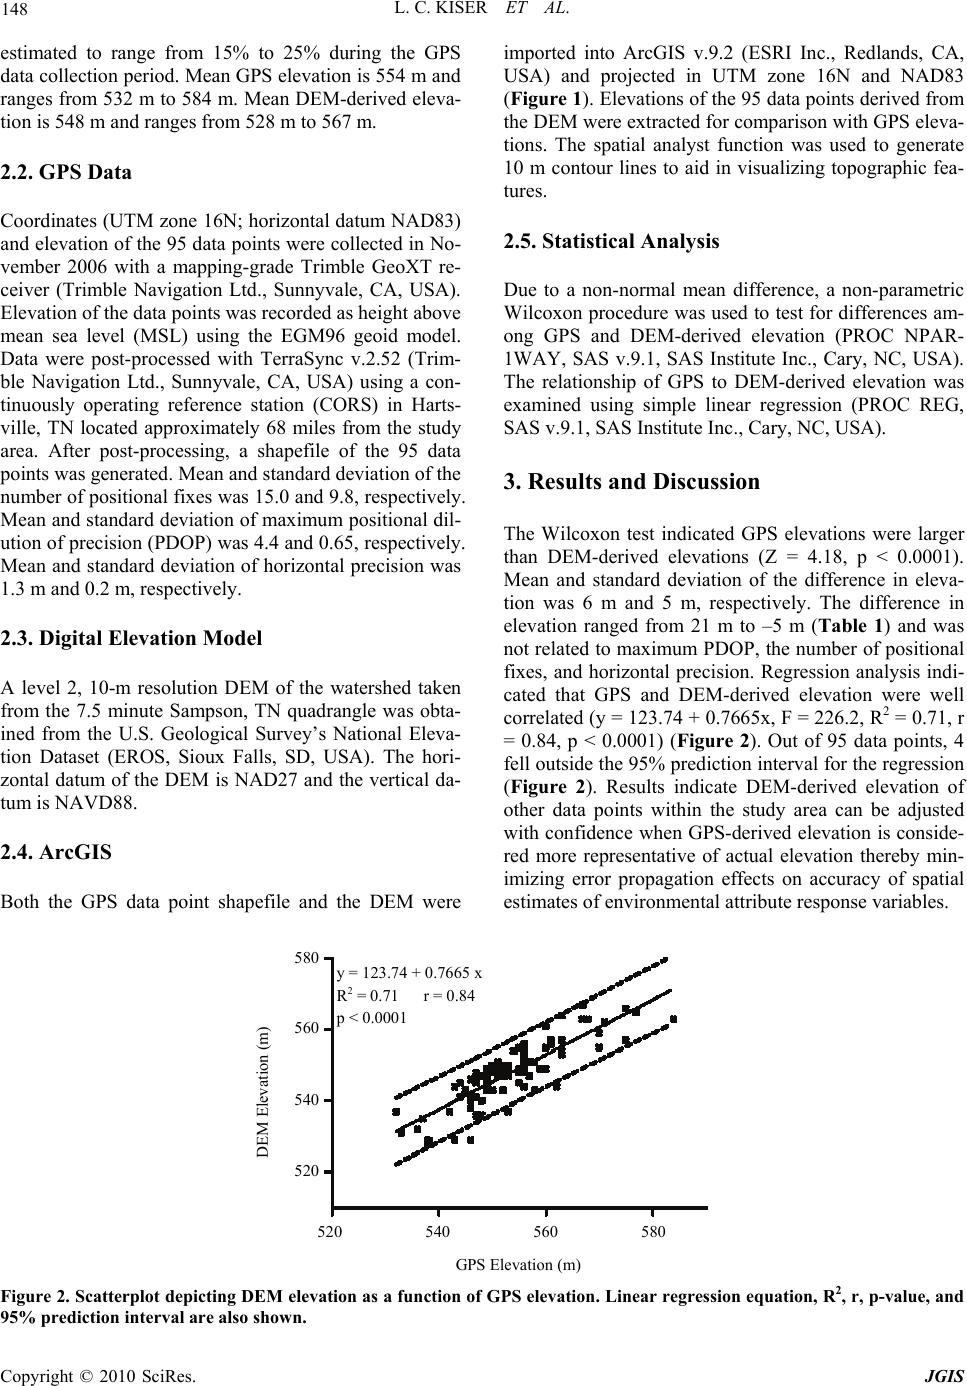 L. C. KISER ET AL. Copyright © 2010 SciRes. JGIS 148 estimated to range from 15% to 25% during the GPS data collection period. Mean GPS elevation is 554 m and ranges from 532 m to 584 m. Mean DEM-derived eleva- tion is 548 m and ranges from 528 m to 567 m. 2.2. GPS Data Coordinates (UTM zone 16N; horizontal datum NAD83) and elevation of the 95 data points were collected in No- vember 2006 with a mapping-grade Trimble GeoXT re- ceiver (Trimble Navigation Ltd., Sunnyvale, CA, USA). Elevation of the data points was recorded as height above mean sea level (MSL) using the EGM96 geoid model. Data were post-processed with TerraSync v.2.52 (Trim- ble Navigation Ltd., Sunnyvale, CA, USA) using a con- tinuously operating reference station (CORS) in Harts- ville, TN located approximately 68 miles from the study area. After post-processing, a shapefile of the 95 data points was generated. Mean and standard deviation of the number of positional fixes was 15.0 and 9.8, respectively. Mean and standard deviation of maximum positional dil- ution of precision (PDOP) was 4.4 and 0.65, respectively. Mean and standard deviation of horizontal precision was 1.3 m and 0.2 m, respectively. 2.3. Digital Elevation Model A level 2, 10-m resolution DEM of the watershed taken from the 7.5 minute Sampson, TN quadrangle was obta- ined from the U.S. Geological Survey’s National Eleva- tion Dataset (EROS, Sioux Falls, SD, USA). The hori- zontal datum of the DEM is NAD27 and the vertical da- tum is NAVD88. 2.4. ArcGIS Both the GPS data point shapefile and the DEM were imported into ArcGIS v.9.2 (ESRI Inc., Redlands, CA, USA) and projected in UTM zone 16N and NAD83 (Figure 1). Elevations of the 95 data points derived from the DEM were extracted for comparison with GPS eleva- tions. The spatial analyst function was used to generate 10 m contour lines to aid in visualizing topographic fea- tures. 2.5. Statistical Analysis Due to a non-normal mean difference, a non-parametric Wilcoxon procedure was used to test for differences am- ong GPS and DEM-derived elevation (PROC NPAR- 1WAY, SAS v.9.1, SAS Institute Inc., Cary, NC, USA). The relationship of GPS to DEM-derived elevation was examined using simple linear regression (PROC REG, SAS v.9.1, SAS Institute Inc., Cary, NC, USA). 3. Results and Discussion The Wilcoxon test indicated GPS elevations were larger than DEM-derived elevations (Z = 4.18, p < 0.0001). Mean and standard deviation of the difference in eleva- tion was 6 m and 5 m, respectively. The difference in elevation ranged from 21 m to –5 m (Table 1) and was not related to maximum PDOP, the number of positional fixes, and horizontal precision. Regression analysis indi- cated that GPS and DEM-derived elevation were well correlated (y = 123.74 + 0.7665x, F = 226.2, R2 = 0.71, r = 0.84, p < 0.0001) (Figure 2). Out of 95 data points, 4 fell outside the 95% prediction interval for the regression (Figure 2). Results indicate DEM-derived elevation of other data points within the study area can be adjusted with confidence when GPS-derived elevation is conside- red more representative of actual elevation thereby min- imizing error propagation effects on accuracy of spatial estimates of environmental attribute response variables. GPS Elevation (m) 520 540 560 580 DEM Elevation ( m ) 580 560 540 520 y = 123.74 + 0.7665 x R 2 = 0.71 r = 0.84 p < 0.0001 Figure 2. Scatterplot depicting DEM elevation as a function of GPS elevation. Linear regression equation, R2, r, p-value, and 95% prediction interval are also shown. 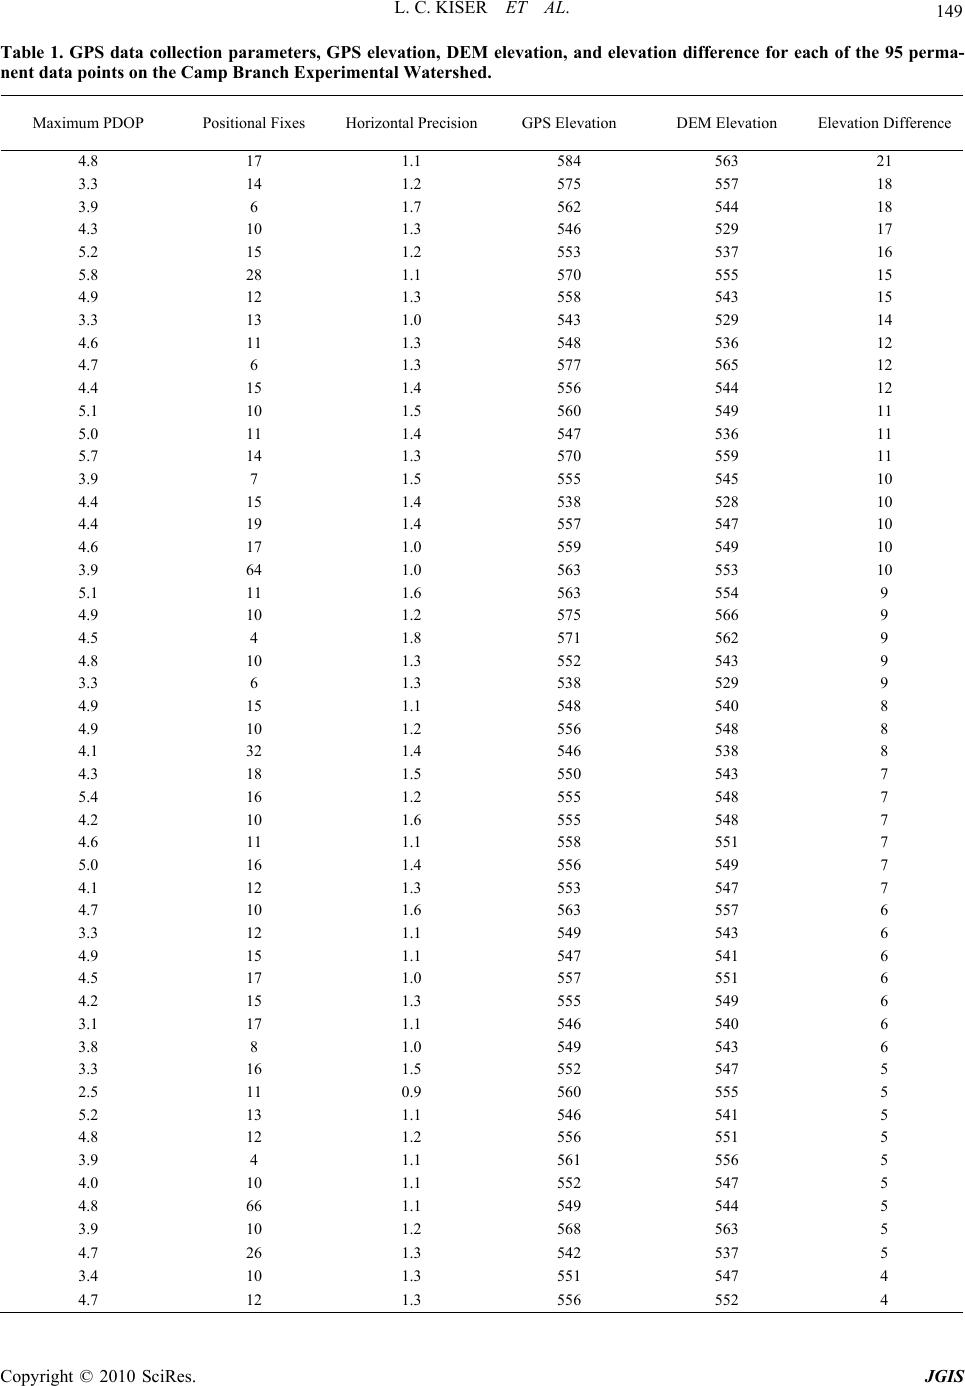 L. C. KISER ET AL. Copyright © 2010 SciRes. JGIS 149 Table 1. GPS data collection parameters, GPS elevation, DEM elevation, and elevation difference for each of the 95 perma- nent data points on the Camp Branch Experimental Watershed. Maximum PDOP Positional Fixes Horizontal PrecisionGPS Elevation DEM Elevation Elevation Difference 4.8 17 1.1 584 563 21 3.3 14 1.2 575 557 18 3.9 6 1.7 562 544 18 4.3 10 1.3 546 529 17 5.2 15 1.2 553 537 16 5.8 28 1.1 570 555 15 4.9 12 1.3 558 543 15 3.3 13 1.0 543 529 14 4.6 11 1.3 548 536 12 4.7 6 1.3 577 565 12 4.4 15 1.4 556 544 12 5.1 10 1.5 560 549 11 5.0 11 1.4 547 536 11 5.7 14 1.3 570 559 11 3.9 7 1.5 555 545 10 4.4 15 1.4 538 528 10 4.4 19 1.4 557 547 10 4.6 17 1.0 559 549 10 3.9 64 1.0 563 553 10 5.1 11 1.6 563 554 9 4.9 10 1.2 575 566 9 4.5 4 1.8 571 562 9 4.8 10 1.3 552 543 9 3.3 6 1.3 538 529 9 4.9 15 1.1 548 540 8 4.9 10 1.2 556 548 8 4.1 32 1.4 546 538 8 4.3 18 1.5 550 543 7 5.4 16 1.2 555 548 7 4.2 10 1.6 555 548 7 4.6 11 1.1 558 551 7 5.0 16 1.4 556 549 7 4.1 12 1.3 553 547 7 4.7 10 1.6 563 557 6 3.3 12 1.1 549 543 6 4.9 15 1.1 547 541 6 4.5 17 1.0 557 551 6 4.2 15 1.3 555 549 6 3.1 17 1.1 546 540 6 3.8 8 1.0 549 543 6 3.3 16 1.5 552 547 5 2.5 11 0.9 560 555 5 5.2 13 1.1 546 541 5 4.8 12 1.2 556 551 5 3.9 4 1.1 561 556 5 4.0 10 1.1 552 547 5 4.8 66 1.1 549 544 5 3.9 10 1.2 568 563 5 4.7 26 1.3 542 537 5 3.4 10 1.3 551 547 4 4.7 12 1.3 556 552 4 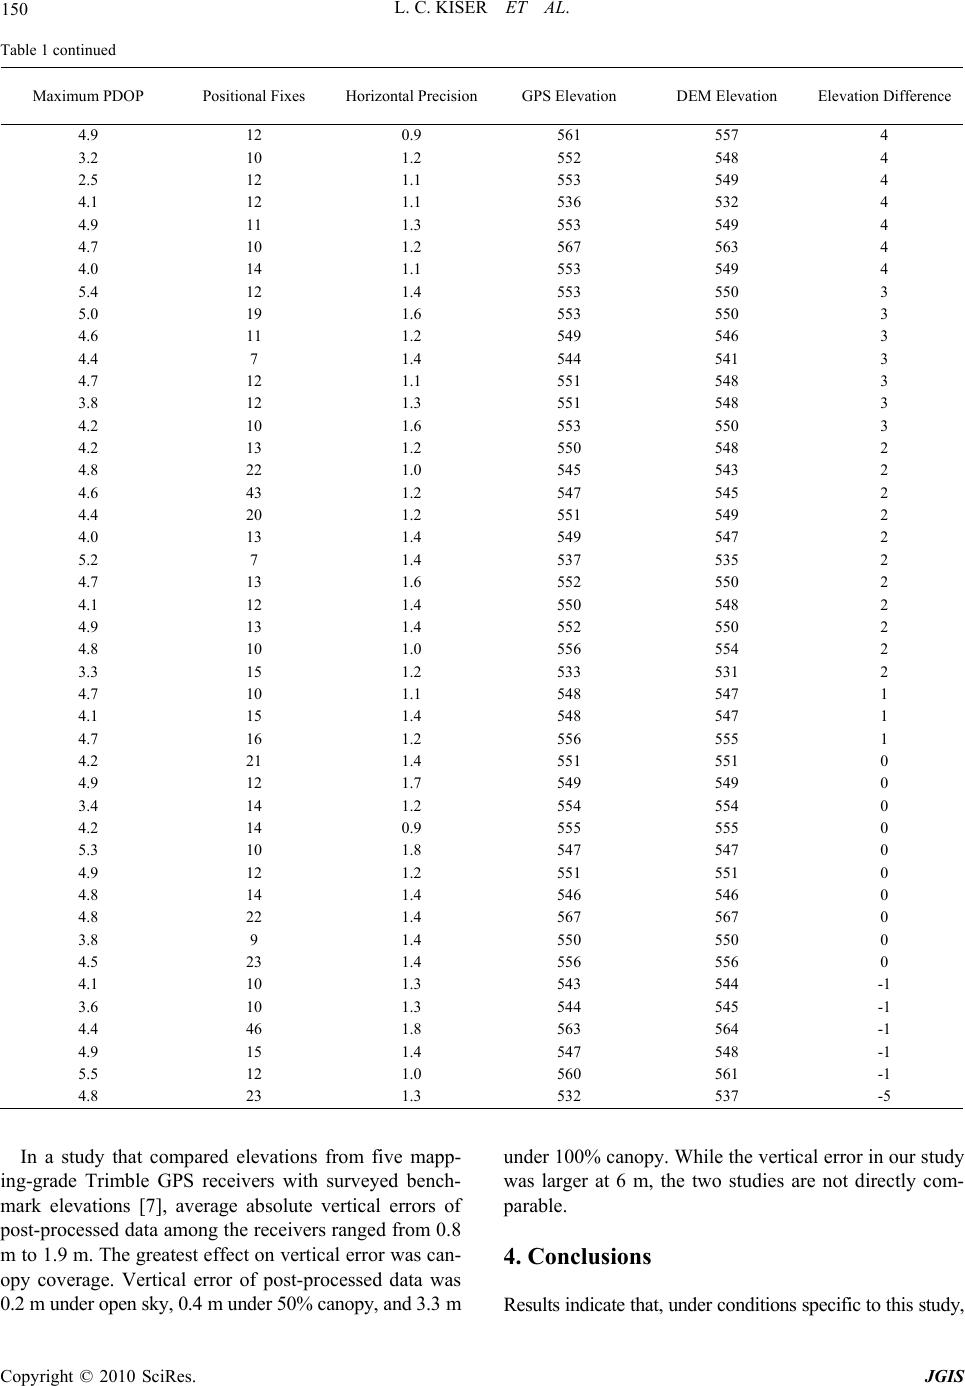 L. C. KISER ET AL. Copyright © 2010 SciRes. JGIS 150 Table 1 continued Maximum PDOP Positional Fixes Horizontal PrecisionGPS Elevation DEM Elevation Elevation Difference 4.9 12 0.9 561 557 4 3.2 10 1.2 552 548 4 2.5 12 1.1 553 549 4 4.1 12 1.1 536 532 4 4.9 11 1.3 553 549 4 4.7 10 1.2 567 563 4 4.0 14 1.1 553 549 4 5.4 12 1.4 553 550 3 5.0 19 1.6 553 550 3 4.6 11 1.2 549 546 3 4.4 7 1.4 544 541 3 4.7 12 1.1 551 548 3 3.8 12 1.3 551 548 3 4.2 10 1.6 553 550 3 4.2 13 1.2 550 548 2 4.8 22 1.0 545 543 2 4.6 43 1.2 547 545 2 4.4 20 1.2 551 549 2 4.0 13 1.4 549 547 2 5.2 7 1.4 537 535 2 4.7 13 1.6 552 550 2 4.1 12 1.4 550 548 2 4.9 13 1.4 552 550 2 4.8 10 1.0 556 554 2 3.3 15 1.2 533 531 2 4.7 10 1.1 548 547 1 4.1 15 1.4 548 547 1 4.7 16 1.2 556 555 1 4.2 21 1.4 551 551 0 4.9 12 1.7 549 549 0 3.4 14 1.2 554 554 0 4.2 14 0.9 555 555 0 5.3 10 1.8 547 547 0 4.9 12 1.2 551 551 0 4.8 14 1.4 546 546 0 4.8 22 1.4 567 567 0 3.8 9 1.4 550 550 0 4.5 23 1.4 556 556 0 4.1 10 1.3 543 544 -1 3.6 10 1.3 544 545 -1 4.4 46 1.8 563 564 -1 4.9 15 1.4 547 548 -1 5.5 12 1.0 560 561 -1 4.8 23 1.3 532 537 -5 In a study that compared elevations from five mapp- ing-grade Trimble GPS receivers with surveyed bench- mark elevations [7], average absolute vertical errors of post-processed data among the receivers ranged from 0.8 m to 1.9 m. The greatest effect on vertical error was can- opy coverage. Vertical error of post-processed data was 0.2 m under open sky, 0.4 m under 50% canopy, and 3.3 m under 100% canopy. While the vertical error in our study was larger at 6 m, the two studies are not directly com- parable. 4. Conclusions Results indicate that, under conditions specific to this study,  L. C. KISER ET AL. Copyright © 2010 SciRes. JGIS 151 although GPS elevation was overestimated compared to DEM-derived elevation, the relationship among these data sources was predictable and followed a well defined linear relationship. While the magnitude of the elevation difference among the two data sources was large for some of the data points, the strong linear relationship allows for correction of elevation values in a predictable manner. More generically, the results of this analysis indicate that potential differences in GPS and DEM derived elevation estimates will need to be considered when elevation re- lated environmental attributes are analyzed and extrapo- lated spatially. 5. References [1] M. G. Wing, A. Eklund and L. D. Kellogg, “Consumer- Grade Global Positioning System (GPS) Accuracy and Reliability,” Journal of Forestry, Vol. 103, No. 4, June 2005, pp. 169-173. [2] M. G. Wing and R. Karsky, “Standard and Real-Time Accuracy and Reliability of a Mapping-Grade GPS in a Coniferous Western Oregon Forest,” Western Journal of Applied Forestry, Vol. 21, No. 4, October 2006, pp. 222-227. [3] M. G. Wing and A. Eklund, “Performance Comparison of a Low-Cost Mapping Grade Global Positioning Systems (GPS) Receiver and Consumer Grade GPS Receiver un- der Dense Forest Canopy,” Journal of Forestry, Vol. 105, No. 1, January/February 2007, pp. 9-14. [4] M. G. Wing, A. Eklund, J. Sessions and R. Karsky, “Horizontal Measurement Performance of Five Mapping- Grade Global Positioning System Receiver Configura- tions in Several Forested Setting,” Western Journal of Applied Forestry, Vol. 23, No. 3, July 2008, pp. 166-171. [5] L. C. Kiser, J. M. Kelly and P. A. Mays, “Changes in Fo- Rest Soil Carbon and Nitrogen after a Thirty-Year Inter- val,” Soil Science Society of America Journal, Vol. 73, No. 1, February 2009, pp. 647-653. [6] J. M. Kelly, “Camp Branch and Cross Creek Experimen- tal Watershed Projects,” Report Nos. TVA/ONR-79/04, EPA-600/7-79- 053, 1979. [7] M. G. Wing and A. Eklund, “Vertical Measurement Ac- curacy of Mapping-Grade Global Positioning Systems Receivers in Three Forest Setting,” Western Journal of Applied Forestry, Vol. 23, No. 2, April 2008, pp. 83-88. |