 Open Journal of Soil Science, 2012, 2, 234-241 http://dx.doi.org/10.4236/ojss.2012.23028 Published Online September 2012 (http://www.SciRP.org/journal/ojss) Phosphate Des orption Characteristi c s o f Some Representative Soils of Bangladesh: Effect of Exchangeable Anions, Water Molecules and Solution to Soil Ratios Mohammad Z. Afsar1*, Sirajul Hoque2, Khan Towhid Osman1 1Department of Soil Science, Faculty of Biological Sciences, University of Chittagong, Chittagong, Bangladesh; 2Department of Soil, Water and Environment, Faculty of Biological Sciences, University of Dhaka, Dhaka, Bangladesh. Email: *zafarbd_1982@yahoo.com Received June 27th, 2012; revised August 28th, 2012; accepted September 10th, 2012 ABSTRACT Establishment of phosphate (P) retention and release capacity of soils is essential for effective nutrient management and environmental protection. In this experiment, we studied the influence of soil properties on P desorption and the rela- tionship between phosphate sorption and desorption. Among the soil series, the Ghior soil had the highest percent clay (59.32%) and free iron oxide (15,241 mg·kg−1) content. Along the catena of the calcareous soils, percent clay contents increased. For sorption study, the soils were equilibrated with 0.01 M CaCl2 solution containing 0, 1, 2, 4, 8, 16, 25, 50, 100 and 150 mg·P·L−1 solution. For desorption, three extractants namely, 2 4 SO (0.005 M) as Na2SO4, 3 HCO (0.01 M) as NaHCO3 and distilled water were used at extractant to soil ratios of 30:1, 60:1 and 100:1 (v/w). Among the sorp- tion equations, the Langmuir equation showed better fit to the sorption data at higher P concentrations. The amount of phosphate desorbed by all the three extractants increased significantly with the increasing extractant to soil ratios. Phosphate desorption by 2 4 SO and water molecules was highly correlated with pH, percent clay and free iron oxide content of the soil. Significant positive correlation (r > 0.64, P < 0.05) was observed between the amount of phosphate desorption and phosphate sorption maximum (bL). Phosphate desorption by 2 4 SO and water molecules was also posi- tively correlated with Freundlich constant, N (r > 0.67, P < 0.05) and EPC0 (r > 0.72, P < 0.05). On the other hand, a significant negative correlation (r > –0.77, P < 0.05) was observed between phosphate desorption and phosphate bind- ing strength (KL). The results suggest that freshly sorbed phosphate ions (inner-sphere complex forming species) can be readily desobed by outer-sphere complex forming species like sulphate and bicarbonate ions. Water molecules also de- sorbed significant amount of freshly sorbed phosphate from the soil colloids. Keywords: Phosphate Sorption; Extractant to Soil Ratio; Surface Complexation of Anions; Labile Forms of P; Phosphate Desorption 1. Introduction Phosphorus (P) is the second most important nutrient, next to nitrogen (N) that has often been found limiting biological productivity in terrestrial environments and as well as in surface water environments. Management of phosphate fertilization is essential for maintaining the concentration of biologically available soil-P at a value adequate for plant growth, while minimizing the move- ment of dissolved-P and particulate-P to surface water and shallow groundwater. Soils also have a defined ca- pacity to adsorb phosphorus and there will be a great possibility to release excess P into the surface or ground water when a critical P sorption saturation level is at- tained [1]. It is, therefore, crucial to predict the partition- ing of applied P fertilizer between soil solid phase and soil solution which can be achieved by studying the P sorption-desorption behavior of soil. Phosphate sorption plays an important role in environmental aspects of P management. Batch incubation studies are generally used to estimate P sorption capacity of soil. The capacity of soil to retain added P is often described by simple adsor- ption equations, which relate P concentration in solution to the amount of P retained by the soil [2]. The most popular mathematical models used to describe P sorption are the Langmuir and Freundlich equations [3]. Temkin equation is also used to describe phosphate sorption in soil [4]. Phosphate (24 HPO ), bicarbonate () and sul- 3 HCO *Corresponding author. Copyright © 2012 SciRes. OJSS  Phosphate Desorption Characteristics of Some Representative Soils of Bangladesh: Effect of Exchangeable Anions, Water Molecules and Solution to Soil Ratios 235 phate () are three important adsorptive, nonpoly- meric anions that are present in soil solution. The mecha- nisms by which these anions are adsorbed to the colloid particles are surface complexation and diffuse-ion swarm association. Outer-sphere complexation of anions involves coordination to a protonated hydroxyl or amino group or to a surface metal cation. On the other hand, inner-sphere surface complexation of anions involves coordination to created or native Lewis acid sites. The anions like bicar- bonate (3) and sulphate () are considered to be adsorbed mainly as outer-sphere complex species. These ions are readily exchangeable and often exhibit a negative surface excess in permanent-charge soils. In contrast, phosphate (24 ) is considered to be adsorbed principally as inner-sphere complex species [5]. When the orthophosphate ion is bonded through one Al-O-P bond (a single coordinate linkage), the ion is considered labile and the adsorption is said to be reversible. This orthophosphate ion can be readily desorbed from the mineral surface to soil solution [6,7]. 2 4 SO HCO2 4 SO HPO Phosphate desorption in soil can be enhanced by in- creasing the negative charge on the surface of soil parti- cles either by raising the solution pH, or by introducing a competitive anion. These competitive ions will increase the negative charge of the soil in the presence of P. Un- equal ion distribution in the charged colloid surfaces, surrounded by diffuse double layer (DDL), causes anion repulsion or negative adsorption. The negative adsorption is governed by 1) anion charge and concentration, 2) spe- cies of exchangeable cation, 3) pH, 4) presence of other anions and 5) nature and charge of the colloid surface [8]. In a freshly phosphate sorbed soil, addition of bicarbon- ate and sulphate ions may have some influence on phos- phate desorption. The rate of phosphate desorption has also been found to be largely a function of the solution to soil ratio. Dur- ing a P desorption event, if the solution to soil ratio in- creases, for example because of an increase in soil water content or in the amount of runoff, P will desorb from the soil to maintain an equilibrium between the soil sorbed P and the solution P. Phosphate desorption in a poorly buf- fered soil is more influenced by changes in solution to soil ratios [9-11]. However, varying the solution to soil ratio has produced conflicting results in regard to the amount of P extracted. Some scientists [12] reported that adsorption was least with a small solution to soil ratio. Whereas, other scientists [13] found that adsorption was smallest with a large solution to soil ratio. Soil properties affecting the P adsorption capacity are soil texture [14], organic matter [15], oxides of iron and aluminium [16], soil pH [17] and CaCO3 content [18]. Even in calcareous soils, hydrous oxides are important for adsorption of P [19]. The objectives of this experiment were, therefore, to 1) estimate phosphate desorption pattern of soils as con- trolled by different soil extractants at different extractant to soil ratios, 2) study the effects of different soil proper- ties on phosphate desorption and 3) identify the relation- ship between different phosphate sorption parameters and phosphate desorption. 2. Materials and Methods 2.1. Soil Series In the present study, five non-calcareous and three cal- careous soil series were studied. The Baliadangi series (Eutric Cambisol) of Old Himalayan Piedmont Plain, the Gongachara series (Eutric Fluvisol) of Tista Meander Floodplain, the Lockdeo (Eutric Fluvisol), the Silmandi (Eutric Fluvisol) and the Ghatail series (Eutric Fluvisol) of Old Brahmaputra Floodplain are non-calcareous soils. On the other hand, the Gopalpur (Calcaric Fluvisol), the Ishurdi (Calcaric Fluvisol), and the Ghior (Calcaric Flu- visol) series of Low Ganges River Floodplain are cal- careous in their origin. The soils are grouped according to the World reference base for soil resources 2006 [20]. The three calcareous soil series comprised a catena, with the Gopalpur and the Ghior soil series being located at the highest and the lowest elevation, respectively. 2.2. Soil Sample Collection Soil samples at a depth of 0 - 15 cm were collected from 20 spots from a square area of ~1 km2 under a soil series. Approximately equal amounts (on weight basis) of these samples were mixed together to form a composite sample. The soils were then air dried at room temperature (25˚C ± 2˚C) for 7 days, ground and passed through a 2 mm sieve. 2.3. Analysis The soil samples were analyzed for particle size analysis, pH, Olsen-P, Total P, organic matter, free carbonate and fractions of iron. Particle size analysis was done by Bouyoucos hydrometer method [21]. Soil organic matter content was calculated by multiplying the percent or- ganic carbon by the conversion factor of 1.724. Soil or- ganic carbon was determined by Walkley-Black’s wet oxidation with 1N K2Cr2O7 method [22]. Soil pH was determined at soil to water ratio of 1:2.5. Total P content of the soil was determined after digestion with HNO3- HClO4 mixture [23]. Olsen-P was extracted by 0.5 M NaHCO3 at pH 8.5 [24]. Subsequent P determination was carried out by following ascorbic acid blue color method [25]. Free carbonate contents of the calcareous soil sam- ples were determined by following rapid titration method. Copyright © 2012 SciRes. OJSS  Phosphate Desorption Characteristics of Some Representative Soils of Bangladesh: Effect of Exchangeable Anions, Water Molecules and Solution to Soil Ratios 236 1M HCl solution was used at soil to extractant ratio of 1:20 [26]. For the determination of free iron oxide con- tent, 0.5 g soil was transferred to a centrifuge tube. Then 0.5 g Na2S2O4 and 6.0 g Na-citrate and 30 ml deionized water was added. The tubes were shaken for 16 hours [27]. Ammonium oxalate (pH 3.0) was used to determine “Active” or “Amorphous” iron oxides. The tubes were shaken for 2 hours. In case of calcareous soils, 1M NH4- acetate (pH 5.5) solution was added and shaken for an hour [28]. Sodium pyrophosphate extractant (pH 10) was used for the estimation of organically bound Fe [29]. Iron was determined colorimetrically by reduction of Fe with hydroxylamine hydrochloride and reaction with 1,10- phenanthroline to form the tris (1,10-phenanthroline) Fe(II) complex, which had a red color [30]. All determi- nations were done in triplicate. 2.4. Phosphate Sorption Procedures One gram soil sample was equilibrated in a centrifuge tube with 20 mL 0.01 M CaCl2 solution containing 0, 1, 2, 4, 8, 16, 25, 50, 100 and 150 mg·P·L−1 (equivalent to 0, 20, 40, 80, 160, 320, 500, 1000, 2000, and 3000 mg·P·kg−1 soil) as KH2PO4. Then the soil samples were incubated at room temperature (25˚C ± 2˚C) for 3 days [31]. The samples were then centrifuged at 4500 rpm for 15 minutes and filtered through Whatmanfilter paper No. 42. The P in solution was determined colorimetrically by the molybdate blue colour method [25]. The data were then plotted according to the Langmuir, Freundlich and Temkin equations. Linear form of the Langmuir equation is C/X = 1/KLbL + C/bL [32] (1) X = amount of P sorbed (mg·kg−1), C = equilibrium P concentration (mg·L−1) in solution, bL = adsorption maxi- mum (mg·P·kg−1), KL = bonding energy constant (L·mg−1·P). A plot of C/X (y-axis variable) against C (x-axis variable) will yield a straight line with a slope of 1/bL and a y-intercept of 1/KLbL. Freundlich equation is X = KfCN [33] Logarithmic form of the Freundlich Equation is logX = logKf + N logC (2) X = amount of P sorbed (mg·kg−1), C = equilibrium P concentration (mg·L−1) in solution, Kf = proportionality constant (mg·kg−1), N = empirical constant related to bonding energy of soil for phosphate. A plot of logX (y-axis variable) against logC (x-axis variable) will yield a straight line with slope N and a y-intercept of log Kf. Temkin equation is X = a + blogC [4] (3) X = amount of P sorbed (mg·kg−1), C = equilibrium P concentration (mg·L−1) in solution, a and b are constants. A plot of X (y-axis variable) against logC (x-axis vari- able) will yield a straight line with slope b and y-inter- cept a. The fitted Temkin equation is used to determine the equilibrium P concentration (EPC0) for each of the soils, by determining the value of X when C equaled ze- ro. 2.5. Phosphorus Desorption Procedures Initially soil samples were sorbed with 100 mg·P·L−1 as KH2PO4 at room temperature (25˚C ± 2˚C) for 3 days prior to the desorption study. The soil suspension was filtered and the residue was washed with 10 mL distilled water for two times to remove excess phosphate ions, which were not sorbed by the soil samples. Then the soil samples were air-dried (25˚C ± 2˚C) for a week and were preserved for desorption studies. Phosphate sorbed soil samples and extractants were taken in centrifuge tubes at extractant to soil ratios of 30:1, 60:1 and 100:1 (v/w).Three extractants namely, 0.005 M 2 4 SO as Na2SO4, 0.01 M 3 as NaHCO3 and distilled water (H2O) were used. All determinations were done in triplicate. The contents were shaken on a horizontal shaker for 180 minutes. The samples were then centrifuged at 4500 rpm for 15 minutes and filtered through Whatmanfilter paper No. 42. The P in solution was determined colorimetrically by the molybdate blue colour method [25]. HCO 2.6. Statistical Analysis The incubation experiment was arranged in the labora- tory according to a factorial combination. The factors were soil series, extractants and extractant to soil ratios. Analysis of variance (ANOVA) and correlation analyses were performed by using SPSS-16 statistical software. 3. Results 3.1. Physical and Chemical Properties of the Soils The soils are representative of the major soil types in Bangladesh and exhibit a wide range of properties (Ta- ble 1). The pH of the soils ranged from 5.33 to 7.65 with an average value of 6.4. The percent clay content of the soils varied from 20.30 to 59.32, with the Lokdeo and the Ghior soil series having the smallest and the largest val- ues, respectively. Organic matter content of the soils ranged between 1.55 and 3.77%. The Olsen-P content varied from 21.25 to 63.70 mg·kg−1 soil. Among the three fractions of iron, free iron oxide ranged from 3524 - 15,241, amorphous iron oxide from 1131 - 4260 and or- ganically bound iron from 707 - 1965 mg·kg−1 soil. Copyright © 2012 SciRes. OJSS  Phosphate Desorption Characteristics of Some Representative Soils of Bangladesh: Effect of Exchangeable Anions, Water Molecules and Solution to Soil Ratios Copyright © 2012 SciRes. OJSS 237 Table 1. Selected physical and chemical properties of the soil samples. Soil series % Clay pH OM1 (%) Total P (%) Olsen P (mg·kg−1) Free Carbonate (%) Free Iron Oxide (mg·kg−1) Amorphous Iron (mg·kg−1) Organically Bound Iron (mg·kg−1) Baliadangi 27.95 f 5.53 f 3.77a 0.070d50.92b - 6254e 1131 h 1275c Gangachara 35.30 d 5.33 g 2.49 c 0.071d63.70 a - 5648f 1749 f 1689b Lokdeo 20.30g 5.68 e 1.55 g 0.068d27.40ef - 3524h 1861 e 1241d Silmandi 29.50 ef 5.68 e 1.89 e 0.074d45.66c - 4528g 3267 c 965f Ghatail 41.20 c 6.83 d 2.75 b 0.084c21.25g - 8654c 4260 a 1206e Gopalpur 31.50 e 7.29 b 2.73 b 0.141a29.91de 3.85 6354d 1557 g 779g Ishurdi 45.20b 7.07 c 2.33 d 0.134a23.74f 5.78 10524b 2647 d 707h Ghior 59.32a 7.65a 1.78 f 0.124b33.33d 4.02 15241a 3350 b 1965a 1OM = organic matter; The values followed by the same letter(s) in a column(s) are not statistically different at P < 0.05. 3.2. Phosphate Sorption Behavior The P sorption in soil increased with the increasing levels of P added to the soil. At equilibrium-solution concentra- tion of P below 1.0 mg·L−1, the relationship was appro- ximately linear for most soils. While at higher equili- brium P concentrations, deviation from the linearity was observed. The linear part of the relationship was proba- bly due to the large intermolecular distance between P molecules, which resulted in negligible mutual repulsion [34,35]. Among the non-calcareous soils, the Baliadangi soil was more retentive than the other four soils. The Ghior soil series, which was present at the bottom of the catena of Lower Ganges Floodplain, was more retentive than the other two calcareous soils and it also sorbed more than any of the non-calcareous soils. The Gopalpur series, located at the highest elevation in the catena sorbed the least amount of phosphate, while the Ishurdi soil was intermediate in its sorption properties. The phosphate sorption data were plotted and the dif- ferent sorption parameters were calculated according to the Freundlich, Langmuir and Temkin equations (Table 2). The Langmuir sorption maxima (bL) of the soil ranged from 416 to 1000 mg·kg−1 and the binding energy constant varied from 0.08 to 0.25. The N values of Freundlich equation were between 0.39 and 0.59 L·kg−1. The EPC0 values varied from 0.05 to 0.26. The Ghior soil series, which had the highest clay and free iron oxide contents, also had the largest values of N, bL and EPC0. 3.3. Phosphate Desorption Behavior The amount of phosphate desorbed by different extrac- tants increased with the increasing extractant to soil ra- tios (Table 3). Among the three extractants, 0.01 M 3 extracted the greatest percentage of the sorbed phosphate from the soils. In the non-calcareous soils, 0.01 M 3 HC HCO O removed 27.44% and 55.14% of the sorbed P at the smallest and the largest extractant to soil ratios. In contrast, 0.005 M and distilled water desorbed only 15.24% and 18.36% of the sorbed P at the smallest extractant to soil ratios, respectively. The re- spective values at the largest extractant to soil ratio were 29.05% and 28.11%. Similar desorption patterns were also observed in calcareous soils. Among the calcareous soils, the maximum phosphate desorption was observed in the Ishurdi soil series, where the P desorption was in- creased from 29.03% to 51.33%, 32.48% to 56.64% and 31.78% to 51.23% with the increasing extractant to soil ratios by 0.005 M 2 4 SO 2 4 SO , 0.01 M and distilled water, respectively. 3 HCO HC To determine whether the variations in the phosphate desorption due to different factors were significant or not, analysis of variance (ANOVA) was done taking into ac- count the soil series, types of extractants and the extrac- tant to soil ratios as the sources of variation (Table 4). Among the three extractants, 0.01 M 3 O desorbed significantly higher amount of phosphate (P < 0.001) than the other two extractants. Significant variations (P < 0.001) were also observed among the amounts of P de- sorbed at the three extractant to soil ratios. The studied soil series were also significantly (P < 0.001) varied in their phosphate desorption capacity. We evaluated the relationship between the phosphate desorption data and selected soil properties (Table 5) to get information about main soil properties responsible for phosphate desorption. The amounts of phosphate de- sorbed by both 2 4 SO and distilled water were signifi- cantly correlated with pH, % clay and free iron oxide content of the soils (r > 0.66, P < 0.05). However, for 3 HCO , no relationship was observed. In a previous study [34], the phosphate sorption capacity of soils was observed to be highly correlated with % clay and free 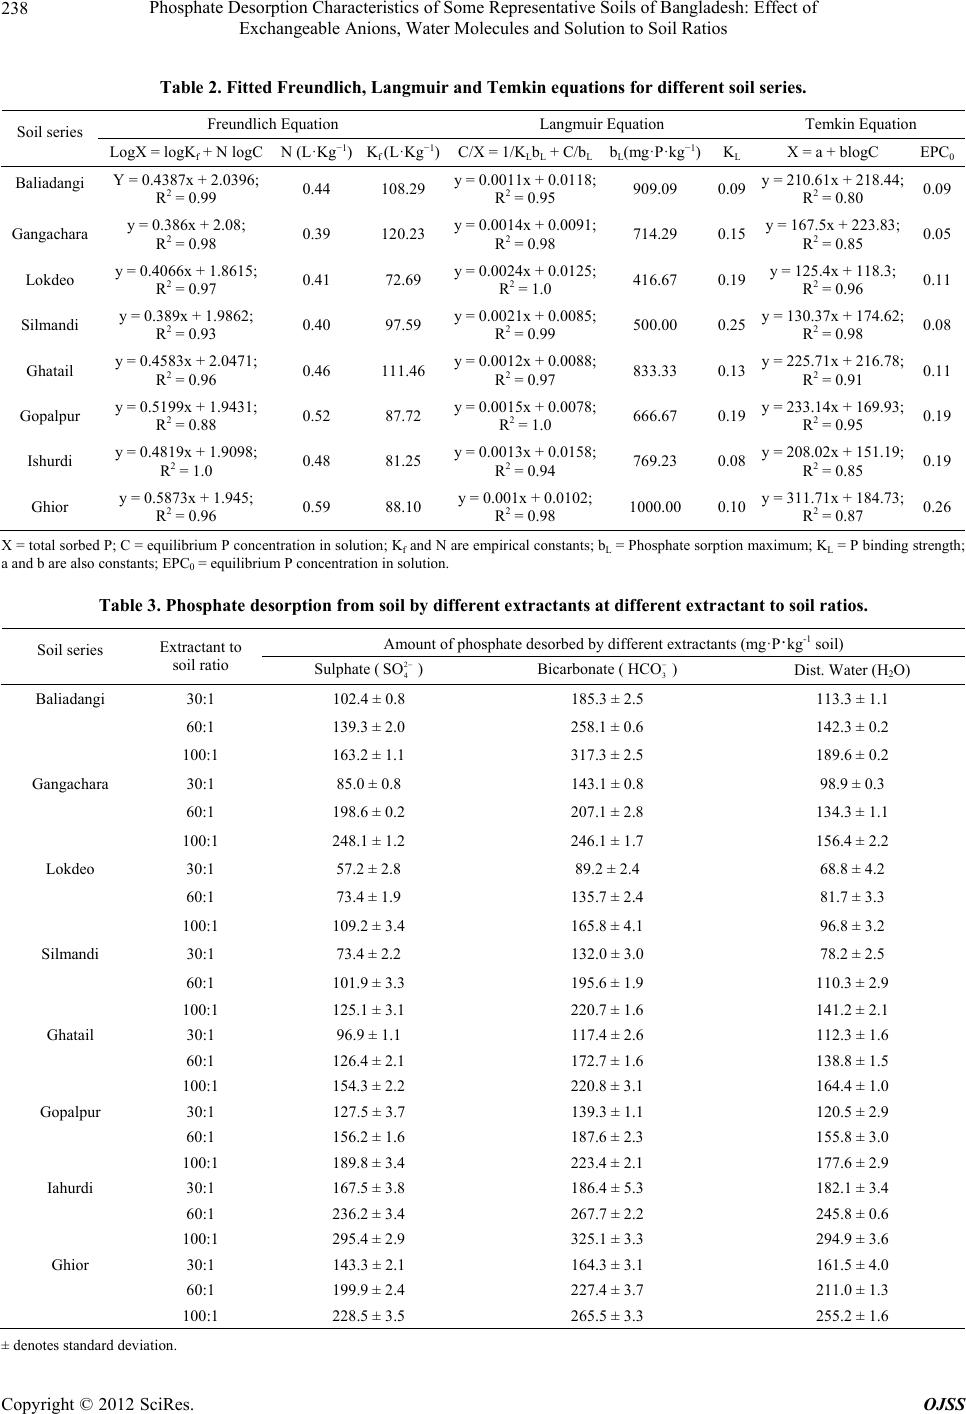 Phosphate Desorption Characteristics of Some Representative Soils of Bangladesh: Effect of Exchangeable Anions, Water Molecules and Solution to Soil Ratios 238 Table 2. Fitted Freundlich, Langmuir and Temkin equations for different soil series. Freundlich Equation Langmuir Equation Temkin Equation Soil series LogX = logKf + N logC N (L·Kg−1) Kf (L·Kg−1)C/X = 1/K LbL + C/bLbL(mg·P·kg−1)K L X = a + blogC EPC0 Baliadangi Y = 0.4387x + 2.0396; R2 = 0.99 0.44 108.29 y = 0.0011x + 0.0118; R2 = 0.95 909.09 0.09 y = 210.61x + 218.44; R2 = 0.80 0.09 Gangachara y = 0.386x + 2.08; R2 = 0.98 0.39 120.23 y = 0.0014x + 0.0091; R2 = 0.98 714.29 0.15 y = 167.5x + 223.83; R2 = 0.85 0.05 Lokdeo y = 0.4066x + 1.8615; R2 = 0.97 0.41 72.69 y = 0.0024x + 0.0125; R2 = 1.0 416.67 0.19 y = 125.4x + 118.3; R2 = 0.96 0.11 Silmandi y = 0.389x + 1.9862; R2 = 0.93 0.40 97.59 y = 0.0021x + 0.0085; R2 = 0.99 500.00 0.25 y = 130.37x + 174.62; R2 = 0.98 0.08 Ghatail y = 0.4583x + 2.0471; R2 = 0.96 0.46 111.46 y = 0.0012x + 0.0088; R2 = 0.97 833.33 0.13 y = 225.71x + 216.78; R2 = 0.91 0.11 Gopalpur y = 0.5199x + 1.9431; R2 = 0.88 0.52 87.72 y = 0.0015x + 0.0078; R2 = 1.0 666.67 0.19 y = 233.14x + 169.93; R2 = 0.95 0.19 Ishurdi y = 0.4819x + 1.9098; R2 = 1.0 0.48 81.25 y = 0.0013x + 0.0158; R2 = 0.94 769.23 0.08 y = 208.02x + 151.19; R2 = 0.85 0.19 Ghior y = 0.5873x + 1.945; R2 = 0.96 0.59 88.10 y = 0.001x + 0.0102; R2 = 0.98 1000.00 0.10 y = 311.71x + 184.73; R2 = 0.87 0.26 X = total sorbed P; C = equilibrium P concentration in solution; Kf and N are empirical constants; bL = Phosphate sorption maximum; KL = P binding strength; a and b are also constants; EPC0 = equilibrium P concentration in solution. Table 3. Phosphate desorption from soil by different extractants at different extractant to soil ratios. Amount of phosphate desorbed by different extractants (mg·P·kg-1 soil) Soil series Extractant to soil ratio Sulphate (2 4 SO ) Bicarbonate (3 HCO ) Dist. Water (H2O) Baliadangi 30:1 102.4 ± 0.8 185.3 ± 2.5 113.3 ± 1.1 60:1 139.3 ± 2.0 258.1 ± 0.6 142.3 ± 0.2 100:1 163.2 ± 1.1 317.3 ± 2.5 189.6 ± 0.2 Gangachara 30:1 85.0 ± 0.8 143.1 ± 0.8 98.9 ± 0.3 60:1 198.6 ± 0.2 207.1 ± 2.8 134.3 ± 1.1 100:1 248.1 ± 1.2 246.1 ± 1.7 156.4 ± 2.2 Lokdeo 30:1 57.2 ± 2.8 89.2 ± 2.4 68.8 ± 4.2 60:1 73.4 ± 1.9 135.7 ± 2.4 81.7 ± 3.3 100:1 109.2 ± 3.4 165.8 ± 4.1 96.8 ± 3.2 Silmandi 30:1 73.4 ± 2.2 132.0 ± 3.0 78.2 ± 2.5 60:1 101.9 ± 3.3 195.6 ± 1.9 110.3 ± 2.9 100:1 125.1 ± 3.1 220.7 ± 1.6 141.2 ± 2.1 Ghatail 30:1 96.9 ± 1.1 117.4 ± 2.6 112.3 ± 1.6 60:1 126.4 ± 2.1 172.7 ± 1.6 138.8 ± 1.5 100:1 154.3 ± 2.2 220.8 ± 3.1 164.4 ± 1.0 Gopalpur 30:1 127.5 ± 3.7 139.3 ± 1.1 120.5 ± 2.9 60:1 156.2 ± 1.6 187.6 ± 2.3 155.8 ± 3.0 100:1 189.8 ± 3.4 223.4 ± 2.1 177.6 ± 2.9 Iahurdi 30:1 167.5 ± 3.8 186.4 ± 5.3 182.1 ± 3.4 60:1 236.2 ± 3.4 267.7 ± 2.2 245.8 ± 0.6 100:1 295.4 ± 2.9 325.1 ± 3.3 294.9 ± 3.6 Ghior 30:1 143.3 ± 2.1 164.3 ± 3.1 161.5 ± 4.0 60:1 199.9 ± 2.4 227.4 ± 3.7 211.0 ± 1.3 100:1 228.5 ± 3.5 265.5 ± 3.3 255.2 ± 1.6 ± denotes standard deviation. Copyright © 2012 SciRes. OJSS 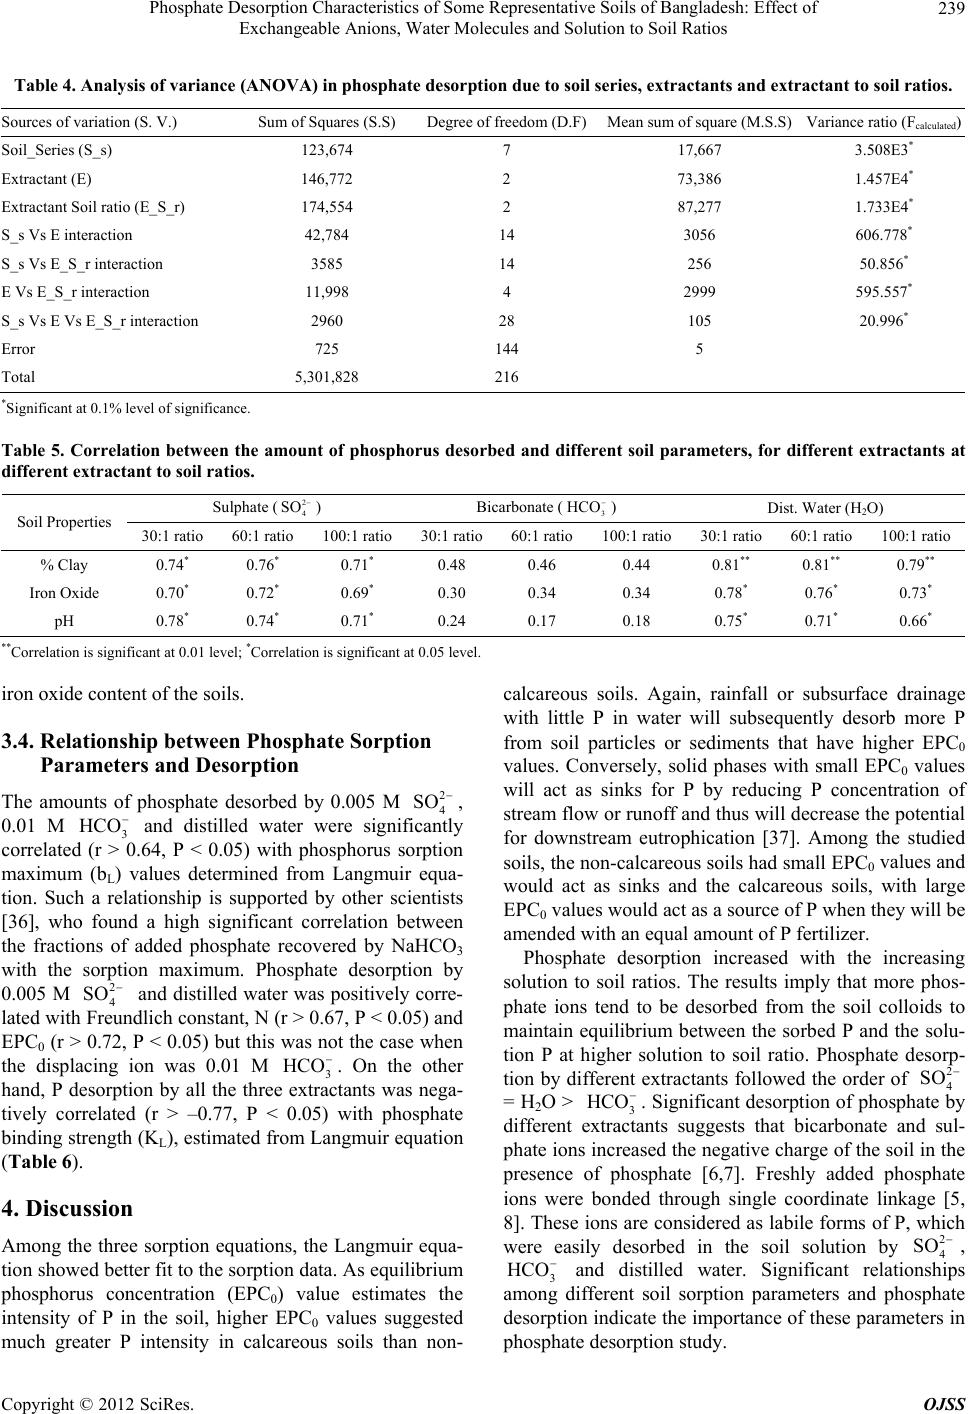 Phosphate Desorption Characteristics of Some Representative Soils of Bangladesh: Effect of Exchangeable Anions, Water Molecules and Solution to Soil Ratios 239 Table 4. Analysis of variance (ANOVA) in phosphate desorption due to soil series, extractants and e xtr ac tant to soil ratios. Sources of variation (S. V.) Sum of Squares (S.S) Degree of freedom (D.F)Mean sum of square (M.S.S) Variance ratio (Fcalculated) Soil_Series (S_s) 123,674 7 17,667 3.508E3* Extractant (E) 146,772 2 73,386 1.457E4* Extractant Soil ratio (E_S_r) 174,554 2 87,277 1.733E4* S_s Vs E interaction 42,784 14 3056 606.778* S_s Vs E_S_r interaction 3585 14 256 50.856* E Vs E_S_r interaction 11,998 4 2999 595.557* S_s Vs E Vs E_S_r interaction 2960 28 105 20.996* Error 725 144 5 Total 5,301,828 216 *Significant at 0.1% level of significance. Table 5. Correlation between the amount of phosphorus desorbed and different soil parameters, for different extractants at different extractant to soil ratios. Sulphate () 2 4 SO Bicarbonate (3 HCO ) Dist. Water (H2O) Soil Properties 30:1 ratio 60:1 ratio 100:1 ratio30:1 ratio60:1 ratio100:1 ratio30:1 ratio 60:1 ratio 100:1 ratio % Clay 0.74* 0.76* 0.71* 0.48 0.46 0.44 0.81** 0.81** 0.79** Iron Oxide 0.70* 0.72* 0.69* 0.30 0.34 0.34 0.78* 0.76* 0.73* pH 0.78* 0.74* 0.71* 0.24 0.17 0.18 0.75* 0.71* 0.66* **Correlation is significant at 0.01 level; *Correlation is significant at 0.05 level. iron oxide content of the soils. 3.4. Relationship between Phosphate Sorption Parameters and Desorption The amounts of phosphate desorbed by 0.005 M 2 4 SO , 0.01 M 3 and distilled water were significantly correlated (r > 0.64, P < 0.05) with phosphorus sorption maximum (bL) values determined from Langmuir equa- tion. Such a relationship is supported by other scientists [36], who found a high significant correlation between the fractions of added phosphate recovered by NaHCO3 with the sorption maximum. Phosphate desorption by 0.005 M and distilled water was positively corre- lated with Freundlich constant, N (r > 0.67, P < 0.05) and EPC0 (r > 0.72, P < 0.05) but this was not the case when the displacing ion was 0.01 M 3. On the other hand, P desorption by all the three extractants was nega- tively correlated (r > –0.77, P < 0.05) with phosphate binding strength (KL), estimated from Langmuir equation (Table 6). HCO 2 4 SO HCO 4. Discussion Among the three sorption equations, the Langmuir equa- tion showed better fit to the sorption data. As equilibrium phosphorus concentration (EPC0) value estimates the intensity of P in the soil, higher EPC0 values suggested much greater P intensity in calcareous soils than non- calcareous soils. Again, rainfall or subsurface drainage with little P in water will subsequently desorb more P from soil particles or sediments that have higher EPC0 values. Conversely, solid phases with small EPC0 values will act as sinks for P by reducing P concentration of stream flow or runoff and thus will decrease the potential for downstream eutrophication [37]. Among the studied soils, the non-calcareous soils had small EPC0 values and would act as sinks and the calcareous soils, with large EPC0 values would act as a source of P when they will be amended with an equal amount of P fertilizer. Phosphate desorption increased with the increasing solution to soil ratios. The results imply that more phos- phate ions tend to be desorbed from the soil colloids to maintain equilibrium between the sorbed P and the solu- tion P at higher solution to soil ratio. Phosphate desorp- tion by different extractants followed the order of 2 4 SO = H2O > 3 HCO . Significant desorption of phosphate by different extractants suggests that bicarbonate and sul- phate ions increased the negative charge of the soil in the presence of phosphate [6,7]. Freshly added phosphate ions were bonded through single coordinate linkage [5, 8]. These ions are considered as labile forms of P, which were easily desorbed in the soil solution by 2 4 SO , 3 HCO and distilled water. Significant relationships among different soil sorption parameters and phosphate desorption indicate the importance of these parameters in phosphate desorption study. Copyright © 2012 SciRes. OJSS 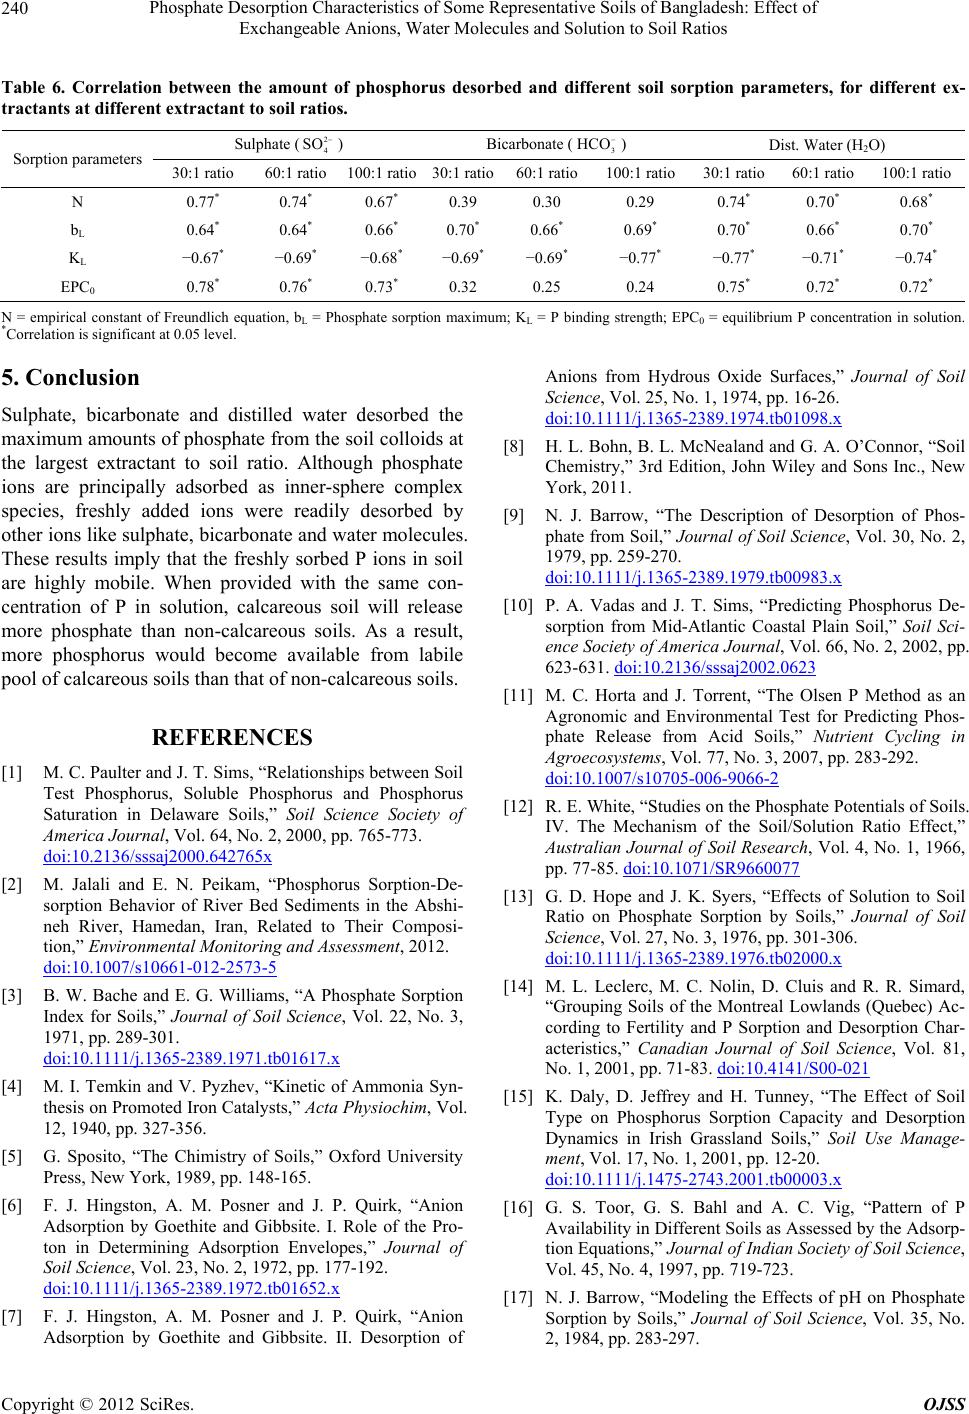 Phosphate Desorption Characteristics of Some Representative Soils of Bangladesh: Effect of Exchangeable Anions, Water Molecules and Solution to Soil Ratios 240 Table 6. Correlation between the amount of phosphorus desorbed and different soil sorption parameters, for different ex- tractants at different extractant to soil ratios. Sulphate () 2 4 SO Bicarbonate (3 HCO ) Dist. Water (H2O) Sorption parameters 30:1 ratio 60:1 ratio 100:1 ratio30:1 ratio60:1 ratio100:1 ratio30:1 ratio 60:1 ratio 100:1 ratio N 0.77* 0.74* 0.67* 0.39 0.30 0.29 0.74* 0.70* 0.68* bL 0.64* 0.64* 0.66* 0.70* 0.66* 0.69* 0.70* 0.66* 0.70* KL −0.67* −0.69* −0.68* −0.69* −0.69* −0.77* −0.77* −0.71* −0.74* EPC0 0.78* 0.76* 0.73* 0.32 0.25 0.24 0.75* 0.72* 0.72* N = empirical constant of Freundlich equation, bL = Phosphate sorption maximum; KL = P binding strength; EPC0 = equilibrium P concentration in solution. *Correlation is significant at 0.05 level. 5. Conclusion Sulphate, bicarbonate and distilled water desorbed the maximum amounts of phosphate from the soil colloids at the largest extractant to soil ratio. Although phosphate ions are principally adsorbed as inner-sphere complex species, freshly added ions were readily desorbed by other ions like sulphate, bicarbonate and water molecules. These results imply that the freshly sorbed P ions in soil are highly mobile. When provided with the same con- centration of P in solution, calcareous soil will release more phosphate than non-calcareous soils. As a result, more phosphorus would become available from labile pool of calcareous soils than that of non-calcareous soils. REFERENCES [1] M. C. Paulter and J. T. Sims, “Relationships between Soil Test Phosphorus, Soluble Phosphorus and Phosphorus Saturation in Delaware Soils,” Soil Science Society of America Journal, Vol. 64, No. 2, 2000, pp. 765-773. doi:10.2136/sssaj2000.642765x [2] M. Jalali and E. N. Peikam, “Phosphorus Sorption-De- sorption Behavior of River Bed Sediments in the Abshi- neh River, Hamedan, Iran, Related to Their Composi- tion,” Environmental Monitoring and Assessment, 2012. doi:10.1007/s10661-012-2573-5 [3] B. W. Bache and E. G. Williams, “A Phosphate Sorption Index for Soils,” Journal of Soil Science, Vol. 22, No. 3, 1971, pp. 289-301. doi:10.1111/j.1365-2389.1971.tb01617.x [4] M. I. Temkin and V. Pyzhev, “Kinetic of Ammonia Syn- thesis on Promoted Iron Catalysts,” Acta Physiochim, Vol. 12, 1940, pp. 327-356. [5] G. Sposito, “The Chimistry of Soils,” Oxford University Press, New York, 1989, pp. 148-165. [6] F. J. Hingston, A. M. Posner and J. P. Quirk, “Anion Adsorption by Goethite and Gibbsite. I. Role of the Pro- ton in Determining Adsorption Envelopes,” Journal of Soil Science, Vol. 23, No. 2, 1972, pp. 177-192. doi:10.1111/j.1365-2389.1972.tb01652.x [7] F. J. Hingston, A. M. Posner and J. P. Quirk, “Anion Adsorption by Goethite and Gibbsite. II. Desorption of Anions from Hydrous Oxide Surfaces,” Journal of Soil Science, Vol. 25, No. 1, 1974, pp. 16-26. doi:10.1111/j.1365-2389.1974.tb01098.x [8] H. L. Bohn, B. L. McNealand and G. A. O’Connor, “Soil Chemistry,” 3rd Edition, John Wiley and Sons Inc., New York, 2011. [9] N. J. Barrow, “The Description of Desorption of Phos- phate from Soil,” Journal of Soil Science, Vol. 30, No. 2, 1979, pp. 259-270. doi:10.1111/j.1365-2389.1979.tb00983.x [10] P. A. Vadas and J. T. Sims, “Predicting Phosphorus De- sorption from Mid-Atlantic Coastal Plain Soil,” Soil Sci- ence Society of America Journal, Vol. 66, No. 2, 2002, pp. 623-631. doi:10.2136/sssaj2002.0623 [11] M. C. Horta and J. Torrent, “The Olsen P Method as an Agronomic and Environmental Test for Predicting Phos- phate Release from Acid Soils,” Nutrient Cycling in Agroecosystems, Vol. 77, No. 3, 2007, pp. 283-292. doi:10.1007/s10705-006-9066-2 [12] R. E. White, “Studies on the Phosphate Potentials of Soils. IV. The Mechanism of the Soil/Solution Ratio Effect,” Australian Journal of Soil Research, Vol. 4, No. 1, 1966, pp. 77-85. doi:10.1071/SR9660077 [13] G. D. Hope and J. K. Syers, “Effects of Solution to Soil Ratio on Phosphate Sorption by Soils,” Journal of Soil Science, Vol. 27, No. 3, 1976, pp. 301-306. doi:10.1111/j.1365-2389.1976.tb02000.x [14] M. L. Leclerc, M. C. Nolin, D. Cluis and R. R. Simard, “Grouping Soils of the Montreal Lowlands (Quebec) Ac- cording to Fertility and P Sorption and Desorption Char- acteristics,” Canadian Journal of Soil Science, Vol. 81, No. 1, 2001, pp. 71-83. doi:10.4141/S00-021 [15] K. Daly, D. Jeffrey and H. Tunney, “The Effect of Soil Type on Phosphorus Sorption Capacity and Desorption Dynamics in Irish Grassland Soils,” Soil Use Manage- ment, Vol. 17, No. 1, 2001, pp. 12-20. doi:10.1111/j.1475-2743.2001.tb00003.x [16] G. S. Toor, G. S. Bahl and A. C. Vig, “Pattern of P Availability in Different Soils as Assessed by the Adsorp- tion Equations,” Journal of Indian Society of Soil Science, Vol. 45, No. 4, 1997, pp. 719-723. [17] N. J. Barrow, “Modeling the Effects of pH on Phosphate Sorption by Soils,” Journal of Soil Science, Vol. 35, No. 2, 1984, pp. 283-297. Copyright © 2012 SciRes. OJSS  Phosphate Desorption Characteristics of Some Representative Soils of Bangladesh: Effect of Exchangeable Anions, Water Molecules and Solution to Soil Ratios 241 doi:10.1111/j.1365-2389.1984.tb00283.x [18] I. Bertrand, R. E. Holloway, R. D. Armstrong and M. J. MCLaughlin, “Chemical Characteristics of Phosphorus in Alkaline Soils from Southern Australia,” Australian Jour- nal of Soil Research, Vol. 41, No. 1, 2003, pp. 61-76. doi:10.1071/SR02021 [19] I. C. R. Holford and G. E. G. Mattingly, “The High- and Low-energy Phosphate Adsorbing Surfaces in Calcareous Soils,” Journal of Soil Science, Vol. 26, No. 4, 1974, pp. 407-417. doi:10.1111/j.1365-2389.1975.tb01964.x [20] IUSS Working Group WRB, “World Reference Base for Soil Resources 2006,” World Soil Resources Reports No. 103, FAO, Rome, 2006. [21] G. J. Bouyoucos, “The Hydrometer as a New Method for the Mechanical Analysis of Soils,” Soil Science, Vol. 23, No. 4, 1927, pp. 343-353. doi:10.1097/00010694-192705000-00002 [22] A. Walkley and I. A. Black, “An Examination of the Degtjareff Method for Determining Soil Organic Matter and a Proposed Modification of the Chromic Acid Titra- tion Method,” Soil Scienc e , Vol. 37, 1934, pp. 29-38. [23] M. L. Jackson, “Soil Chemical Analysis,” Prentice-Hall, Inc., Upper Saddle River, 1973, pp. 38-56. [24] S. R. Olsen, C. V. Coles, F. S. Watanabe and L. A. Dean, “Estimation of Available Phosphorus in Soils by Extrac- tion with Sodium Bicarbonate,” USDA Circ. 939, USDA, Washington DC, 1954. [25] J. Murphy and J. P. Riley, “A Modified Single Solution Method for the Determination of Phosphate in Natural Waters,” Analytica Chemica Acta, Vol. 27, 1962, pp. 31- 36. doi:10.1016/S0003-2670(00)88444-5 [26] L. E. Allison and C. D. Moodie, “Carbonate,” In: C. A. Black, Ed., Methods of Soil Analysis. Part 2: Chemical and Microbiological Properties, Agronomy, Madison, Wisconsin, 1965, pp. 1379-1398. [27] G. S. Holmgren, “A Rapid Citrate-Dithionate Extractable Iron Procedure,” Soil Science Society of America Pro- ceedings, Vol. 31, 1967, pp. 210-221. [28] J. A. Mckeague and J. H. Day, “Dithionate and Oxalate Extractable Fe and Al as Aids in Differentiating Various Classes of Soils,” Canadian Journal of Soil Science, Vol. 46, 1966, pp. 13-22. doi:10.4141/cjss66-003 [29] C. L. Bascomb, “Distribution of Pyrophosphate-Extract- able Iron and Organic Carbon in Soils of Various Groups,” Journal of Soil Science, Vol. 19, No. 1, 1968, pp. 251-258. doi:10.1111/j.1365-2389.1968.tb01538.x [30] R. V. Olson and R. Ellis, “Iron,” In: C. A. Black, Ed., Methods of Soil Analysis, Part 2, Agronomy, Monograph 9, ASA and SSSA, Madison, 1982, pp. 301-312. [31] A. N. Sharpley, L. R. Ahuja, M. Yamamoto and R. G. Menzel, “The Kinetics of Phosphorus Desorption from Soil,” Soil Science Society of America Journal, Vol. 45, No. 3, 1981, pp. 493-496. doi:10.2136/sssaj1981.03615995004500030010x [32] I. Langmuir, “The Adsorption of Gases on Plane Surfaces of Glass, Mica and Platinum,” Journal of American Chemical Society, Vol. 40, No. 9, 1918, pp. 1361-1402. doi:10.1021/ja02242a004 [33] H. Freundlich, “Colloid and Capillary Chemistry,” Me- thuen, London, 1926, pp. 114-122. [34] M. Z. Afsar, S. Hoque and K. T. Osman, “A Comparison of the Langmuir, Freundlich and Temkin Equations to Describe Phosphate Sorption Characteristics of Some Re- presentative Soils of Bangladesh,” International Journal of Soil Science, Vol. 7, No. 3, 2012, pp. 91-99. [35] M. Emadi, M. M. Baghernejad, M. Emadi, H. Fathi and M. Saffari, “Phosphorus Forms and Behaviors in Selected Heavily Fertilized Soils,” Archieves of Agronomy and Soil Science, Vol. 55, No. 6, 2009, pp. 579-595. doi:10.1080/03650340902889796 [36] S. E. Kuo, J. Jellum and W. L. Pan, “Influence of Phos- phate Sorption Parameters of Soils on the Desorption of Phosphate by Various Extractants,” Soil Science Society of America Journal, Vol. 52, No. 4, 1988, pp. 974-979. doi:10.2136/sssaj1988.03615995005200040014x [37] K. Zhou and Y. Li, “Phosphorus-Sorption Characteristics of Soils and Limestone from the Southern Everglades and Adjacent Farmlands,” Soil Science Society of America Journal, Vol. 65, No. 5, 2011, pp. 1404-1412. doi:10.2136/sssaj2001.6551404x Copyright © 2012 SciRes. OJSS
|