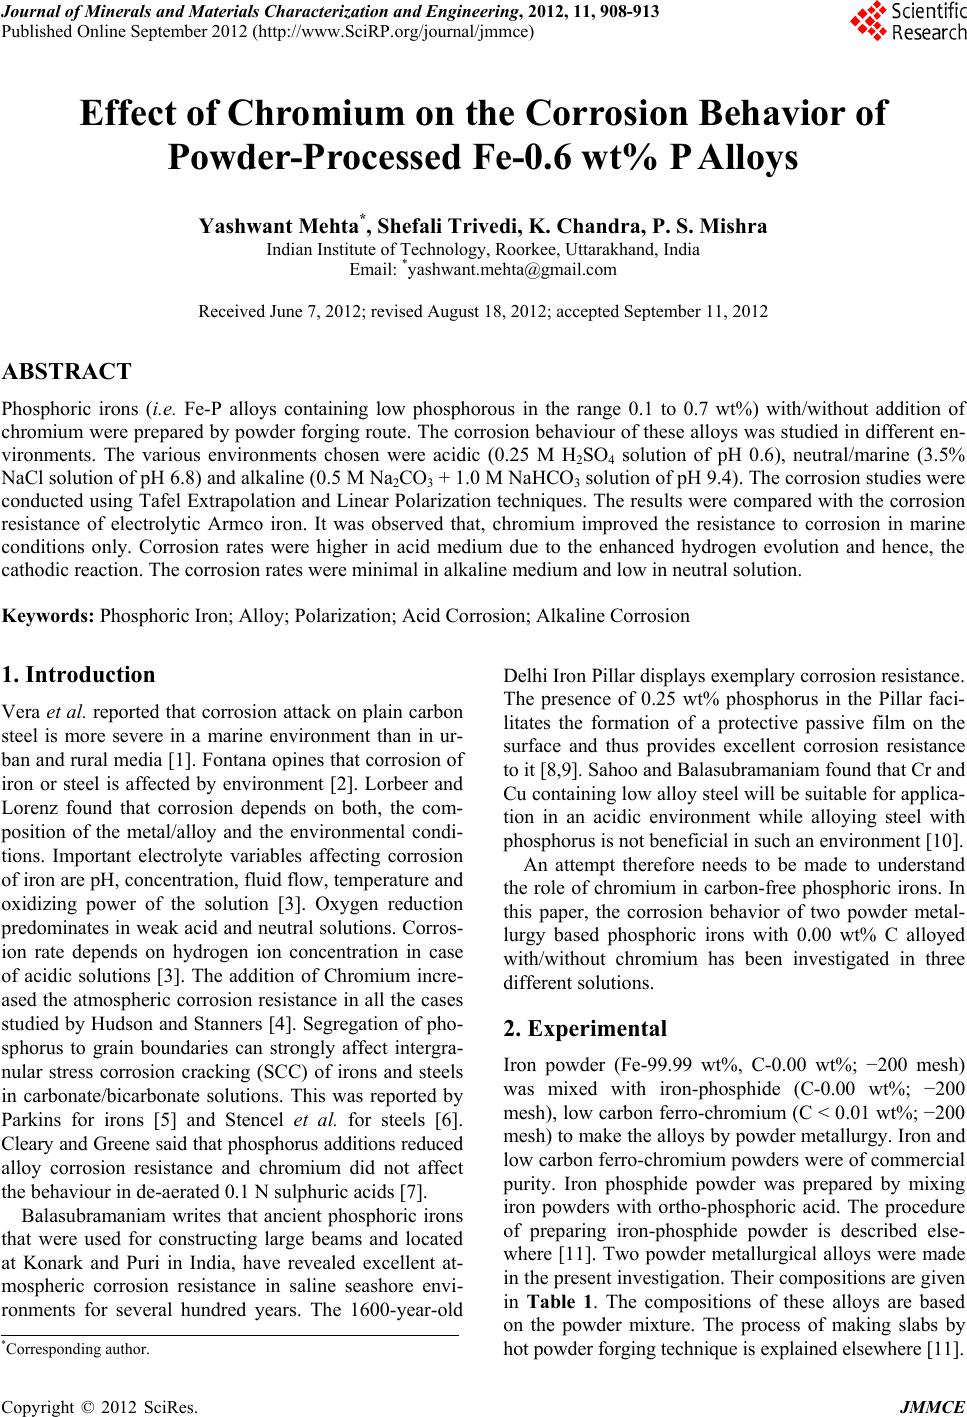
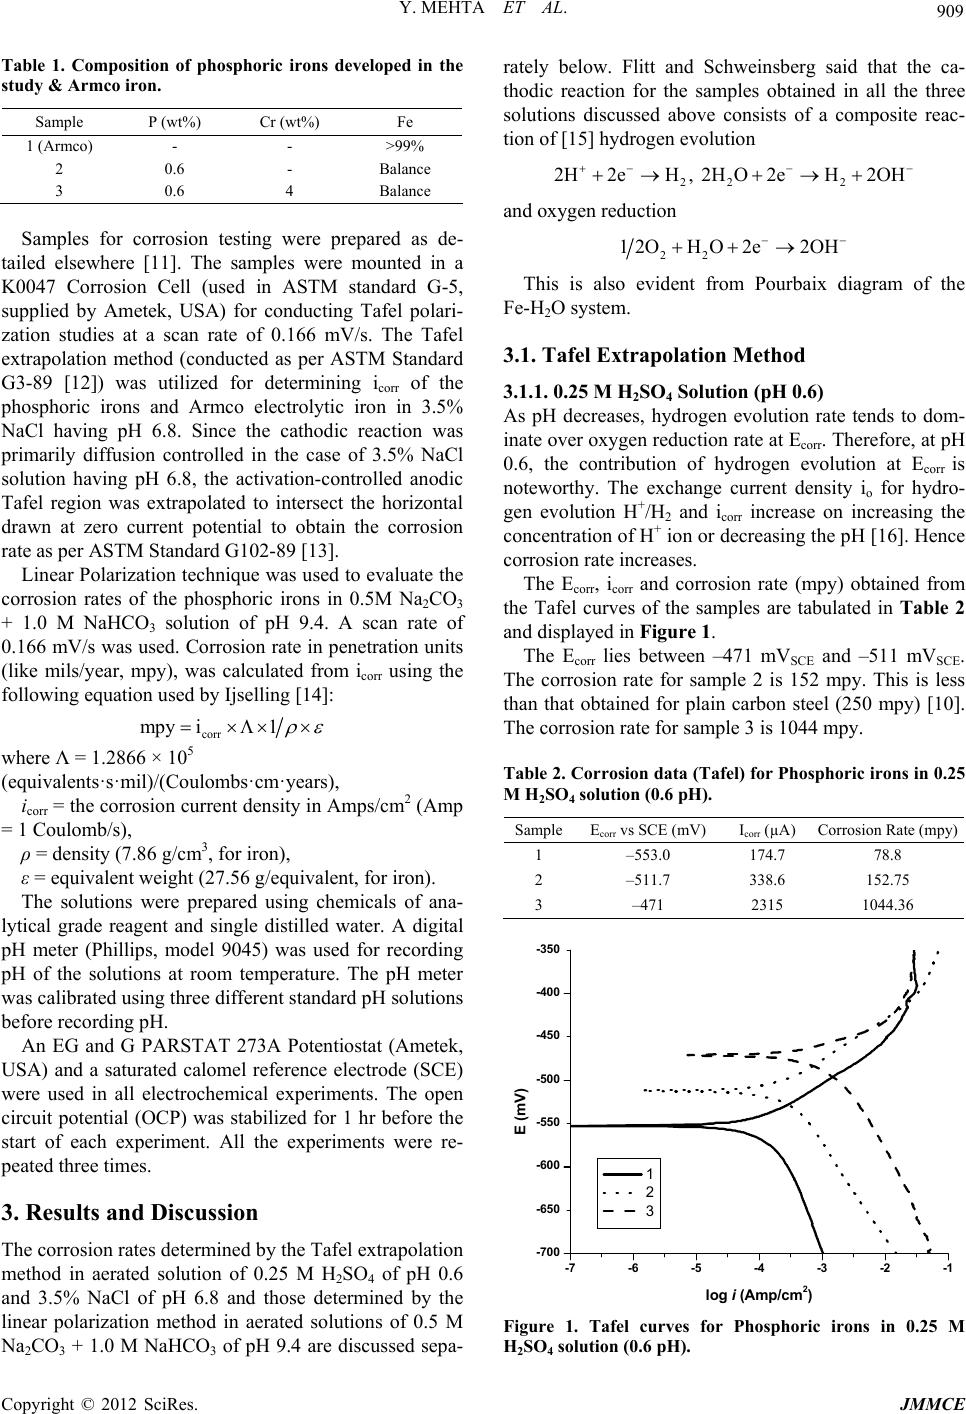
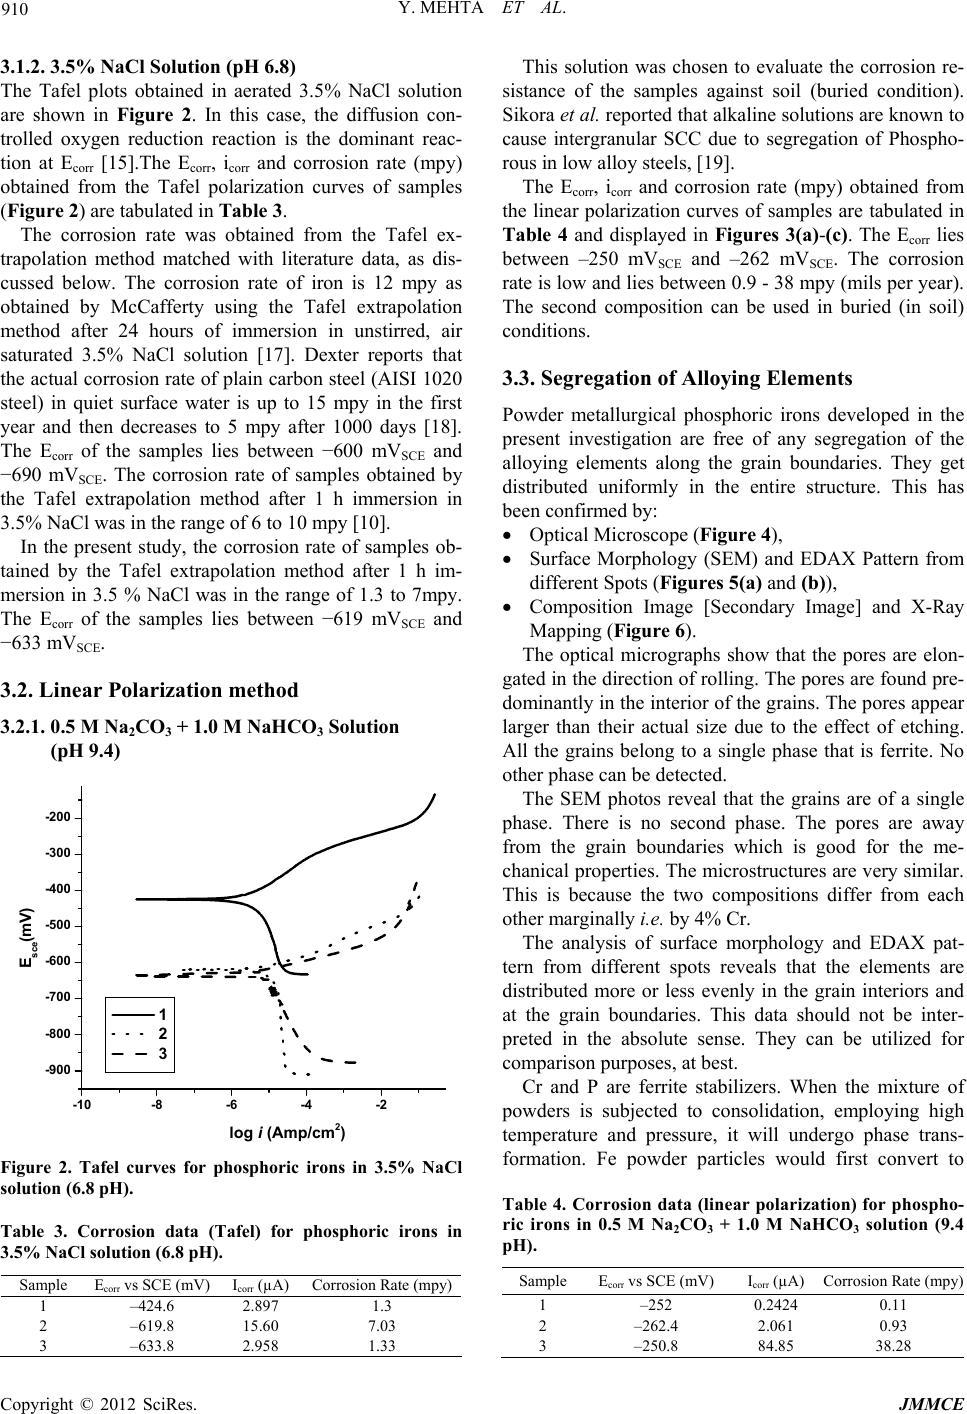
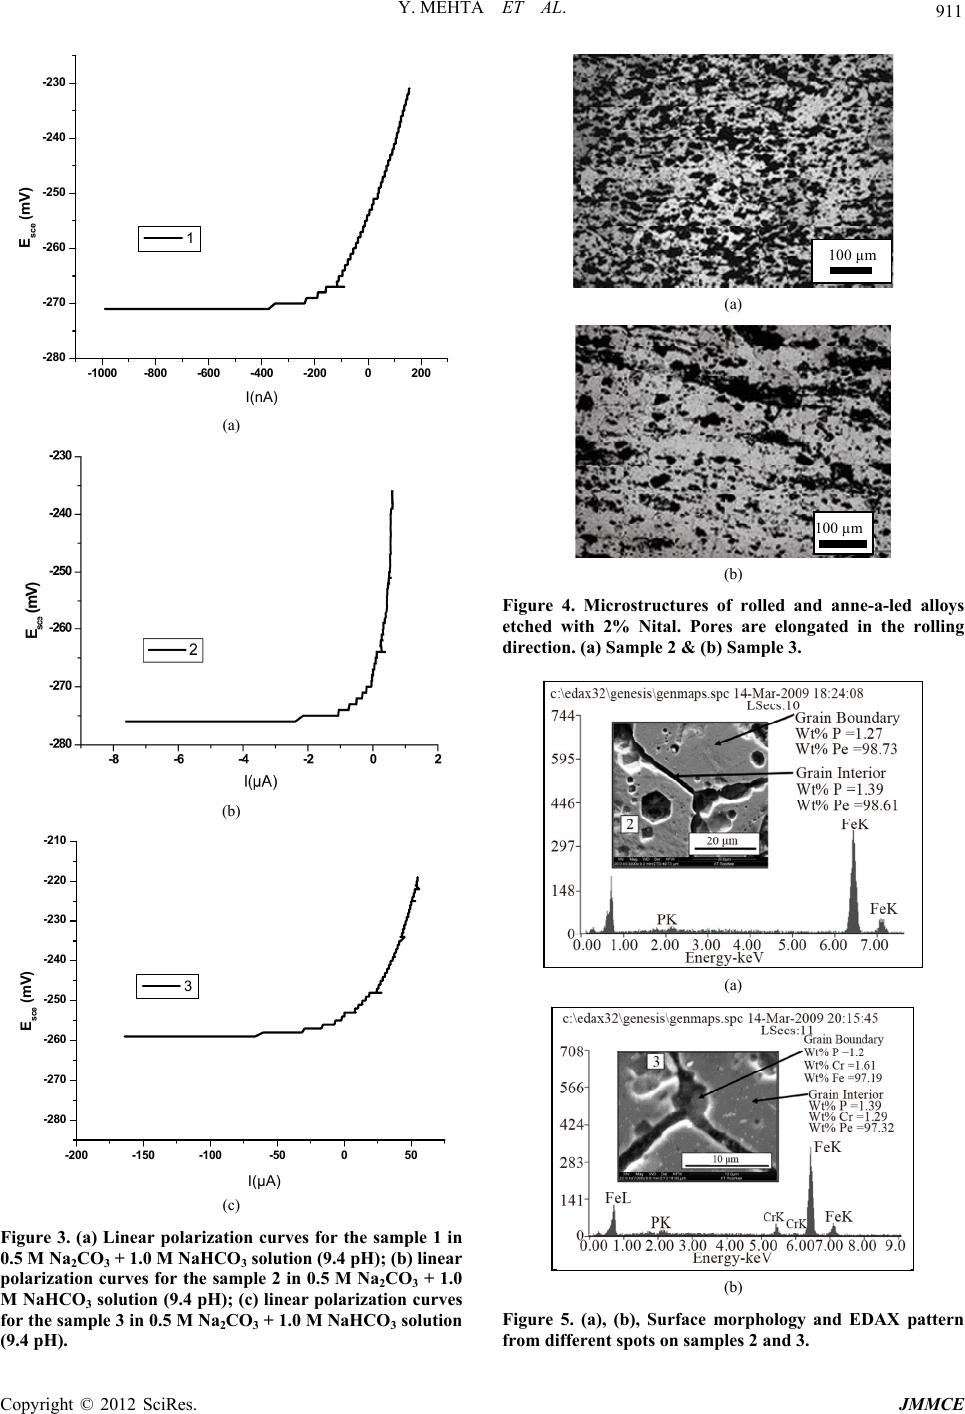
Journal of Minerals and Materials Characterization and Engineering, 2012, 11, 908-913
Published Online September 2012 (http://www.SciRP.org/journal/jmmce)
Effect of Chromium on the Corros ion Behavior of
Powder-Processed Fe-0.6 wt% P Alloys
Yashwant Mehta*, Shefali Trivedi, K. Chandra, P. S. Mishra
Indian Institute of Technology, Roorkee, Uttarakhand, India
Email: *yashwant.mehta@gmail.com
Received June 7, 2012; revised August 18, 2012; accepted September 11, 2012
ABSTRACT
Phosphoric irons (i.e. Fe-P alloys containing low phosphorous in the range 0.1 to 0.7 wt%) with/without addition of
chromium were prepared by powder forging route. The corrosion behaviour of these alloys was studied in different en-
vironments. The various environments chosen were acidic (0.25 M H2SO4 solution of pH 0.6), neutral/marine (3.5%
NaCl solution of pH 6.8) and alkaline (0.5 M Na2CO3 + 1.0 M NaHCO3 solution of pH 9.4). The corrosion studies were
conducted using Tafel Extrapolation and Linear Polarization techniques. The results were compared with the corrosion
resistance of electrolytic Armco iron. It was observed that, chromium improved the resistance to corrosion in marine
conditions only. Corrosion rates were higher in acid medium due to the enhanced hydrogen evolution and hence, the
cathodic reaction. The corrosion rates were minimal in alkaline medium and low in neutral solution.
Keywords: Phosphoric Iron; Alloy; Polarization; Acid Corrosion; Alkaline Corrosion
1. Introduction
Vera et al. reported that corrosion attack on plain carbon
steel is more severe in a marine environment than in ur-
ban and rural media [1]. Fontana opines that corrosion of
iron or steel is affected by environment [2]. Lorbeer and
Lorenz found that corrosion depends on both, the com-
position of the metal/alloy and the environmental condi-
tions. Important electrolyte variables affecting corrosion
of iron are pH, concentration, fluid flow, temperature and
oxidizing power of the solution [3]. Oxygen reduction
predominates in weak acid and neutral solutions. Corros-
ion rate depends on hydrogen ion concentration in case
of acidic solutions [3]. The addition of Chromium incre-
ased the atmospheric corrosion resistance in all the cases
studied by Hudson and Stanners [4]. Segregation of pho-
sphorus to grain boundaries can strongly affect intergra-
nular stress corrosion cracking (SCC) of irons and steels
in carbonate/bicarbonate solutions. This was reported by
Parkins for irons [5] and Stencel et al. for steels [6].
Cleary and Greene said that phosphorus additions reduced
alloy corrosion resistance and chromium did not affect
the behaviour in de-aerated 0.1 N sulphuric acids [7].
Balasubramaniam writes that ancient phosphoric irons
that were used for constructing large beams and located
at Konark and Puri in India, have revealed excellent at-
mospheric corrosion resistance in saline seashore envi-
ronments for several hundred years. The 1600-year-old
Delhi Iron Pillar displays exemplary corrosion resistance.
The presence of 0.25 wt% phosphorus in the Pillar faci-
litates the formation of a protective passive film on the
surface and thus provides excellent corrosion resistance
to it [8,9]. Sahoo and Balasubramaniam found that Cr and
Cu containing low alloy steel will be suitable for applica-
tion in an acidic environment while alloying steel with
phosphorus is not beneficial in such an environment [10].
An attempt therefore needs to be made to understand
the role of chromium in carbon-free phosphoric irons. In
this paper, the corrosion behavior of two powder metal-
lurgy based phosphoric irons with 0.00 wt% C alloyed
with/without chromium has been investigated in three
different solutions.
2. Experimental
Iron powder (Fe-99.99 wt%, C-0.00 wt%; 200 mesh)
was mixed with iron-phosphide (C-0.00 wt%; 200
mesh), low carbon ferro-chromium (C < 0.01 wt%; 200
mesh) to make the alloys by powder metallurgy. Iron and
low carbon ferro-chromium powders were of commercial
purity. Iron phosphide powder was prepared by mixing
iron powders with ortho-phosphoric acid. The procedure
of preparing iron-phosphide powder is described else-
where [11]. Two powder metallurgical alloys were made
in the present investigation. Their compositions are given
in Table 1. The compositions of these alloys are based
on the powder mixture. The process of making slabs by
hot powder forging technique is explained elsewhere [11].
*Corresponding author.
Copyright © 2012 SciRes. JMMCE
Y. MEHTA ET AL. 909
Table 1. Composition of phosphoric irons developed in the
study & Armco iron.
Sample P (wt%) Cr (wt%) Fe
1 (Armco) - - >99%
2 0.6 - Balance
3 0.6 4 Balance
Samples for corrosion testing were prepared as de-
tailed elsewhere [11]. The samples were mounted in a
K0047 Corrosion Cell (used in ASTM standard G-5,
supplied by Ametek, USA) for conducting Tafel polari-
zation studies at a scan rate of 0.166 mV/s. The Tafel
extrapolation method (conducted as per ASTM Standard
G3-89 [12]) was utilized for determining icorr of the
phosphoric irons and Armco electrolytic iron in 3.5%
NaCl having pH 6.8. Since the cathodic reaction was
primarily diffusion controlled in the case of 3.5% NaCl
solution having pH 6.8, the activation-controlled anodic
Tafel region was extrapolated to intersect the horizontal
drawn at zero current potential to obtain the corrosion
rate as per ASTM Standard G102-89 [13].
Linear Polarization technique was used to evaluate the
corrosion rates of the phosphoric irons in 0.5M Na2CO3
+ 1.0 M NaHCO3 solution of pH 9.4. A scan rate of
0.166 mV/s was used. Corrosion rate in penetration units
(like mils/year, mpy), was calculated from icorr using the
following equation used by Ijselling [14]:
corr
mpy i1

where Λ = 1.2866 × 10⁵
(equivalents·s·mil)/(Coulombs·cm·years),
icorr = the corrosion current density in Amps/cm2 (Amp
= 1 Coulomb/s),
ρ = density (7.86 g/cm3, for iron),
ε = equivalent weight (27.56 g/equivalent, for iron).
The solutions were prepared using chemicals of ana-
lytical grade reagent and single distilled water. A digital
pH meter (Phillips, model 9045) was used for recording
pH of the solutions at room temperature. The pH meter
was calibrated using three different standard pH solutions
before recording pH.
An EG and G PARSTAT 273A Potentiostat (Ametek,
USA) and a saturated calomel reference electrode (SCE)
were used in all electrochemical experiments. The open
circuit potential (OCP) was stabilized for 1 hr before the
start of each experiment. All the experiments were re-
peated three times.
3. Results and Discussion
The corrosion rates determined by the Tafel extrapolation
method in aerated solution of 0.25 M H2SO4 of pH 0.6
and 3.5% NaCl of pH 6.8 and those determined by the
linear polarization method in aerated solutions of 0.5 M
Na2CO3 + 1.0 M NaHCO3 of pH 9.4 are discussed sepa-
rately below. Flitt and Schweinsberg said that the ca-
thodic reaction for the samples obtained in all the three
solutions discussed above consists of a composite reac-
tion of [15] hydrogen evolution
22 2
2H2eH, 2HO2eH2OH


and oxygen reduction
22
12OHO 2e2OH


This is also evident from Pourbaix diagram of the
Fe-H2O system.
3.1. Tafel Extrapolation Method
3.1.1. 0.25 M H2SO4 Solution (pH 0.6)
As pH decreases, hydrogen evolution rate tends to dom-
inate over oxygen reduction rate at Ecorr. Therefore, at pH
0.6, the contribution of hydrogen evolution at Ecorr is
noteworthy. The exchange current density io for hydro-
gen evolution H+/H2 and icorr increase on increasing the
concentration of H+ ion or decreasing the pH [16]. Hence
corrosion rate increases.
The Ecorr, icorr and corrosion rate (mpy) obtained from
the Tafel curves of the samples are tabulated in Table 2
and displayed in Figure 1.
The Ecorr lies between –471 mVSCE and –511 mVSCE.
The corrosion rate for sample 2 is 152 mpy. This is less
than that obtained for plain carbon steel (250 mpy) [10].
The corrosion rate for sample 3 is 1044 mpy.
Table 2. Corrosion data (Tafel) for Phosphoric irons in 0.25
M H2SO4 solution (0.6 pH).
Sample Ecorr vs SCE (mV) Icorr (µA) Corrosion Rate (mpy)
1 –553.0 174.7 78.8
2 –511.7 338.6 152.75
3 –471 2315 1044.36
-700
-650
-600
-550
-500
-450
-400
-350
-7 -6 -5 -4 -3 -2 -1
lo
g
i
(
Amp/cm2
)
E (mV)
1
2
3
Figure 1. Tafel curves for Phosphoric irons in 0.25 M
H2SO4 solution (0.6 pH).
Copyright © 2012 SciRes. JMMCE
Y. MEHTA ET AL.
910
3.1.2. 3.5% NaCl Solu ti o n (p H 6.8)
The Tafel plots obtained in aerated 3.5% NaCl solution
are shown in Figure 2. In this case, the diffusion con-
trolled oxygen reduction reaction is the dominant reac-
tion at Ecorr [15].The Ecorr, icorr and corrosion rate (mpy)
obtained from the Tafel polarization curves of samples
(Figure 2) are tabulated in Table 3.
The corrosion rate was obtained from the Tafel ex-
trapolation method matched with literature data, as dis-
cussed below. The corrosion rate of iron is 12 mpy as
obtained by McCafferty using the Tafel extrapolation
method after 24 hours of immersion in unstirred, air
saturated 3.5% NaCl solution [17]. Dexter reports that
the actual corrosion rate of plain carbon steel (AISI 1020
steel) in quiet surface water is up to 15 mpy in the first
year and then decreases to 5 mpy after 1000 days [18].
The Ecorr of the samples lies between 600 mVSCE and
690 mVSCE. The corrosion rate of samples obtained by
the Tafel extrapolation method after 1 h immersion in
3.5% NaCl was in the range of 6 to 10 mpy [10].
In the present study, the corrosion rate of samples ob-
tained by the Tafel extrapolation method after 1 h im-
mersion in 3.5 % NaCl was in the range of 1.3 to 7mpy.
The Ecorr of the samples lies between 619 mVSCE and
633 mVSCE.
3.2. Linear Polarization method
3.2.1. 0.5 M Na2CO3 + 1.0 M NaHC O3 Solution
(pH 9.4)
-900
-800
-700
-600
-500
-400
-300
-200
-10-8-6-4-2
log i (Amp/cm2)
Esce(mV)
1
2
3
Figure 2. Tafel curves for phosphoric irons in 3.5% NaCl
solution (6.8 pH).
Table 3. Corrosion data (Tafel) for phosphoric irons in
3.5% NaCl solution (6.8 pH).
Sample Ecorr vs SCE (mV) Icorr (µA) Corrosion Rate (mpy)
1 –424.6 2.897 1.3
2 –619.8 15.60 7.03
3 –633.8 2.958 1.33
This solution was chosen to evaluate the corrosion re-
sistance of the samples against soil (buried condition).
Sikora et al. reported that alkaline solutions are known to
cause intergranular SCC due to segregation of Phospho-
rous in low alloy steels, [19].
The Ecorr, icorr and corrosion rate (mpy) obtained from
the linear polarization curves of samples are tabulated in
Table 4 and displayed in Figures 3(a)-(c). The Ecorr lies
between –250 mVSCE and –262 mVSCE. The corrosion
rate is low and lies between 0.9 - 38 mpy (mils per year).
The second composition can be used in buried (in soil)
conditions.
3.3. Segregation of Alloying Elements
Powder metallurgical phosphoric irons developed in the
present investigation are free of any segregation of the
alloying elements along the grain boundaries. They get
distributed uniformly in the entire structure. This has
been confirmed by:
Optical Microscope (Figure 4 ),
Surface Morphology (SEM) and EDAX Pattern from
different Spots (Figures 5(a) and (b)),
Composition Image [Secondary Image] and X-Ray
Mapping (Figure 6).
The optical micrographs show that the pores are elon-
gated in the direction of rolling. The pores are found pre-
dominantly in the interior of the grains. The pores appear
larger than their actual size due to the effect of etching.
All the grains belong to a single phase that is ferrite. No
other phase can be detected.
The SEM photos reveal that the grains are of a single
phase. There is no second phase. The pores are away
from the grain boundaries which is good for the me-
chanical properties. The microstructures are very similar.
This is because the two compositions differ from each
other marginally i.e. by 4% Cr.
The analysis of surface morphology and EDAX pat-
tern from different spots reveals that the elements are
distributed more or less evenly in the grain interiors and
at the grain boundaries. This data should not be inter-
preted in the absolute sense. They can be utilized for
comparison purposes, at best.
Cr and P are ferrite stabilizers. When the mixture of
powders is subjected to consolidation, employing high
temperature and pressure, it will undergo phase trans-
formation. Fe powder particles would first convert to
Table 4. Corr osion data (linear polarization) for phospho-
ric irons in 0.5 M Na2CO3 + 1.0 M NaHCO3 solution (9.4
pH).
Sample Ecorr vs SCE (mV)Icorr (µA) Corrosion Rate (mpy)
1 –252 0.2424 0.11
2 –262.4 2.061 0.93
3 –250.8 84.85 38.28
Copyright © 2012 SciRes. JMMCE
Y. MEHTA ET AL. 911
-280
-270
-260
-250
-240
-230
-1000-800 -600 -400 -2000200
I(nA)
Esce (mV )
1
(a)
(b)
I
A
)
-280
-270
-260
-250
-240
-230
-220
-210
-200 -150 -100-50050
Esce (mV)
3
(c)
Figure 3. (a) Linear polarization curves for the sample 1 in
0.5 M Na2CO3 + 1.0 M NaHCO3 solution (9.4 pH); (b) linear
polarization curves for the sample 2 in 0.5 M Na2CO3 + 1.0
M NaHCO3 solution (9.4 pH); (c) linear polarization curves
for the sample 3 in 0.5 M Na2CO3 + 1.0 M NaHCO3 solution
(9.4 pH).
100 µm
(a)
100 µm
(b)
Figure 4. Microstructures of rolled and anne-a-led alloys
etched with 2% Nital. Pores are elongated in the rolling
direction. (a) Sample 2 & (b) Sample 3.
(a)
(b)
Figure 5. (a), (b), Surface morphology and EDAX pattern
from different spots on samples 2 and 3.
Copyright © 2012 SciRes. JMMCE
Y. MEHTA ET AL.
912
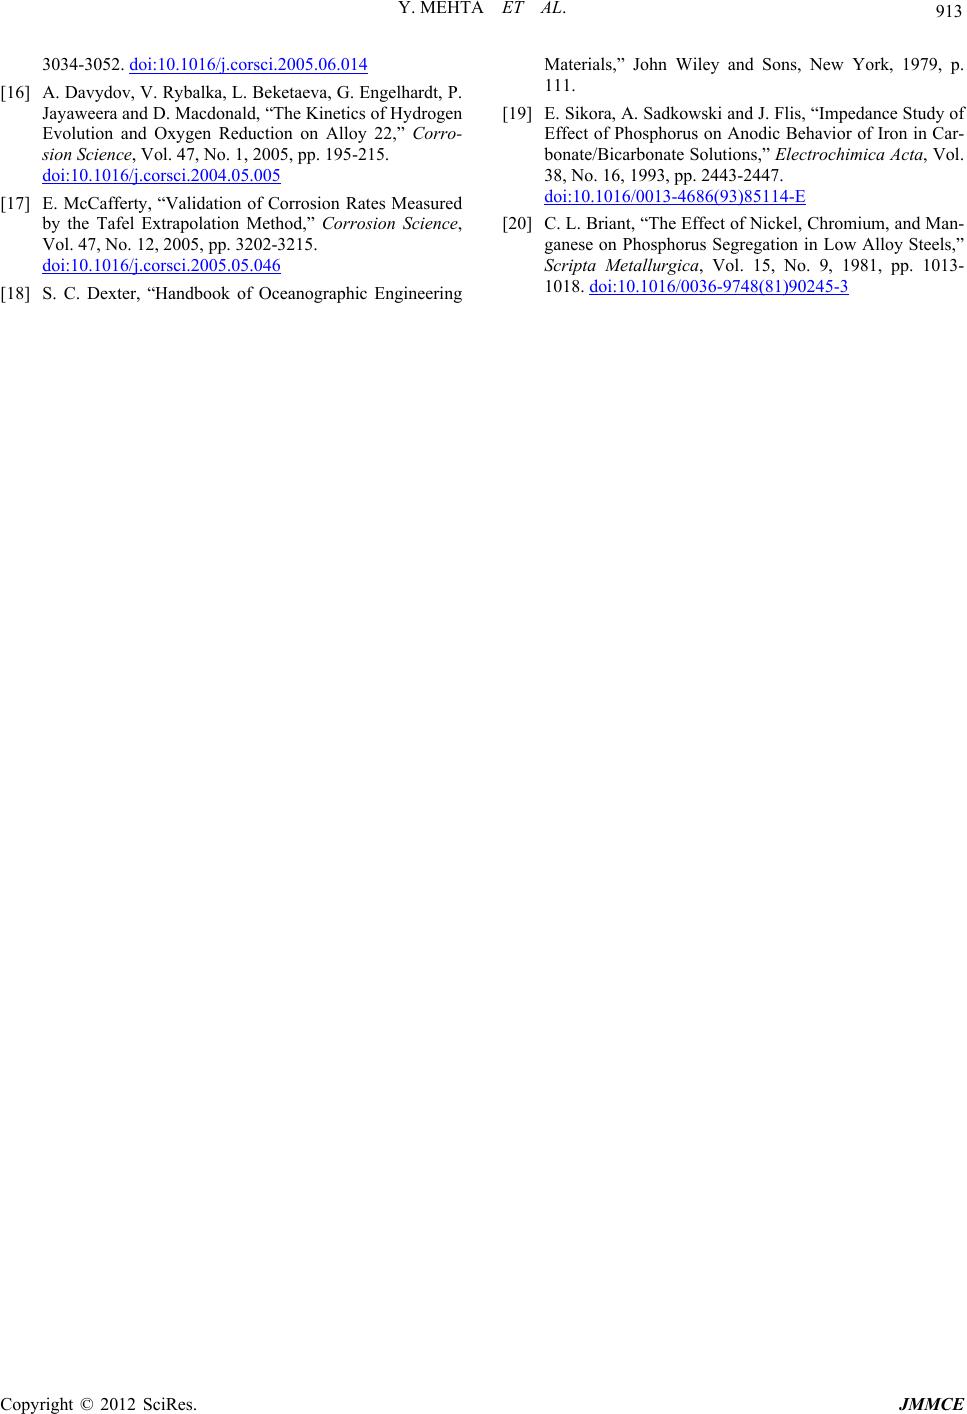
Figure 6. Composition image [secondary image] & X-ray
mapping of sample 3.
gamma (FCC) iron and as ferrite stabilizers diffuse inside,
they would gradually convert into alpha (BCC) iron. In
this way, transfer of all the ferrite stabilizers would pro-
ceed from Fe particle surfaces towards the interior of the
particles. The grain boundaries and grain interiors do not
show any major differences in the concentration of P
with/without chromium. Further, Briant found that the
segregation of phosphorus is not affected by changes in
the amounts of Ni, Cr, and Mn in the steel [20].
X-ray mapping of all the elements confirms that these
elements get distributed uniformly in the entire structure
showing no signs of segregation, of any alloying element.
Furthermore, both the samples had the same amount of
residual porosity i.e. about 7 vol%. Hence they can be
compared with each other.
4. Conclusions
1) Ordinarily, Powder metallurgical alloys are poor in
corrosion resistance due to the inherent porosity associ-
ated with them. However, Phosphoric Irons alloyed with
ferrite formers such as silicon, offer improved corrosion
resistance in general, as compared with known wrought
based iron systems.
2) Chromium addition in Iron-Phosphorous powder
metallurgical alloys lower corrosion rates at 6.8 pH.
3) The compositions designed in this investigation are
preferable under coastal/marine/de-icing salt conditions.
The second alloy can also be used under alkaline con-
ditions.
5. Acknowledgements
We are grateful an anonymous referee for helpful com-
ments. We also wish to thank Kim Humphreys for Eng-
lish editing. All errors are ours.
REFERENCES
[1] R. Vera, B. Rosales and C. Tapia, “Effect of the Exposure
Angle in the Corrosion Rate of Plain Carbon Steel in a
Marine Atmosphere,” Corrosion Science, Vol. 45, No. 2,
2003, pp. 321-337. doi:10.1016/S0010-938X(02)00071-9
[2] M. G. Fontana and Greene, “Corrosion Engineering,” 3rd
Edition, McGraw-Hill International Edition, 2006, pp.
23-27,499-503.
[3] P. Lorbeer and W. J. Lorenz, “The Kinetics of Iron Dis-
solution and Passivation in Solutions Containing Oxy-
gen,” Electrochimica Acta, Vol. 25, No. 4, 1980, pp. 375-
381. doi:10.1016/0013-4686(80)87026-5
[4] J. C. Hudson and J. F. Stanners, “The Corrosion Resis-
tance of Low-Alloy Steels,” Journal of the Iron and Steel
Institute, Vol. 180, 1955, pp. 271-284.
[5] R. N. Parkins, “Environment-Induced Cracking of Met-
als,” NACE, Houston, 1990.
[6] H. Stencel, H. Vehoff and P. Neumann, “Chemistry and
Physics of Fracture,” Martinus Nijhoff, Dordrecht, 1987,
p. 652. doi:10.1007/978-94-009-3665-2_40
[7] H. J. Cleary and N. D. Greene, “Corrosion Properties of
Iron and Steel,” Corrosion Science, Vol. 7, No. 12, 1967,
pp. 821-831. doi:10.1016/S0010-938X(67)80115-X
[8] R. Balasubramaniam, “On the Corrosion Resistance of
the Delhi Iron Pillar,” Corrosion Science, Vol. 42, No. 12,
2000, pp. 2103-2129.
doi:10.1016/S0010-938X(00)00046-9
[9] R. Balasubramaniam and A. V. Ramesh Kumar, “Char-
acterization of Delhi Iron Pillar Rust by X-Ray Diffrac-
tion, Fourier Infrared Spectroscopy, Mössbauer Spec-
troscopy,” Corrosion Science, Vol. 42, No. 12, 2000, pp.
2085-2101. doi:10.1016/S0010-938X(00)00045-7
[10] G. Sahoo and R. Balasubramaniam, “Corrosion of Phos-
phoric Irons in Acidic Environments,” Journal of ASTM
International, Vol. 5, No. 5, 2008, pp. 1-7.
[11] Y. Mehta, S. Trivedi, K. Chandra and P. S. Mishra, “Ef-
fect of Chromium on the Corrosion Behavior of Powder-
Processed Fe-0.35 wt% P Alloys,” Journal of Minerals &
Materials Characterization & Engineering, Vol. 8, No. 7,
2009, pp. 501-511.
[12] ASTM Standard G3-89, “Standard Practice for Conven-
tions Applicable to Electrochemical Measurements in
Corrosion Testing,” Annual Book of ASTM Standards,
ASTM International, West Conshohocken, Vol. 3.02;
2006.
[13] ASTM Standard G102-89, “Standard Practice for Calcu-
lation of Corrosion Rates and Related Information from
Electrochemical Measurements,” Annual Book of ASTM
Standards, ASTM International, West Conshohocken,
Vol. 3.02, 2006.
[14] F. P. Ijsseling, “Application of Electrochemical Methods
of Corrosion Rate Determination to System Involving
Corrosion Product Layers,” British Corrosion Journal,
London, Vol. 21, 1986, pp. 95-101.
[15] H. J. Flitt and D. Schweinsberg, “Evaluation of Corrosion
Rate from Polarization Curves Not Exhibiting a Tafel
Region,” Corrosion Science, Vol. 47, No. 12, 2005, pp.
Copyright © 2012 SciRes. JMMCE
Y. MEHTA ET AL.
Copyright © 2012 SciRes. JMMCE
913
3034-3052. doi:10.1016/j.corsci.2005.06.014
[16] A. Davydov, V. Rybalka, L. Beketaeva, G. Engelhardt, P.
Jayaweera and D. Macdonald, “The Kinetics of Hydrogen
Evolution and Oxygen Reduction on Alloy 22,” Corro-
sion Science, Vol. 47, No. 1, 2005, pp. 195-215.
doi:10.1016/j.corsci.2004.05.005
[17] E. McCafferty, “Validation of Corrosion Rates Measured
by the Tafel Extrapolation Method,” Corrosion Science,
Vol. 47, No. 12, 2005, pp. 3202-3215.
doi:10.1016/j.corsci.2005.05.046
[18] S. C. Dexter, “Handbook of Oceanographic Engineering
Materials,” John Wiley and Sons, New York, 1979, p.
111.
[19] E. Sikora, A. Sadkowski and J. Flis, “Impedance Study of
Effect of Phosphorus on Anodic Behavior of Iron in Car-
bonate/Bicarbonate Solutions,” Electrochimica Acta, Vol.
38, No. 16, 1993, pp. 2443-2447.
doi:10.1016/0013-4686(93)85114-E
[20] C. L. Briant, “The Effect of Nickel, Chromium, and Man-
ganese on Phosphorus Segregation in Low Alloy Steels,”
Scripta Metallurgica, Vol. 15, No. 9, 1981, pp. 1013-
1018. doi:10.1016/0036-9748(81)90245-3