 Advances in Microbiology, 2012, 2, 284-294 http://dx.doi.org/10.4236/aim.2012.23034 Published Online September 2012 (http://www.SciRP.org/journal/aim) Identification and Characterisation of a Bacterial Isolate Capable of Growth on Trichloroethylene as the Sole Carbon Source Piyali Mukherjee, Pranab Roy* Department of Biotechnology, Burdwan University, Burdwan, India Email: piyalimkhrj8@gmail.com, *pranabroy@rediffmail.com Received April 23, 2012; revised May 28, 2012; accepted June 13, 2012 ABSTRACT The aim of this research work was to isolate microbes from soil, to investigate their potential use as effective bioreme- diation tools for trichloroethylene—a potent environmental pollutant. The isolate showing good growth in presence of TCE was named PM102. Microbiological characterisation of the PM102 isolate showed that it was a gram negative rod. Detailed structure was revealed by scanning electron microscopy. pH and temperature optima, salt tolerance and opti- mum TCE concentration for growth of PM102 were determined. The ability of this bacterium to degrade TCE was studied in acidic and neutral pH by biochemical test and chloride release. Five TCE inducible bands were detected in the protein profile of the isolate as studied by SDS PAGE. A major TCE inducible band of 51.61 kDa was excised from the gel and injected into rabbit to raise specific antibody. The bacterium was identified as Stenotrophomonas malto- philia PM102 by 16S rDNA amplification and sequencing. The 16S rRNA gene sequence has been deposited in the NCBI GenBank with accession number JQ797560. This genus has not been described previously as being capable of TCE degradation. We report for the first time a Stenotrophomonas sp. that grows on TCE as the sole carbon source. Keywords: Trichloroethylene; Sole Carbon Source; Bioremediation 1. Introduction Trichloroethylene (molecular formula: C2HCl3)—a vola- tile, colourless, nonflammable liquid, was discovered by Emil Fischer in 1864 while working on the preparation of tetrachlorethane [1]. Germany began the first commercial production of trichloroethylene in 1910 and the US fol- lowed in 1925. Through the years, the amount of TCE production in the world has increased dramatically. Ac- cording to the World Health Organisation (WHO), TCE is also present in the air we breathe. In 2000, concentra- tions of TCE measured in urban areas worldwide showed background levels between <17 and 109 ng/m3 (actual guidelines recommend 5 ng/m3) [2]. In rural areas, levels between 0.10 and 0.68 μg/m3 have been reported [3] TCE is commonly used for cleaning of metals by vapour degreasing and as a solvent in adhesives, lubricants, pes- ticides, electronics, printing, paper, pulp and textile in- dustries [4]. Pioneered by Imperial chemical industries in Britain, its development was hailed as an anaesthetic revolution. TCE is the most frequently reported soil and groundwater contaminant on the National priority list of the US Environmental Protection Agency [5]. Despite its low water solubility, TCE leaches into the residual gro- undwater. It is highly persistent with a half life of days to several weeks and difficult to degrade. Exposure to TCE is associated with a number of adverse health effects: it is primarily a central nervous system depressant and was found to be carcinogenic in experimental animals [6]. On September 28, 2011, EPA released the final health as- sessment for trichloroethylene (TCE) to the Integrated Risk Information System (IRIS) database, where it has been characterized as carcinogenic to humans and a hu- man noncancer health hazard affecting the kidneys, liver, male reproductive organs and developing foetus. In re- cent years, much focus has been laid on the use of mi- croorganisms for the elimination of TCE as it is com- paratively low-cost and easier than other conventional processes of decontamination. A variety of aerobic bacteria have been reported to degrade the pollutant trichloroethylene (TCE) come- tabolically when they are grown on aliphatic hydrocar- bons [7,8], aromatic hydrocarbons [9-14], ammonium salt [15,16], or propane [17]. There are very few reports of bacterial growth on TCE as the sole carbon and energy source. Kitayama (1997) had reported Pseudomonas aeruginosaJI104 as a potential microbe that can use TCE *Corresponding author. C opyright © 2012 SciRes. AiM 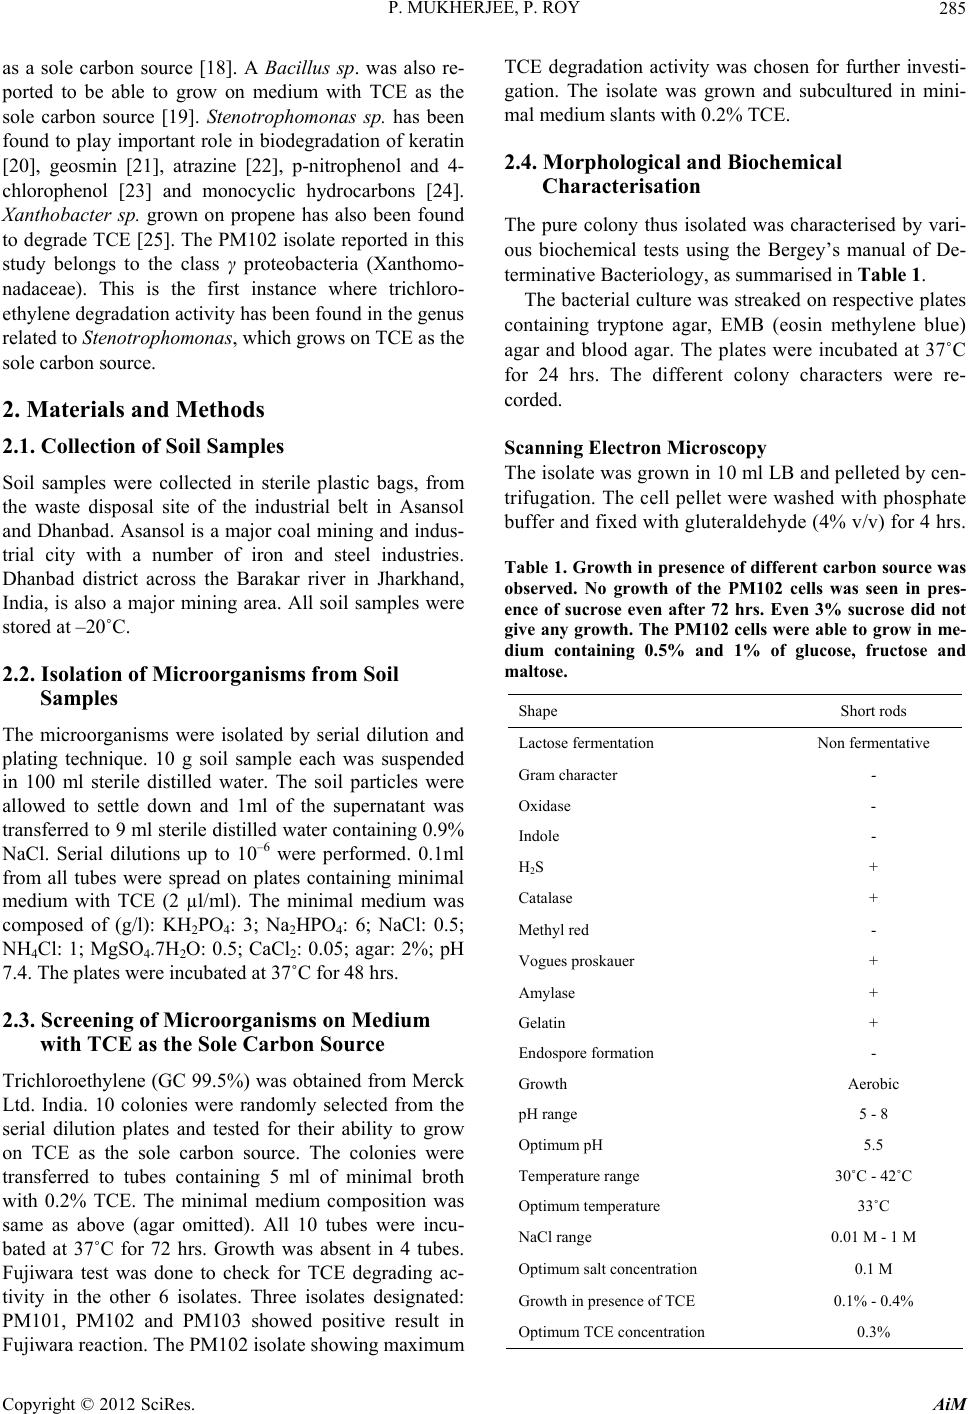 P. MUKHERJEE, P. ROY 285 as a sole carbon source [18]. A Bacillus sp. was also re- ported to be able to grow on medium with TCE as the sole carbon source [19]. Stenotrophomonas sp. has been found to play important role in biodegradation of keratin [20], geosmin [21], atrazine [22], p-nitrophenol and 4- chlorophenol [23] and monocyclic hydrocarbons [24]. Xanthobacter sp. grown on propene has also been found to degrade TCE [25]. The PM102 isolate reported in this study belongs to the class γ proteobacteria (Xanthomo- nadaceae). This is the first instance where trichloro- ethylene degradation activity has been found in the genus related to Stenotrophomonas, which grows on TCE as the sole carbon source. 2. Materials and Methods 2.1. Collection of Soil Samples Soil samples were collected in sterile plastic bags, from the waste disposal site of the industrial belt in Asansol and Dhanbad. Asansol is a major coal mining and indus- trial city with a number of iron and steel industries. Dhanbad district across the Barakar river in Jharkhand, India, is also a major mining area. All soil samples were stored at –20˚C. 2.2. Isolation of Microorganisms from Soil Samples The microorganisms were isolated by serial dilution and plating technique. 10 g soil sample each was suspended in 100 ml sterile distilled water. The soil particles were allowed to settle down and 1ml of the supernatant was transferred to 9 ml sterile distilled water containing 0.9% NaCl. Serial dilutions up to 10–6 were performed. 0.1ml from all tubes were spread on plates containing minimal medium with TCE (2 µl/ml). The minimal medium was composed of (g/l): KH2PO4: 3; Na2HPO4: 6; NaCl: 0.5; NH4Cl: 1; MgSO4.7H2O: 0.5; CaCl2: 0.05; agar: 2%; pH 7.4. The plates were incubated at 37˚C for 48 hrs. 2.3. Screening of Microorganisms on Medium with TCE as the Sole Carbon Source Trichloroethylene (GC 99.5%) was obtained from Merck Ltd. India. 10 colonies were randomly selected from the serial dilution plates and tested for their ability to grow on TCE as the sole carbon source. The colonies were transferred to tubes containing 5 ml of minimal broth with 0.2% TCE. The minimal medium composition was same as above (agar omitted). All 10 tubes were incu- bated at 37˚C for 72 hrs. Growth was absent in 4 tubes. Fujiwara test was done to check for TCE degrading ac- tivity in the other 6 isolates. Three isolates designated: PM101, PM102 and PM103 showed positive result in Fujiwara reaction. The PM102 isolate showing maximum TCE degradation activity was chosen for further investi- gation. The isolate was grown and subcultured in mini- mal medium slants with 0.2% TCE. 2.4. Morphological and Biochemical Characterisation The pure colony thus isolated was characterised by vari- ous biochemical tests using the Bergey’s manual of De- terminative Bacteriology, as summarised in Table 1. The bacterial culture was streaked on respective plates containing tryptone agar, EMB (eosin methylene blue) agar and blood agar. The plates were incubated at 37˚C for 24 hrs. The different colony characters were re- corded. Scanning Electron Microscopy The isolate was grown in 10 ml LB and pelleted by cen- trifugation. The cell pellet were washed with phosphate buffer and fixed with gluteraldehyde (4% v/v) for 4 hrs. Table 1. Growth in presence of different carbon source was observed. No growth of the PM102 cells was seen in pres- ence of sucrose even after 72 hrs. Even 3% sucrose did not give any growth. The PM102 cells were able to grow in me- dium containing 0.5% and 1% of glucose, fructose and maltose. Shape Short rods Lactose fermentation Non fermentative Gram character - Oxidase - Indole - H2S + Catalase + Methyl red - Vogues proskauer + Amylase + Gelatin + Endospore formation - Growth Aerobic pH range 5 - 8 Optimum pH 5.5 Temperature range 30˚C - 42˚C Optimum temperature 33˚C NaCl range 0.01 M - 1 M Optimum salt concentration 0.1 M Growth in presence of TCE 0.1% - 0.4% Optimum TCE concentration 0.3% Copyright © 2012 SciRes. AiM  P. MUKHERJEE, P. ROY 286 After centrifugation, the cells were dehydrated by gradu- ally lowering the concentration of alcohol: 95%, 70%, 50%. Cells were incubated 30 minutes in each of the al- cohol concentrations followed by washing. Finally, the cells were diluted with 50% alcohol. One drop of this cell suspension was placed on a cover slip and studied with Hitachi, S530 SEM at University Science Instrument Centre, Burdwan University (Figures 1(a) and (b)). 2.5. Physiological Characterisation 2.5.1. pH PM102 cells were grown in minimal medium with only TCE as the carbon source (0.2%) at 33˚C. pH was varied from 3 to 13. Optimum pH for growth was determined. pH was rechecked after the experiment. 2.5.2. Temperature PM102 cells were grown in minimal medium with 0.2% peptone and 0.2% TCE and incubated at temperatures ranging from 20˚C to 45°C. Growth was determined by measuring O.D. at 620 nm after 24 hours. (a) (b) Figure 1. (a) Scanning electron micrograph of a single bac- terium PM102; (b) Scanning electron micrograph of a col- ony of PM102. 2.5.3. N aCl Concentration Cells were grown in minimal medium at 33˚C, with salt concentration from 0.01 M to 1 M. Optimum salt con- centration for growth was determined. 2.5.4. TCE Concentration The cells were grown at pH 5 in minimal medium with TCE as the sole carbon source at 33˚C. The amount of TCE added was varied from 0.1% to 0.5%. We know that excess TCE can inhibit growth as it becomes toxic for the bacteria. Thus, how much TCE can be endured by the PM102 isolate was observed. 2.5.5. Growth in Presence of Different Carbon Source The PM102 cells were grown in minimal medium with 0.2%, 0.5% and 1% of each of the carbon source respec- tively: glucose, fructose, maltose and sucrose. The ex- periment was carried out in sidearm flasks and O.D. was taken at 620 nm at 24 hrs, 48 hrs and 72 hrs respectively. 2.6. Identification of the PM102 Isolate by 16 S rRNA Gene Amplification and Sequencing 2.6.1. D NA Extracti on Cells obtained from 30 ml culture were resuspended in lysis buffer [4.5 ml TE buffer, 100 µl 10 mg/ml ly- sozyme, 450 µl of 10% SDS, 10 µl of 20 mg/ml pro- teinase K] and incubated for 1 hour at 37˚C. DNA was purified by phenol chloroform extraction and ethanol precipitation (Sambrook et al. 1989). 2.6.2. 16S rRNA Gene Sequence and Phylogenetic Analysis PCR was carried out by using the universal primers: 27F: 5’ AGA GTT TGA TCC TGG CTC AG 3’ and 1492R: 5’ TAC GGY TAC CTT GTT ACG ACT T 3’. The am- plification conditions were: 94˚ for 3 min for the first step, 30 cycles comprising of 94˚ for 1 min, 52˚ for 45 sec, 72˚ for 1 min and the final extention step of 72˚ for 3 min. The PCR product obtained was purified and sequenced by an automated DNA sequencer. The forward and re- verse sequences were assembled through DNABaser V35.0 software and submitted to GenBank through NCBI online sequence submission tool: Bankit. MEGA5 software was used to construct phylogenetic tree by aligning PM102 sequence with reference sequences ob- tained from NCBI GenBank. 2.7. Determination of TCE Degradation Activity by Fujiwara Test Fujiwara test was performed to calculate the amount of trichloroethylene remaining in the medium inoculated with the PM102 isolate. In this reaction, polychlorinated hydrocarbons, in presence of alkali and pyridine gives a Copyright © 2012 SciRes. AiM  P. MUKHERJEE, P. ROY 287 red coloured compound [26]. PM102 cells were grown in 50 ml King’s B me- dium (Na2HPO4—1 g/l, K2HPO4—3 g/l, NH4Cl—1 g/l, MgSO4·7H2O—0.4 g/l) with 0.2% TCE, at pH 5 and pH 7 respectively. Cells were pelleted by centrifugation and suspended in 10ml phosphate buffer with 0.3% TCE in acetone. As TCE is insoluble in water, it was dissolved in acetone. pH of the buffer was set at pH 5 and pH 7. 2 ml aliquot was taken at the beginning (just after inoculation) and after every 30 minutes interval up to 120 minutes and treated with 2 ml 5N NaOH and 2 ml pyridine fol- lowed by heating at 80˚C for two minutes. Absorbance of the upper red phase was recorded at 470nm by spectro- photometer. A control was set up with E. coli. The result of this test was repeated thrice and mean value of ab- sorbance are given. A standard curve was plotted by varying TCE concentration from 0.01% to 0.48%, from which the amount of TCE remaining at each time point was calculated. 2.8. Monitoring TCE Degradation by Chloride Release As chloride present in minimal medium interferes with this experiment, a chloride free minimal medium— MCl, was formulated (K2HPO4—3 g/l, Na2HPO4—1 g/l, (NH4)2SO4—1 g/l, MgSO4·7H2O—0.4 g/l). 10 drops of 0.3 M K2CrO4 was added to the chloride containing me- dium and titrated against 10 mM AgNO3 taken in a bu- rette. Initially, a white precipitate of AgCl is formed but when free chloride is no longer left in the medium, the solution turns reddish brown due to the formation of Ag2CrO4. The reaction mechanism is: Ag+ + Cl– = AgCl 2Ag+ + = Ag2CrO4 4 CrO PM102 cells were grown in 50 ml of MCl and at pH 5 and pH 7 and harvested by centrifugation. Amount of TCE added in this experiment was kept within the solu- bility range of TCE in water i.e. 1.28 g/l (0.128%). The cells thus obtained were suspended in 10 ml MCl broth with 0.12% TCE at pH 5 and pH 7 respectively and ti- trated against 10 mM AgNO3 after every 3 hrs interval, from 0 hrs (just after suspension) to 30 hrs. A standard curve was plotted by varying the concentration of NaCl from 2 mM to 9 mM, from which the concentration of free chloride released after the respective time intervals were calculated. The experiment was done in triplicate and mean values of the readings are given. 2.9. Protein Profile of the Isolate The cells were grown in 50 ml minimal medium pH 7, with 0.2% peptone, 0.2% TCE + 0.2% peptone and 0.2% TCE respectively at 33˚C for 48 hrs. The cell pellet ob- tained was suspended in 1 ml lysis buffer (10 mM PBS, 1% SDS, 0.1 mM PMSF) for 1 hr at 37˚C. The suspen- sion was centrifuged at 10,000 rpm for 10 minutes at 4˚C and supernatant was collected. Protein content was measured in each sample by Bradford assay. 40 µg of protein was loaded in each well of a 12% gel and SDS PAGE was carried out. The gel was stained with Cooma- ssie Blue R 250 and destained with 30% destaining solu- tion. The gel was observed in the gel documentation sys- tem (Vilbur Lourmat, France) and analysed with Quan- tum Capt software. 2.10. Immunisation of Rabbit to Raise Specific Antibody A single TCE inducible band of 51.6 kDa was cut from the gel and homogenised by crushing with a sterile glass rod in Eppendrof tube containing 500 µl autoclaved wa- ter. A rabbit was injected subcutaneously at 4 to 5 dif- ferent sites with this protein homogenate mixed 1:1 with Freund’s complete adjuvant twice (once per month) fol- lowed by two more injections of the same protein ho- mogenate mixed 1:1 with Freund’s incomplete adjuvant. To check serum antibody titre, dot blot assay was done. 3 µl of the different dilutions (1:10, 1:100 and 1:1000) of antigen i.e., total bacterial protein obtained from TCE + peptone grown cells was spotted onto nylon membrane. 1 mg/ml BSA in different volumes (1 µl, 2 µl, 3 µl) was also spotted on the membrane as control. 2.11. Western Blot The SDS PAGE gel, after electrophoresis (unstained) was electroblotted onto nitrocellulose membrane (Sigma Aldrich USA) at 45 volts for 3 hours. The nitrocellulose membrane was blocked with 3% milk powder for 1 hour at room temperature and washed thrice with buffer A(10 mM tris HCl pH8, 1 mM EDTA pH8, 0.05% tween 20 and 0.9% NaCl), followed by incubation in 1:100 dilu- tion of antiserum in the same buffer, at 4˚C overnight. Then the membrane was washed with buffer A thrice, five minutes each and incubated in 1:15,000 dilution of Goat antirabbit IgG coupled to alkaline phosphatase (Sigma Aldrich USA) in buffer A for 2 hours at room temperature. The membrane was again washed in buffer A, 5 minutes each, for three times and equilibriated for 20 minutes in alkaline phosphatase buffer (100 mM tris HCl pH 9.5, 100 mM NaCl and 5 mM MgCl2). The mem- brane was stained with BCIP/NBT (5-Bromo,4-Chloro, 3-Indolyl phosphate/Nitrobluetetrazolium) in alkaline phosphatase buffer and kept in the dark. 2.12. Preadsorption of the Serum Antibody 10 µl of the peptone grown cellular proteins were spotted on small strips of nitrocellulose membrane and air dried. Copyright © 2012 SciRes. AiM 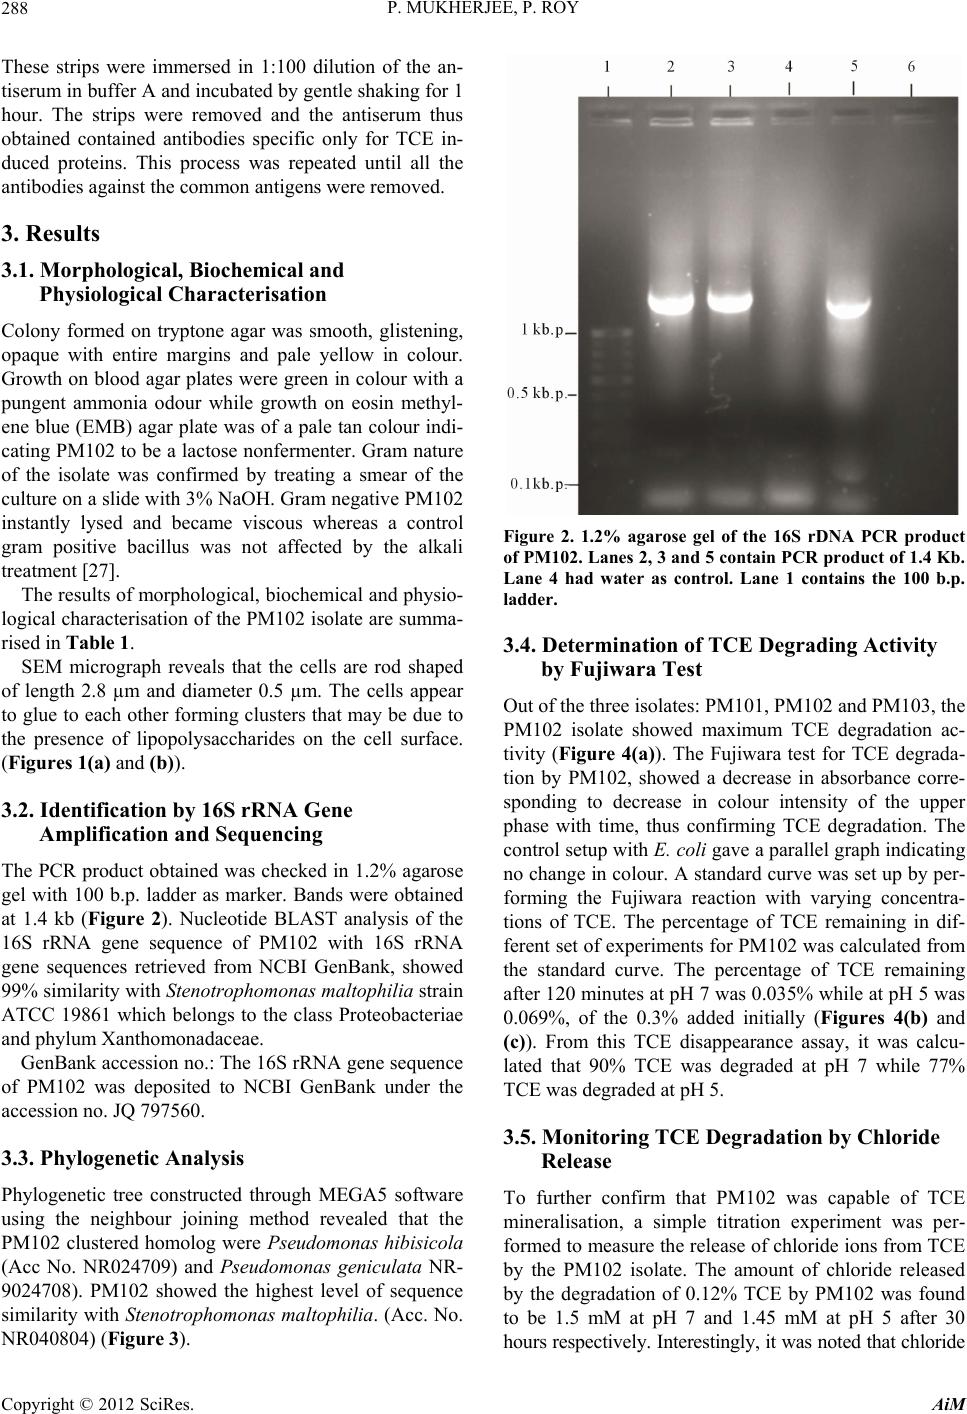 P. MUKHERJEE, P. ROY 288 These strips were immersed in 1:100 dilution of the an- tiserum in buffer A and incubated by gentle shaking for 1 hour. The strips were removed and the antiserum thus obtained contained antibodies specific only for TCE in- duced proteins. This process was repeated until all the antibodies against the common antigens were removed. 3. Results 3.1. Morphological, Biochemical and Physiological Characterisation Colony formed on tryptone agar was smooth, glistening, opaque with entire margins and pale yellow in colour. Growth on blood agar plates were green in colour with a pungent ammonia odour while growth on eosin methyl- ene blue (EMB) agar plate was of a pale tan colour indi- cating PM102 to be a lactose nonfermenter. Gram nature of the isolate was confirmed by treating a smear of the culture on a slide with 3% NaOH. Gram negative PM102 instantly lysed and became viscous whereas a control gram positive bacillus was not affected by the alkali treatment [27]. The results of morphological, biochemical and physio- logical characterisation of the PM102 isolate are summa- rised in Table 1. SEM micrograph reveals that the cells are rod shaped of length 2.8 µm and diameter 0.5 µm. The cells appear to glue to each other forming clusters that may be due to the presence of lipopolysaccharides on the cell surface. (Figures 1(a) and (b)). 3.2. Identification by 16S rRNA Gene Amplification and Sequencing The PCR product obtained was checked in 1.2% agarose gel with 100 b.p. ladder as marker. Bands were obtained at 1.4 kb (Figure 2). Nucleotide BLAST analysis of the 16S rRNA gene sequence of PM102 with 16S rRNA gene sequences retrieved from NCBI GenBank, showed 99% similarity with Stenotrophomonas maltophilia strain ATCC 19861 which belongs to the class Proteobacteriae and phylum Xanthomonadaceae. GenBank accession no.: The 16S rRNA gene sequence of PM102 was deposited to NCBI GenBank under the accession no. JQ 797560. 3.3. Phylogenetic Analysis Phylogenetic tree constructed through MEGA5 software using the neighbour joining method revealed that the PM102 clustered homolog were Pseudomonas hibisicola (Acc No. NR024709) and Pseudomonas geniculata NR- 9024708). PM102 showed the highest level of sequence similarity with Stenotrophomonas maltophilia. (Acc. No. NR040804) (Figure 3). Figure 2. 1.2% agarose gel of the 16S rDNA PCR product of PM102. Lanes 2, 3 and 5 contain PCR product of 1.4 Kb. Lane 4 had water as control. Lane 1 contains the 100 b.p. ladder. 3.4. Determination of TCE Degrading Activity by Fujiwara Test Out of the three isolates: PM101, PM102 and PM103, the PM102 isolate showed maximum TCE degradation ac- tivity (Figure 4(a)). The Fujiwara test for TCE degrada- tion by PM102, showed a decrease in absorbance corre- sponding to decrease in colour intensity of the upper phase with time, thus confirming TCE degradation. The control setup with E. coli gave a parallel graph indicating no change in colour. A standard curve was set up by per- forming the Fujiwara reaction with varying concentra- tions of TCE. The percentage of TCE remaining in dif- ferent set of experiments for PM102 was calculated from the standard curve. The percentage of TCE remaining after 120 minutes at pH 7 was 0.035% while at pH 5 was 0.069%, of the 0.3% added initially (Figures 4(b) and (c)). From this TCE disappearance assay, it was calcu- lated that 90% TCE was degraded at pH 7 while 77% TCE was degraded at pH 5. 3.5. Monitoring TCE Degradation by Chloride Release To further confirm that PM102 was capable of TCE mineralisation, a simple titration experiment was per- formed to measure the release of chloride ions from TCE by the PM102 isolate. The amount of chloride released by the degradation of 0.12% TCE by PM102 was found to be 1.5 mM at pH 7 and 1.45 mM at pH 5 after 30 hours respectively. Interestingly, it was noted that chloride Copyright © 2012 SciRes. AiM 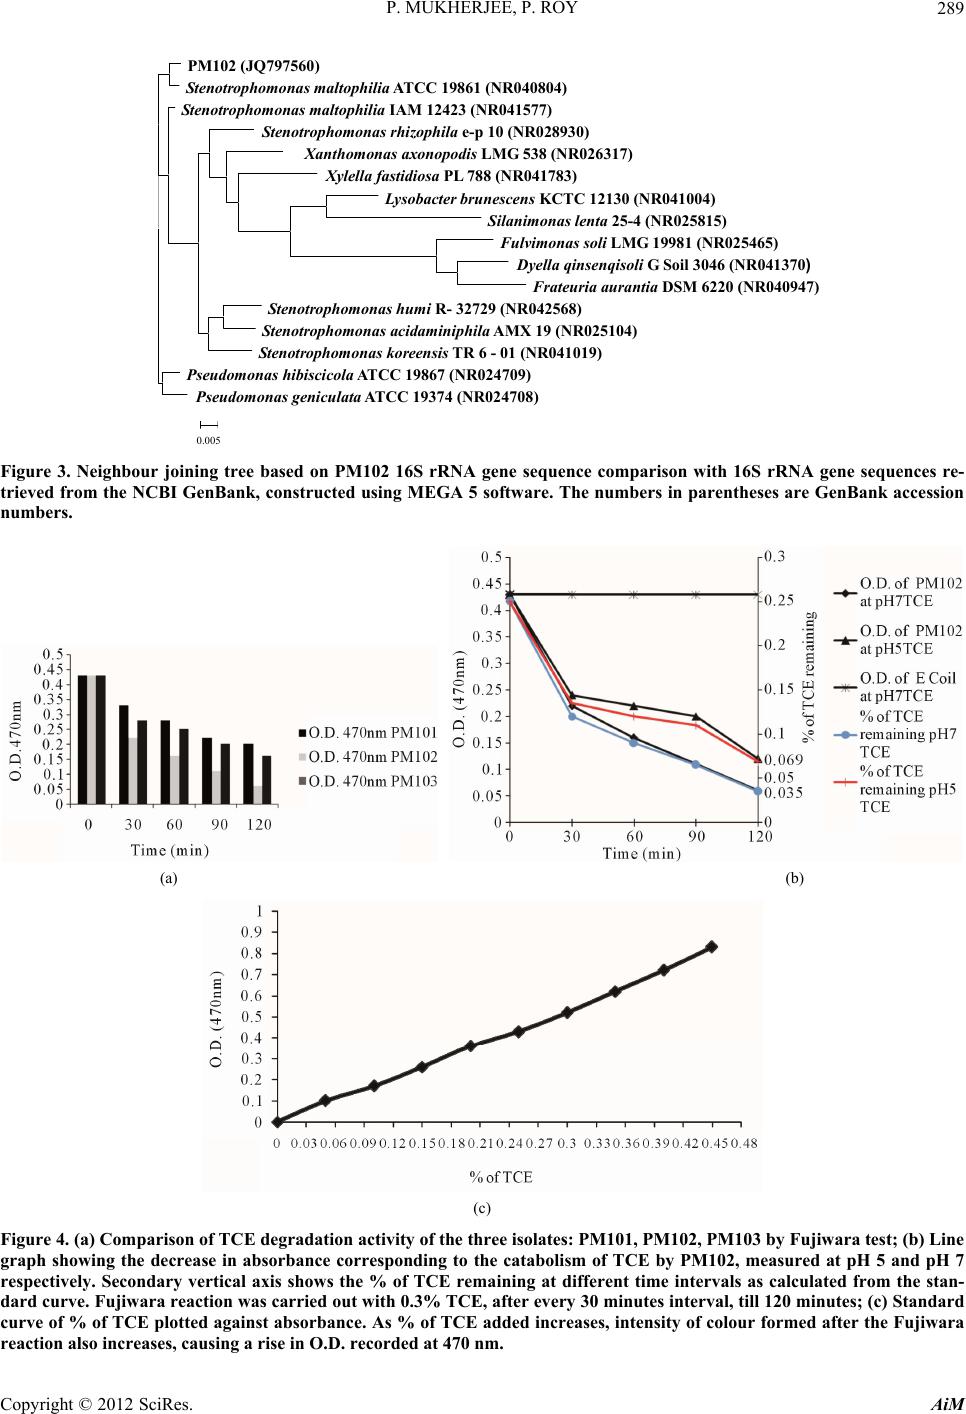 P. MUKHERJEE, P. ROY Copyright © 2012 SciRes. AiM 289 PM102 ( JQ797560) S tenotrophomonas maltophilia A TCC 19861 ( NR040804) Stenotr ophomonas maltophilia IAM 12423 (NR041577) Stenotrophomonas rhizophila e-p 10 (NR028930) Xanthomonas axonopodis LMG 538 (NR026317 ) Xylella fastidiosa PL 788 (NR041783) Lysobacter brunescens KCTC 12130 (NR041004) Silani mona s l enta 25-4 (NR 02 5815) Fulvimonas soli LMG 19981 (NR025465) Dyella qinsenqisoli G Soil 3046 (NR041370) Frateuria aurantiaDSM 6220 (NR040947) Stenotropho monas hu mi R- 32729 (NR042568) Stenotrophomonas acidaminiphila AMX 19 (NR025104) Stenotrophomonas kor eensis TR 6 - 01 (NR041019) Pseudomonas hibiscicola A TCC 19867 (NR024709) Pseudomonas geniculata A TCC 1 9374 ( NR024708) 0.005 Figure 3. Neighbour joining tree based on PM102 16S rRNA gene sequence comparison with 16S rRNA gene sequences re- trieved from the NCBI GenBank, constr ucted using MEGA 5 software. The numbers in pare ntheses are GenBank accession numbers. (a) (b) (c) Figure 4. (a) Comparison of TCE degradation activity of the three isolates: PM101, PM102, PM103 by Fujiwara test; (b) Line graph showing the decrease in absorbance corresponding to the catabolism of TCE by PM102, measured at pH 5 and pH 7 respectively. Secondary vertical axis shows the % of TCE remaining at different time intervals as calculated from the stan- dard curve. Fujiwara reaction was carried out with 0.3% TCE, after every 30 minutes interval, till 120 minutes; (c) Standard curve of % of TCE plotted against absorbance. As % of TCE added increases, intensity of colour formed after the Fujiwara eaction also increases, causing a rise in O.D. recorded at 470 nm. r 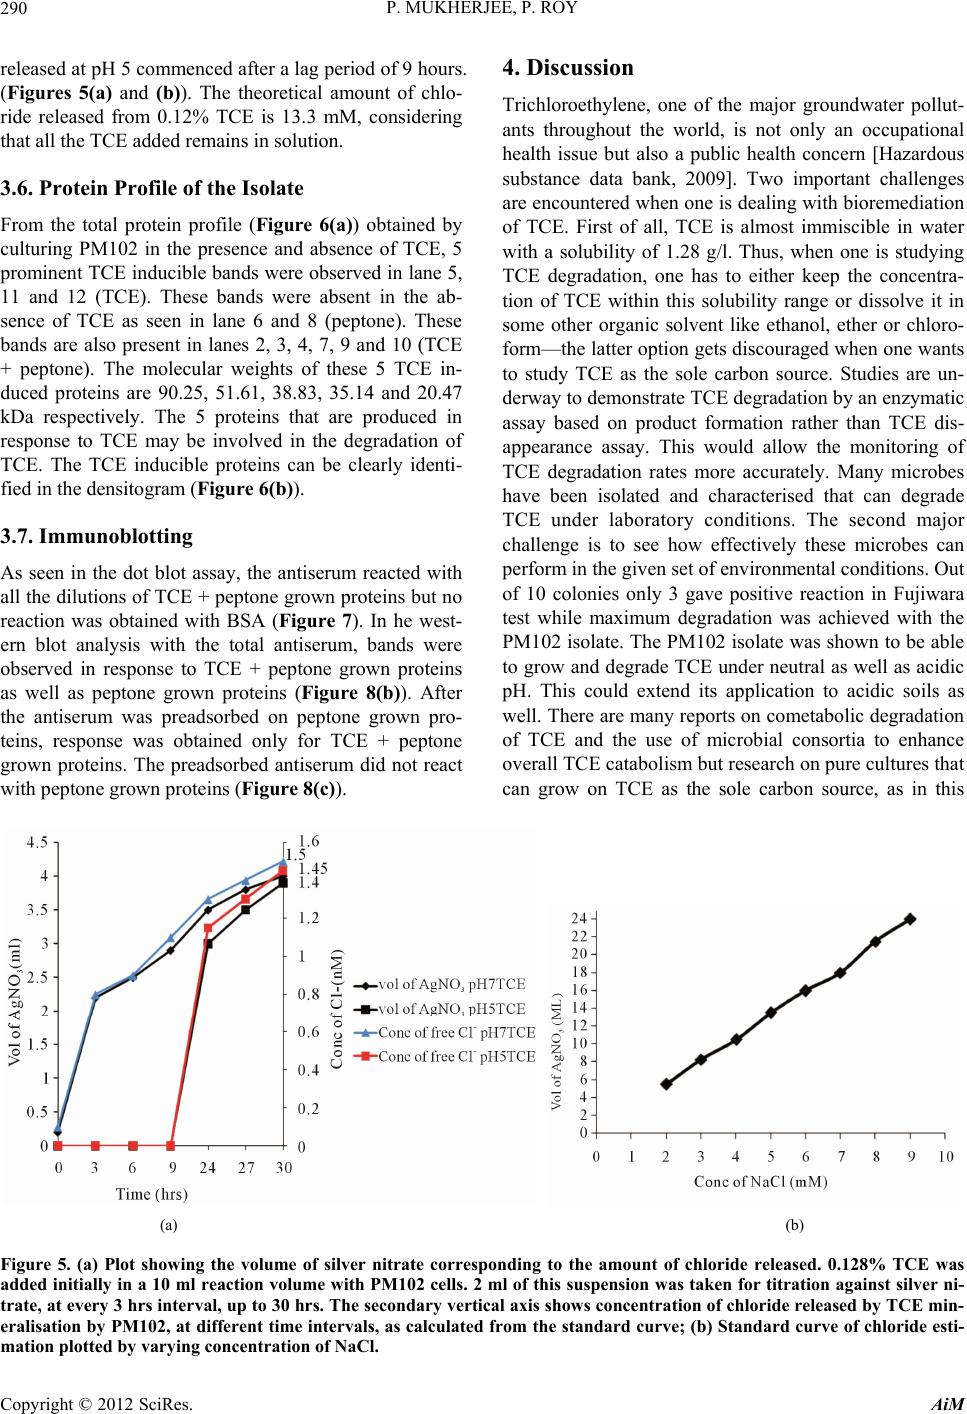 P. MUKHERJEE, P. ROY 290 released at pH 5 commenced after a lag period of 9 hours. (Figures 5(a) and (b)). The theoretical amount of chlo- ride released from 0.12% TCE is 13.3 mM, considering that all the TCE added remains in solution. 3.6. Protein Profile of the Isolate From the total protein profile (Figure 6(a)) obtained by culturing PM102 in the presence and absence of TCE, 5 prominent TCE inducible bands were observed in lane 5, 11 and 12 (TCE). These bands were absent in the ab- sence of TCE as seen in lane 6 and 8 (peptone). These bands are also present in lanes 2, 3, 4, 7, 9 and 10 (TCE + peptone). The molecular weights of these 5 TCE in- duced proteins are 90.25, 51.61, 38.83, 35.14 and 20.47 kDa respectively. The 5 proteins that are produced in response to TCE may be involved in the degradation of TCE. The TCE inducible proteins can be clearly identi- fied in the densitogram (Figure 6(b)). 3.7. Immunoblotting As seen in the dot blot assay, the antiserum reacted with all the dilutions of TCE + peptone grown proteins but no reaction was obtained with BSA (Figure 7). In he west- ern blot analysis with the total antiserum, bands were observed in response to TCE + peptone grown proteins as well as peptone grown proteins (Figure 8(b)). After the antiserum was preadsorbed on peptone grown pro- teins, response was obtained only for TCE + peptone grown proteins. The preadsorbed antiserum did not react with peptone grown proteins (Fig ure 8(c )). 4. Discussion Trichloroethylene, one of the major groundwater pollut- ants throughout the world, is not only an occupational health issue but also a public health concern [Hazardous substance data bank, 2009]. Two important challenges are encountered when one is dealing with bioremediation of TCE. First of all, TCE is almost immiscible in water with a solubility of 1.28 g/l. Thus, when one is studying TCE degradation, one has to either keep the concentra- tion of TCE within this solubility range or dissolve it in some other organic solvent like ethanol, ether or chloro- form—the latter option gets discouraged when one wants to study TCE as the sole carbon source. Studies are un- derway to demonstrate TCE degradation by an enzymatic assay based on product formation rather than TCE dis- appearance assay. This would allow the monitoring of TCE degradation rates more accurately. Many microbes have been isolated and characterised that can degrade TCE under laboratory conditions. The second major challenge is to see how effectively these microbes can perform in the given set of environmental conditions. Out of 10 colonies only 3 gave positive reaction in Fujiwara test while maximum degradation was achieved with the PM102 isolate. The PM102 isolate was shown to be able to grow and degrade TCE under neutral as well as acidic pH. This could extend its application to acidic soils as well. There are many reports on cometabolic degradation of TCE and the use of microbial consortia to enhance overall TCE catabolism but research on pure cultures that can grow on TCE as the sole carbon source, as in this (a) (b) Figure 5. (a) Plot showing the volume of silver nitrate corresponding to the amount of chloride released. 0.128% TCE was added initially in a 10 ml reaction volume with PM102 cells. 2 ml of this suspension was taken for titration against silver ni- trate, at every 3 hrs interval, up to 30 hrs. The secondary vertical axis shows concentration of chloride released by TCE min- eralisation by PM102, at different time intervals, as calculated from the standard curve; (b) Standard curve of chloride esti- mation plotted by varying concentration of NaCl. Copyright © 2012 SciRes. AiM 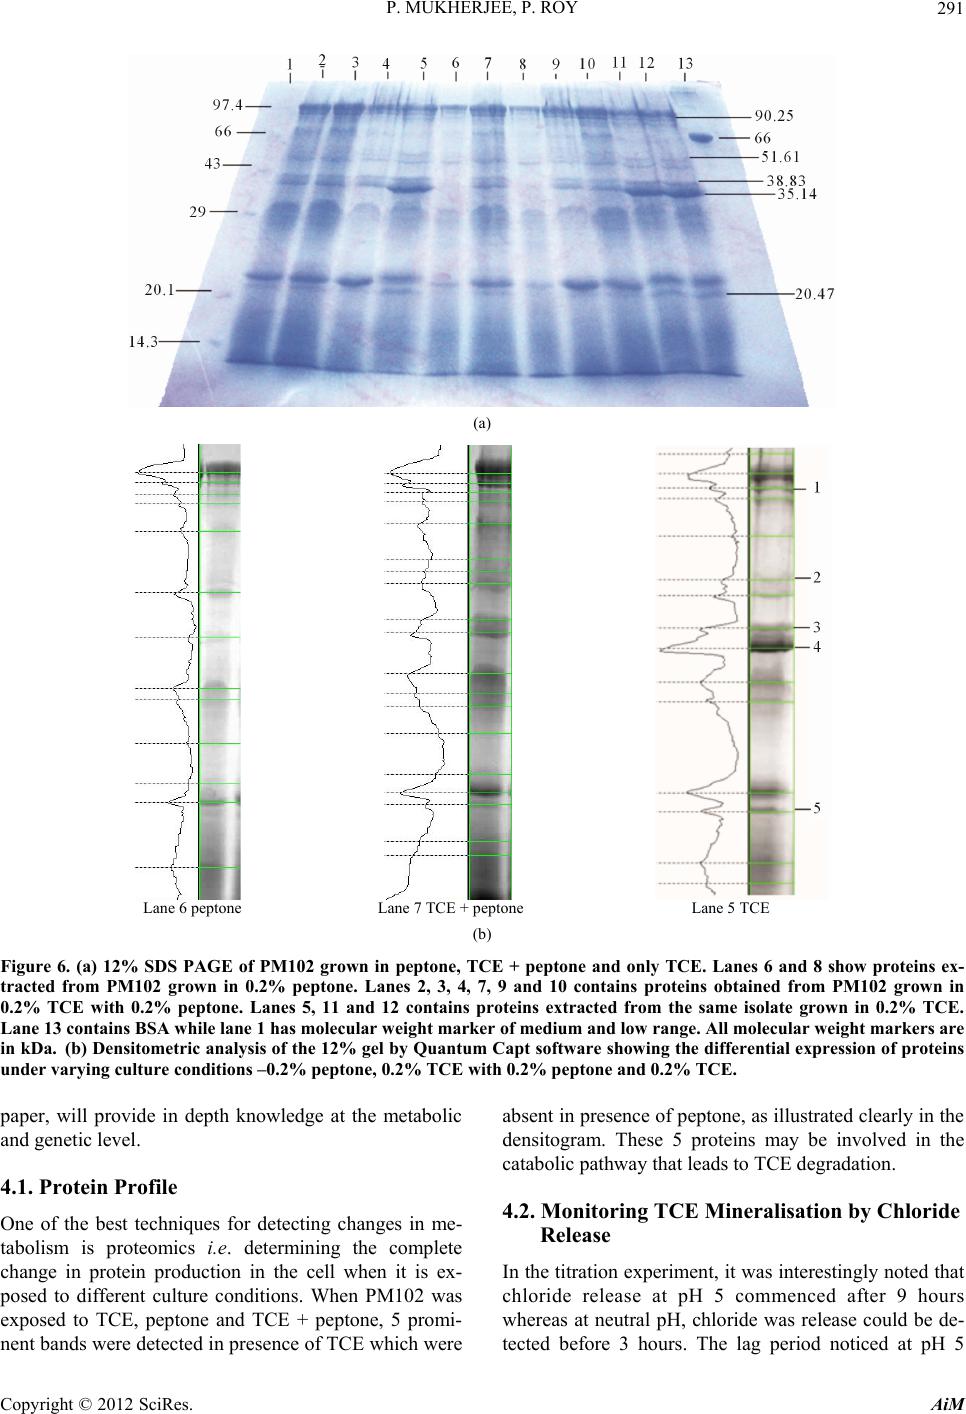 P. MUKHERJEE, P. ROY 291 (a) Lane 6 peptone Lane 7 TCE + peptone Lane 5 TCE (b) Figure 6. (a) 12% SDS PAGE of PM102 grown in peptone, TCE + peptone and only TCE. Lanes 6 and 8 show proteins ex- tracted from PM102 grown in 0.2% peptone. Lanes 2, 3, 4, 7, 9 and 10 contains proteins obtained from PM102 grown in 0.2% TCE with 0.2% peptone. Lanes 5, 11 and 12 contains proteins extracted from the same isolate grown in 0.2% TCE. Lane 13 contains BSA while lane 1 has mole cular weight marker of medium and low range. All molecular weight markers are in kDa. (b) Densitometric analysis of the 12% gel by Quantum Capt software showing the differential expression of proteins under varying culture c onditions –0.2% peptone, 0.2% TCE with 0.2% peptone and 0.2% TCE. paper, will provide in depth knowledge at the metabolic and genetic level. 4.1. Protein Profile One of the best techniques for detecting changes in me- tabolism is proteomics i.e. determining the complete change in protein production in the cell when it is ex- posed to different culture conditions. When PM102 was exposed to TCE, peptone and TCE + peptone, 5 promi- nent bands were detected in presence of TCE which were absent in presence of peptone, as illustrated clearly in the densitogram. These 5 proteins may be involved in the catabolic pathway that leads to TCE degradation. 4.2. Monitoring TCE Mineralisation by Chloride Release In the titration experiment, it was interestingly noted that chloride release at pH 5 commenced after 9 hours whereas at neutral pH, chloride was release could be de- tected before 3 hours. The lag period noticed at pH 5 Copyright © 2012 SciRes. AiM  P. MUKHERJEE, P. ROY 292 coincided with the growth pattern of PM102. The growth of PM102 at pH 5 started after 72 hrs whereas at pH 6 and 7 started after 48hrs. After 72 hrs, growth at pH 5 was more than that of pH 6 and 7. Thus, at pH 5, there was a longer lag period which may be due to the fact that acidic pH poses a stress condition to the growth and survival of the isolate. Many bacteria have been known to produce exopolysaccharides in response to environmental stress like low pH and starvation [28,29]. PM102 produced a creamy white pellicle at pH 5 that turned the medium yellowish. Nature of this suspension was determined to be a polysaccharide by ethanol precipitation. Presence of carbohydrate was confirmed by acid hydrolysis and Molisch test. 4.3. Immunoblotting Western blot analysis carried out with rabbit antisera should have given bands in response to the 51.16 kDa protein (TCE induced) that was injected for immunisa- tion of the rabbit. Somehow, the rabbit antiserum was found to cross react with the 46.84 kDa protein in addi- tion to the 51.16 kDa band. This 46.84 kDa protein is common to both TCE and peptone. Thus, in Western blot with the total antisera, the nitrocellulose membrane re- vealed bands in lane containing proteins from TCE + peptone grown cells as well as only peptone grown cells. When the antiserum was preadsorbed with peptone grown cellular proteins, all the common antibodies were removed. The preadsorbed antiserum contained antibod- ies specific to the 51.16 kDa TCE induced protein and thus did not give any signal in response to the peptone grown cellular antigen. This gives a definite proof that the PM102 isolate does actually express proteins that are specific for TCE degradation. Figure 7. Dot blot assay. Spots 1, 2, 3 contained 3 µl of the different dilutions of Ag (TCE + peptone grown proteins). Spots A, B, C had 1 µl, 2 µl and 3 µl of 1mg/ml BSA. (a) (b) (c) Figure 8. (a) 12% SDS PAGE. Lane 1: Molecular weight marker, Lanes 2, 3, 4: TCE + peptone, Lane 5: TCE and Lane 6: peptone. Molecular weights of protein markers are in kDa; (b) Western blot with total antiserum. Bands seen for TCE + peptone as well as peptone grown proteins; (c) Western blot with antiserum Preadsorbed on peptone grown proteins. Band een against TCE + peptone grown proteins. No reaction against peptone grown proteins. s Copyright © 2012 SciRes. AiM  P. MUKHERJEE, P. ROY 293 5. Conclusions The isolate PM102 was capable of degrading 90% TCE at pH 7 after 48 hours of growth and 77% TCE at pH 5 after 72 hours of growth. Chloride release due to the mineralisation of TCE by PM102 was also monitored over a 30 hours time period. Through polyphasic identi- fication strategy [30], this TCE degrader was found to be a gram negative, non lactose fermenting Xanthomonad, highly similar (99%) to Stenotrophomonas sp. By study- ing changes in total protein expression of this isolate un- der different culture conditions, 5 distinguishable TCE induced bands were observed that were not present in presence of some other carbon source such as peptone. These differentially expressed proteins pinpoint towards a complex catabolic pathway involving different multi- component enzyme systems that may be involved in TCE degradation. There is a proposed pathway of TCE deg- radation but the exact mechanism is still unknown [31]. Further attempts will be made to isolate the genes re- sponsible for TCE degradation and to unravel the degra- dation mechanism in detail. Thus, this novel isolate proves to be a promising bio- remediation tool for eradicating a potential carcinogen like trichloroethylene from our environment. 6. Acknowledgements This research work was supported by The Department of Science and Technology (DST), New Delhi, India. The authors sincerely thank DST for the grant of INSPIRE fellowship (Innovation in Science Pursuit for Inspired Research). We also acknowledge Mrigendranath Mondal endowment to our Department. REFERENCES [1] J. Parkhouse, “Trichloroethylene,” British Journal of An- aesthesia, Vol. 37, No. 9, 1965, pp. 681-687. doi:10.1093/bja/37.9.681 [2] Fact Sheet, “Trichloroethene in Indoor and Outdoor Air,” New York State Department of Health, 2005. http://www.victorny.org/Data/FileManager/PageDownloa ds/Town/Modock/TCE_Facts.pdf [3] Chapter 5.15, “Trichloroethylene, Air Quality Guide- Lines,” World Health Organization, 2000. http://www.euro.who.int/document/aiq/5_15trichloroethyl ene.pdf [4] “Documentation of Threshold Limit Values and Biologi- cal Exposure Indices,” 6th Edition, American Conference of Governmental Industrial Hygienists, Cincinnati, 1991. [5] “Substances Found at Proposed and Final NPL Sites through Update Number Three,” US Environmental Pro- tection Agency, Washington DC, 1985, Document NPL- U3-6-3. [6] G. J. Hathaway, N. H. Proctor, J. P. Huges and M. L. Fischman, “Chemical Hazards of the Workplace,” 3rd Edition, Van Nostrand Reinhold, New York, 1991. [7] R. Oldenhuis, R. L. J. M. Vink, D. B. Janssen and B. Witholt, “Degradation of Chlorinated Aliphatic Hydro- carbons by Methylosinus trichosporium OB3b Expressing Soluble Methane Monooxygenase,” Applied and Envi- ronmental Microbiology, Vol. 55, No. 11, 1981, pp. 2819- 2826. [8] Alvarez-Cohen and P. L. McCarty, “Product Toxicity and Cometabolic Competitive Inhibition Modeling of Chlo- roform and Trichloroethylene Transformation by Metha- notrophic Resting Cells,” Applied and Environmental Mi- crobiology, Vol. 57, No. 4, 1991, pp. 1031-1037. [9] K. J. Malachowsky, T. J. Phelps, A. B. Teboli, D. E. Min- nikin and D. C. White, “Aerobic Mineralization of Tri- chloroethylene, Vinyl Chloride, and Aromatic Compo- unds by Rhodococcus Species,” Applied and Environ- mental Microbiology, Vol. 60, No. 2, 1994, pp. 542-548. [10] M. J. K. Nelson, S. O. Montgomery and P. H. Pritchard, “Trichloroethylene Metabolism by Microorganisms That Degrade Aromatic Compounds,” Applied and Environ- mental Microbiology, Vol. 54, No. 6, 1988, pp. 604-606. [11] Y. Kamagata, T. Kanagawa, R. Kurane, H. Zhang, S. Hanada, T. Shigematsu and K. Shibuya, “Burkholderia kururiensis sp. nov., a Trichloroethylene (TCE)-Degrad- ing Bacterium Isolated from an Aquifer Polluted with TCE,” International Journal of Systematic and Evolu- tionary Microbiology, Vol. 50, No. 2, 2000, pp.743-749. doi:10.1099/00207713-50-2-743 [12] B. R. Folsom, P. J. Chapman and P. H. Pritchard, “Phenol and Trichloroethylene Degradation by Pseudomonas ce- pacia G4: Kinetics and Interactions between Substrates,” Applied and Environmental Microbiology, Vol. 56, No. 5, 1990, pp. 1279-1285. [13] L. P. Wackett and D. T. Gibson, “Degradation of Tri- chloroethylene by Toluene dioxygenase in Whole-Cell Studies with Pseudomonas putida Fl,” Applied and Envi- ronmental Microbiology, Vol. 54, No. 7, 1988, pp. 1703- 1708. [14] M. S. Shields and M. J. Reagin, “Selection of a Pseudo- monas cepacia Strain Constitutive for the Degradation of Trichloroethylene,” Applied and Environmental Microbi- ology, Vol. 58, No. 12, 1992, pp. 3977-3983. [15] M. E. Rasche, M. R. Hyman and D. J. Arp, “Factors Lim- iting Aliphatic Chlorocarbon Degradation by Nitrosomo- nas europaea: Cometabolic Inactivation of Ammonia Monooxygenase and Substrate Specificity,” Applied and Environmental Microbiology, Vol. 57, No. 10, 1991, pp. 2986-2994. [16] D. Arciero, T. Vannelli, M. Logan and A. B. Hooper, “Degradation of Trichloroethylene by the Ammonia- Oxidizing Bacterium, Nitrosonionas europaea,” Bioche- mical and Biophysical Research Communications, 1989, Vol. 159, No. 2, pp. 640-643. doi:10.1016/0006-291X(89)90042-9 [17] L. P. Wackett, G. A. Brusseau, S. R. Householder and R. S. Hanson, “Survey of Microbial Oxygenases: Trichloro- ethylene Degradation by Propane-Oxidizing Bacteria,” Copyright © 2012 SciRes. AiM  P. MUKHERJEE, P. ROY 294 Applied and Environmental Microbiology, Vol. 55, No. 11, 1989, pp. 2960-2964. [18] P. Pant and S. Pant, “A Review: Advances in Microbial Remediation of Trichloroethylene (TCE),” Journal of En- vironmental Sciences, Vol. 22, No. 1, 2010, pp. 16-126. doi:10.1016/S1001-0742(09)60082-6 [19] K. Dey and P. Roy, “Degradation of Trichloroethylene by Bacillus sp.: Isolation Strategy, Strain Characteristics, and Cell Immobilization,” Current Microbiology, Vol. 59, No. 3, 2009, pp. 256-260. doi:10.1007/s00284-009-9427-6 [20] S. Yamamura, Y. Morita, Q. Hasan, K. Yokoyama and E. Tamiya, “Keratin Degradation: A Cooperative Action of Two Enzymes from Stenotrophomonas sp.,” Biochemical and Biophysical Research Communications, Vol. 294, No. 5, 2002, pp. 1138-1143. doi:10.1016/S0006-291X(02)00580-6 [21] B.-H. Zhou, R.-F. Yuan, C.-H. Shi, L.-Y. Yu, J.-N. Gu and C.-L. Zhang, “Biodegradation of Geosmin in Drink- ing Water by Novel Bacteria Isolated from Biologically Active Carbon,” Journal of Environmental Sciences, Vol. 23, No. 5, 2011, pp. 816-823. doi:10.1016/S1001-0742(10)60458-5 [22] S. Rousseaux, A. Hartmann and G. Soulas, “Isolation and Characterization of New Gram-Negative and Gram-Posi- tive Atrazine Degrading Bacteria from Different French Soils: Sandrine,” FEMS Microbiology Ecology, Vol. 36, No. 2-3, 2001, pp. 211-222. doi:10.1111/j.1574-6941.2001.tb00842.x [23] Z. Liu, C. Yang and C. Qiao, “Biodegradation of p-Ni- trophenol and 4-Chlorophenol by Stenotrophomonas sp.,” FEMS Microbiology Ecology, Vol. 277, No. 2, 2007, pp. 150-156. doi:10.1111/j.1574-6968.2007.00940.x [24] G. Urszula, G. Izabela, W. Danuta and L. Sylwia, “Isola- tion and Characterization of a Novel Strain of Stenotro- phomonas maltophilia Possessing Various Dioxygenases for Monocyclic Hydrocarbon Degradation,” Brazilian Journal of Microbiology, Vol. 40, No. 2, 2009, pp. 285- 291. [25] M. W. Reij, J. Kieboom, J. A. M. De Bont and S. Hart- mans, “Continuous Degradation of Trichloroethylene by Xanthobacter sp. Strain Py2 during Growth on Propene,” Applied and Environmental Microbiology, Vol. 61, No. 8, 1995, pp. 2936-2942. [26] M. S. Moss and H. J. Rylance, “The Fujiwara Reaction: Some Observation on the Mechanism,” Nature, 1966, Vol. 210, pp. 945-946. doi:10.1038/210945a0 [27] T. Gregersen, “Rapid Method for Distinction of Gram Negative from Gram Positive Bacteria,” Applied Micro- biology and Biotechnology, Vol. 5, No. 2, 1978, pp. 123- 127. [28] C. C. Ling, “Bacterial Polysaccharides: Current Innova- tions and Future Trends,” Caister Academic Press, Nor- folk, 1999. [29] M. Dilworth, F. G. Rynne, J. M. Castelli, A. I. Vivas- Marfisi and A. R. Glennt, “Survival and Exopolysaccha- ride Production in Sinorhizobium rneliloti WSM419 Are Affected by Calcium and Low pH,” Microbi ology , Vol. 145, 1999, pp. 1585-1593. [30] P. Van Damme, B. Pot, M. Gillis, P. Devos, K. Kersters and J. Swings, “Polyphasic Taxonomy, a Consensus Ap- proach to Bacterial Systematic,” Microbiological Reviews, Vol. 60, No. 2, pp. 407-438. [31] M. Whittaker, D. Monroe, D. Junoh and S. Anderson, “TCE Degradation Pathway,” 2006. http://unbbd.msi.umm.edu Copyright © 2012 SciRes. AiM
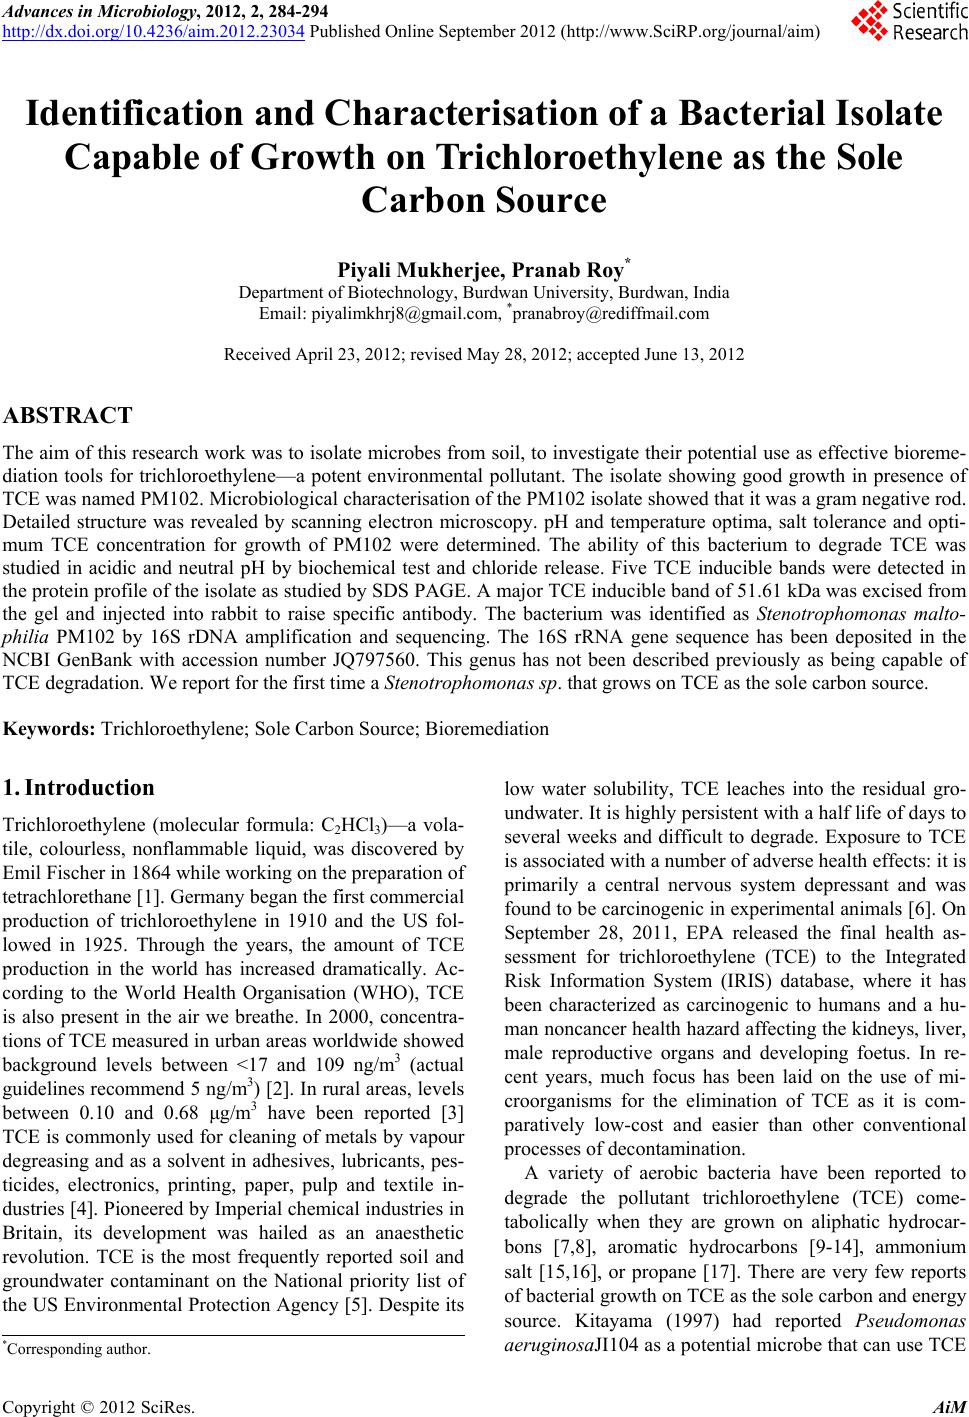
|