Paper Menu >>
Journal Menu >>
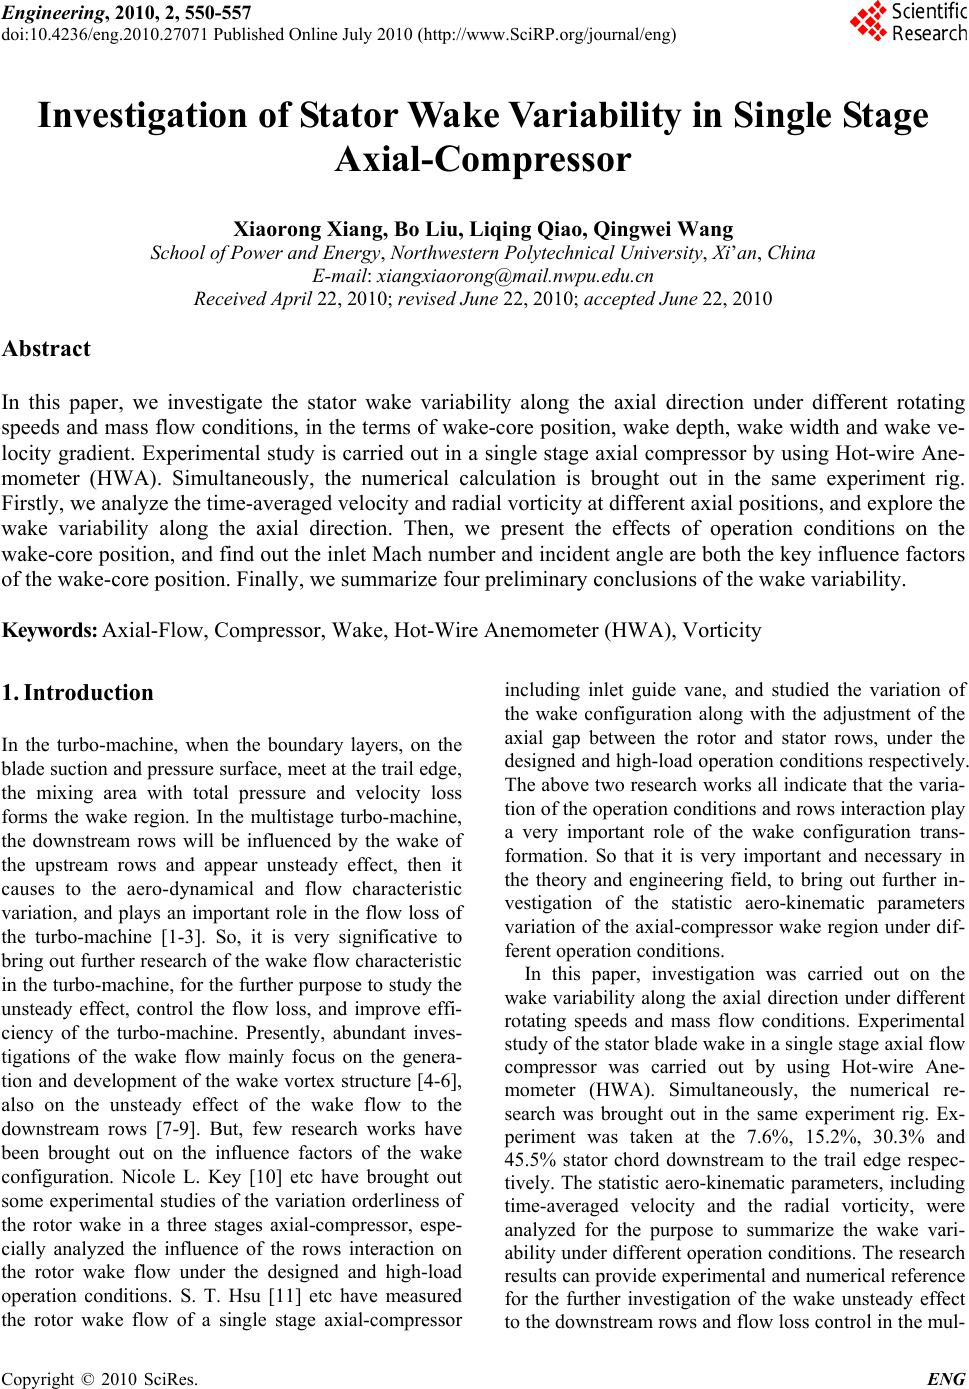 Engineering, 2010, 2, 550-557 doi:10.4236/eng.2010.27071 Published Online July 2010 (http://www.SciRP.org/journal/eng) Copyright © 2010 SciRes. ENG Investigation of Stator Wake Variability in Single Stage Axial-Compressor Xiaorong Xiang, Bo Liu, Liqing Qiao, Qingwei Wang School of Power and Energy, Northwestern Polytechnical University, Xi’an, China E-mail: xiangxiaorong@mail.nwpu.edu.cn Received April 22, 2010; revised June 22, 2010; accepted June 22, 2010 Abstract In this paper, we investigate the stator wake variability along the axial direction under different rotating speeds and mass flow conditions, in the terms of wake-core position, wake depth, wake width and wake ve- locity gradient. Experimental study is carried out in a single stage axial compressor by using Hot-wire Ane- mometer (HWA). Simultaneously, the numerical calculation is brought out in the same experiment rig. Firstly, we analyze the time-averaged velocity and radial vorticity at different axial positions, and explore the wake variability along the axial direction. Then, we present the effects of operation conditions on the wake-core position, and find out the inlet Mach number and incident angle are both the key influence factors of the wake-core position. Finally, we summarize four preliminary conclusions of the wake variability. Keywords: Axial-Flow, Compressor, Wake, Hot-Wire Anemometer (HWA), Vorticity 1. Introduction In the turbo-machine, when the boundary layers, on the blade suction and pressure surface, meet at the trail edge, the mixing area with total pressure and velocity loss forms the wake region. In the multistage turbo-machine, the downstream rows will be influenced by the wake of the upstream rows and appear unsteady effect, then it causes to the aero-dynamical and flow characteristic variation, and plays an important role in the flow loss of the turbo-machine [1-3]. So, it is very significative to bring out further research of the wake flow characteristic in the turbo-machine, for th e further purpose to study the unsteady effect, control the flow loss, and improve effi- ciency of the turbo-machine. Presently, abundant inves- tigations of the wake flow mainly focus on the genera- tion and development of the wake vortex structure [4-6], also on the unsteady effect of the wake flow to the downstream rows [7-9]. But, few research works have been brought out on the influence factors of the wake configuration. Nicole L. Key [10] etc have brought out some experimental studies of the variation orderliness of the rotor wake in a three stages axial-compressor, espe- cially analyzed the influence of the rows interaction on the rotor wake flow under the designed and high-load operation conditions. S. T. Hsu [11] etc have measured the rotor wake flow of a single stage axial-compressor including inlet guide vane, and studied the variation of the wake configuration along with the adjustment of the axial gap between the rotor and stator rows, under the designed and hig h-load operation conditions respectively. The above two research works all indicate that the varia- tion of the operation conditio ns and rows interactio n play a very important role of the wake configuration trans- formation. So that it is very important and necessary in the theory and engineering field, to bring out further in- vestigation of the statistic aero-kinematic parameters variation of the axial-compressor wake region under dif- ferent operation cond itions. In this paper, investigation was carried out on the wake variability along the axial direction under different rotating speeds and mass flow conditions. Experimental study of the stator blade wake in a single stage axial flow compressor was carried out by using Hot-wire Ane- mometer (HWA). Simultaneously, the numerical re- search was brought out in the same experiment rig. Ex- periment was taken at the 7.6%, 15.2%, 30.3% and 45.5% stator chord downstream to the trail edge respec- tively. The statistic aero-kinematic parameters, including time-averaged velocity and the radial vorticity, were analyzed for the purpose to summarize the wake vari- ability under different operation conditions. The research results can provide experimental and numerical reference for the further investigation of the wake unsteady effect to the downstrea m rows and flow loss con trol in th e mul- 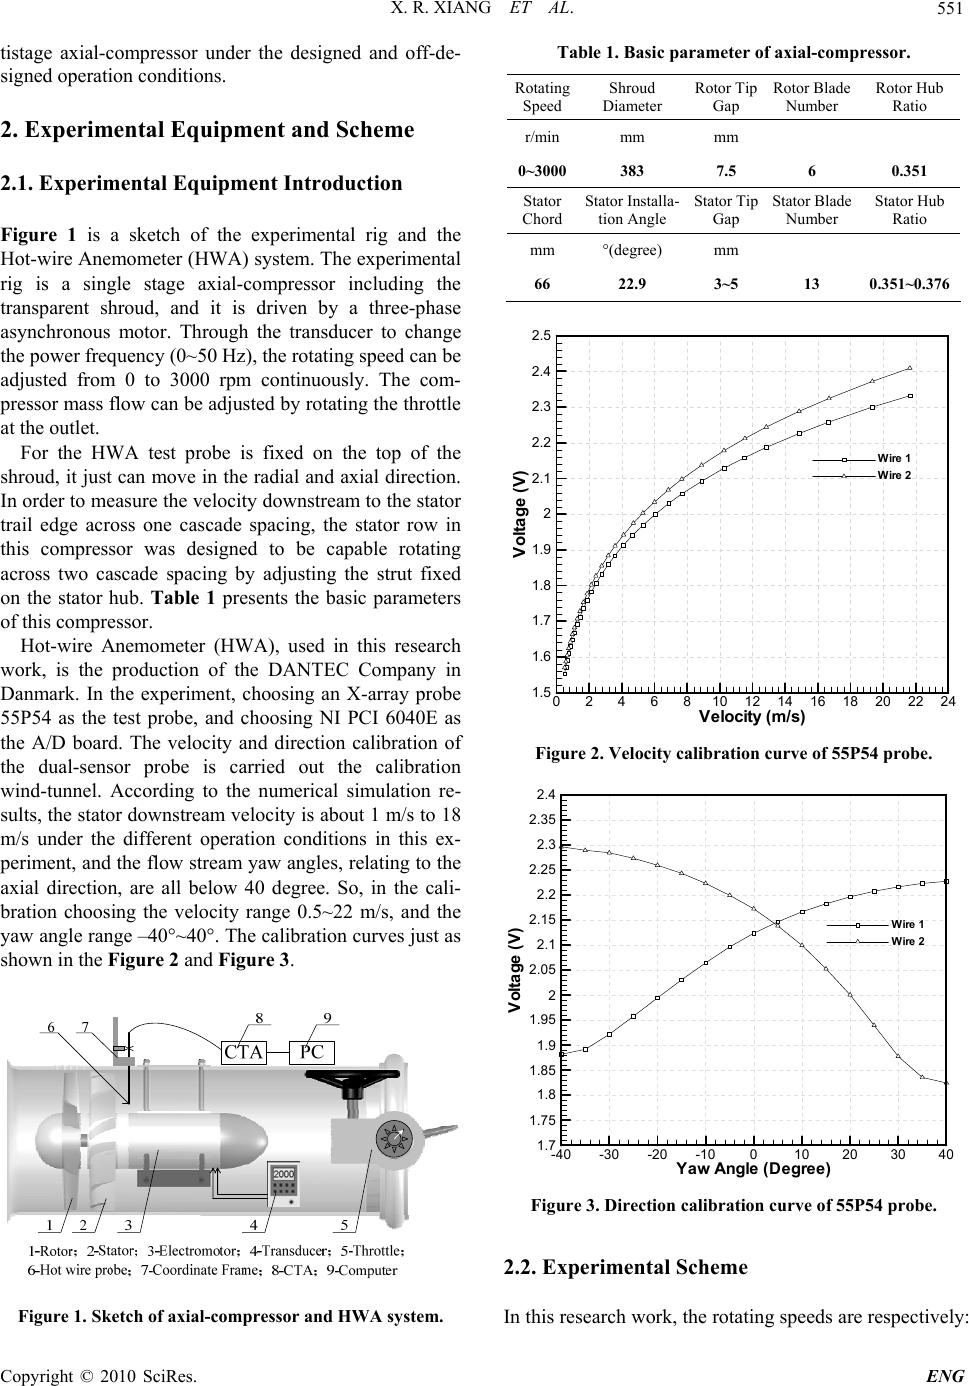 X. R. XIANG ET AL.551 tistage axial-compressor under the designed and off-de- signed operation conditions. 2. Experimental Equipment and Scheme 2.1. Experimental Equipment Introduction Figure 1 is a sketch of the experimental rig and the Hot-wire Anemometer (HWA) system. The experimental rig is a single stage axial-compressor including the transparent shroud, and it is driven by a three-phase asynchronous motor. Through the transducer to change the power frequency (0~50 Hz), the rotating speed can be adjusted from 0 to 3000 rpm continuously. The com- pressor mass flow can be adjusted by ro tating the throttle at the outlet. For the HWA test probe is fixed on the top of the shroud, it just can move in the radial and axial d irection. In order to measure the velocity downstream to the stator trail edge across one cascade spacing, the stator row in this compressor was designed to be capable rotating across two cascade spacing by adjusting the strut fixed on the stator hub. Table 1 presents the basic parameters of this compressor. Hot-wire Anemometer (HWA), used in this research work, is the production of the DANTEC Company in Danmark. In the experiment, choosing an X-array probe 55P54 as the test probe, and choosing NI PCI 6040E as the A/D board. The velocity and direction calibration of the dual-sensor probe is carried out the calibration wind-tunnel. According to the numerical simulation re- sults, the stator downstream velocity is about 1 m/s to 18 m/s under the different operation conditions in this ex- periment, and the flow stream yaw angles, relating to the axial direction, are all below 40 degree. So, in the cali- bration choosing the velocity range 0.5~22 m/s, and the yaw angle range –40°~40 °. The calibration curves just as shown in the Figure 2 and Figure 3. Figure 1. Sketch of axial-compressor and HWA system. Table 1. Basic parameter of axial-compressor. Rotating Speed Shroud Diameter Rotor Tip Gap Rotor Blade Number Rotor Hub Ratio r/min mm mm 0~3000383 7.5 6 0.351 Stator Chord Stator Insta lla- tion Angle Stator Tip Gap Stator Blade Number Stator Hub Ratio mm °(degree) mm 66 22.9 3~5 13 0.351~0.376 Velocity(m/s) Voltage (V) 0246810 12 14 16 18 20 22 24 1.5 1.6 1.7 1.8 1.9 2 2.1 2.2 2.3 2.4 2.5 Wire 2 Wire 1 Figure 2. Velocity calibration curve of 55P54 probe. Yaw Angle (Degree) Voltage(V) -40 -30 -20 -10010 20 30 40 1.7 1.75 1.8 1.85 1.9 1.95 2 2.05 2.1 2.15 2.2 2.25 2.3 2.35 2.4 Wire 2 Wire 1 Figure 3. Direction calibration curve of 55P54 probe. 2.2. Experimental Scheme In this research work, the rotating speeds are respectively: Copyright © 2010 SciRes. ENG 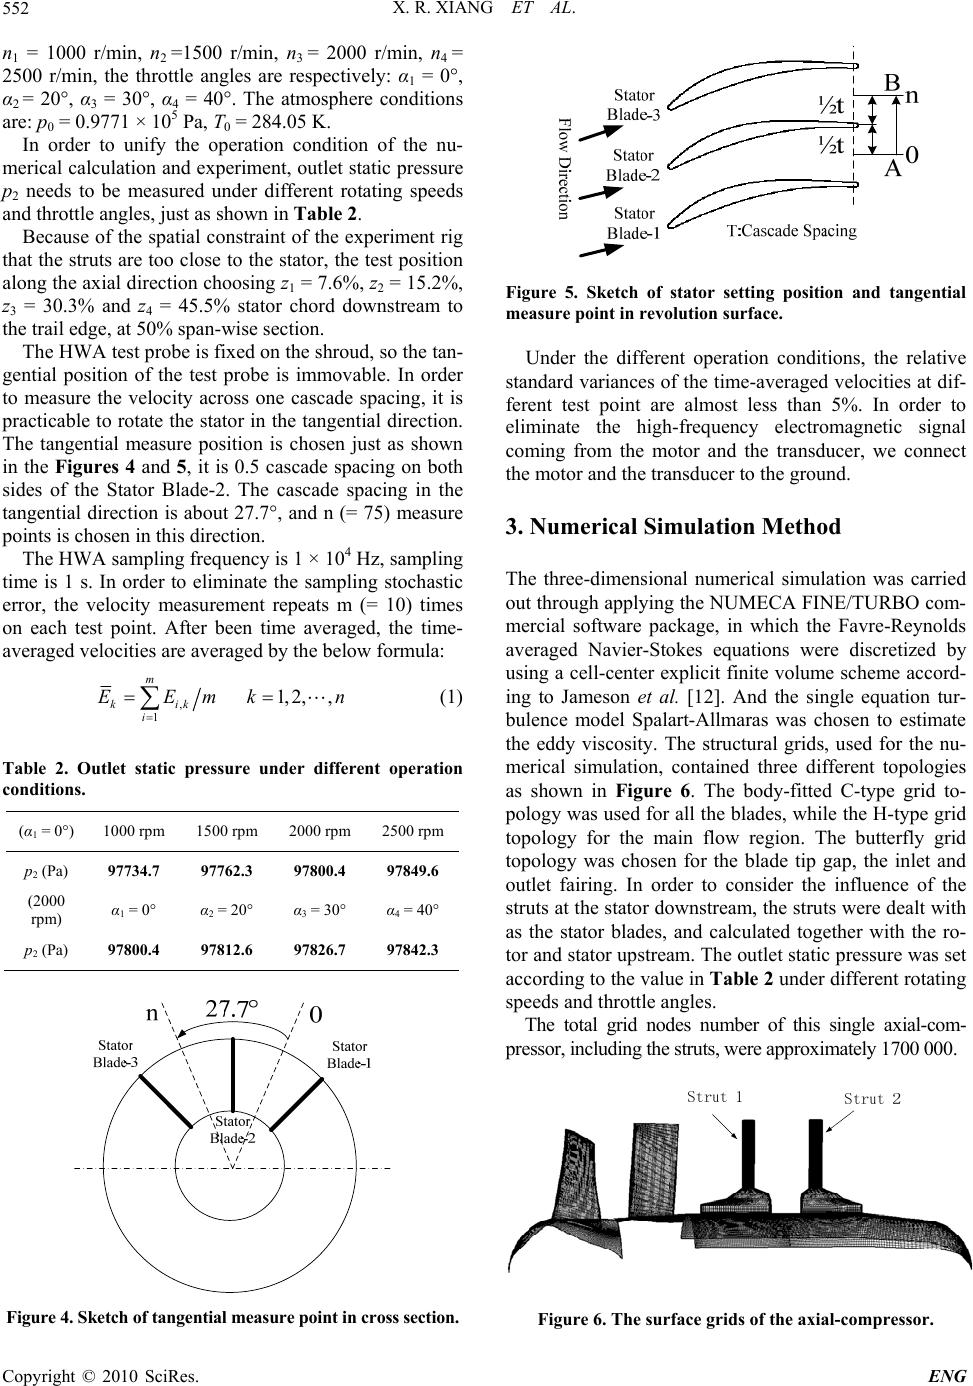 X. R. XIANG ET AL. 552 n1 = 1000 r/min, n2 =1500 r/min, n3 = 2000 r/min, n4 = 2500 r/min, the throttle angles are respectively: α1 = 0°, α2 = 20°, α3 = 30°, α4 = 40°. The atmosphere conditions are: p0 = 0.9771 × 10⁵ Pa, T0 = 284.05 K. In order to unify the operation condition of the nu- merical calculation and experiment, outlet static pressure p2 needs to be measured under different rotating speeds and throttle angles, just as shown in Table 2. Because of the spatial constraint of the experiment rig that the struts are too close to the stator, the test position along the axial dir ection choosing z1 = 7.6%, z2 = 15.2%, z3 = 30.3% and z4 = 45.5% stator chord downstream to the trail edge, at 50% span-wise section. The HWA test probe is fixed on the shroud, so the tan- gential position of the test probe is immovable. In order to measure the velocity across one cascade spacing, it is practicable to rotate the stato r in the tangential direction. The tangential measure position is chosen just as shown in the Figures 4 and 5, it is 0.5 cascade spacing on both sides of the Stator Blade-2. The cascade spacing in the tangential direction is about 27.7°, and n (= 75) measure points is chosen in this direction. The HWA sampling frequency is 1 × 10⁴ Hz, sampling time is 1 s. In order to eliminate the sampling stochastic error, the velocity measurement repeats m (= 10) times on each test point. After been time averaged, the time- averaged velocities are av eraged by the below formula: , 11, 2,, m kik i EEmk n (1) Table 2. Outlet static pressure under different operation conditions. (α1 = 0°) 1000 rpm 1500 rpm 2000 rpm 2500 rpm p2 (Pa) 97734.7 97762.3 97800.4 97849.6 (2000 rpm) α1 = 0° α2 = 20° α3 = 30° α4 = 40° p2 (Pa) 97800.4 97812.6 97826.7 97842.3 Figure 4. Sketch of tangential measure point in cross section. Figure 5. Sketch of stator setting position and tangential measure point in revolution surface. Under the different operation conditions, the relative standard variances of the time-averaged velocities at dif- ferent test point are almost less than 5%. In order to eliminate the high-frequency electromagnetic signal coming from the motor and the transducer, we connect the motor and the transducer to the gro und. 3. Numerical Simulation Method The three-dimensional numerical simulation was carried out through applying the NUMECA FINE/TURBO com- mercial software package, in which the Favre-Reynolds averaged Navier-Stokes equations were discretized by using a cell-center explicit finite volume scheme accord- ing to Jameson et al. [12]. And the single equation tur- bulence model Spalart-Allmaras was chosen to estimate the eddy viscosity. The structural grids, used for the nu- merical simulation, contained three different topologies as shown in Figure 6. The body-fitted C-type grid to- pology was used for all the blades, while the H-type grid topology for the main flow region. The butterfly grid topology was chosen for the blade tip gap, the inlet and outlet fairing. In order to consider the influence of the struts at the stator downstream, the struts were dealt with as the stator blades, and calculated together with the ro- tor and stator upstream. The outlet static p ressure was set according to the value in Table 2 under different rotating speeds and throttle angles. The total grid nodes number of this single axial-com- pressor, including the struts, were approximat ely 1700 000. Figure 6. The surface grids of the axial-compressor. Copyright © 2010 SciRes. ENG 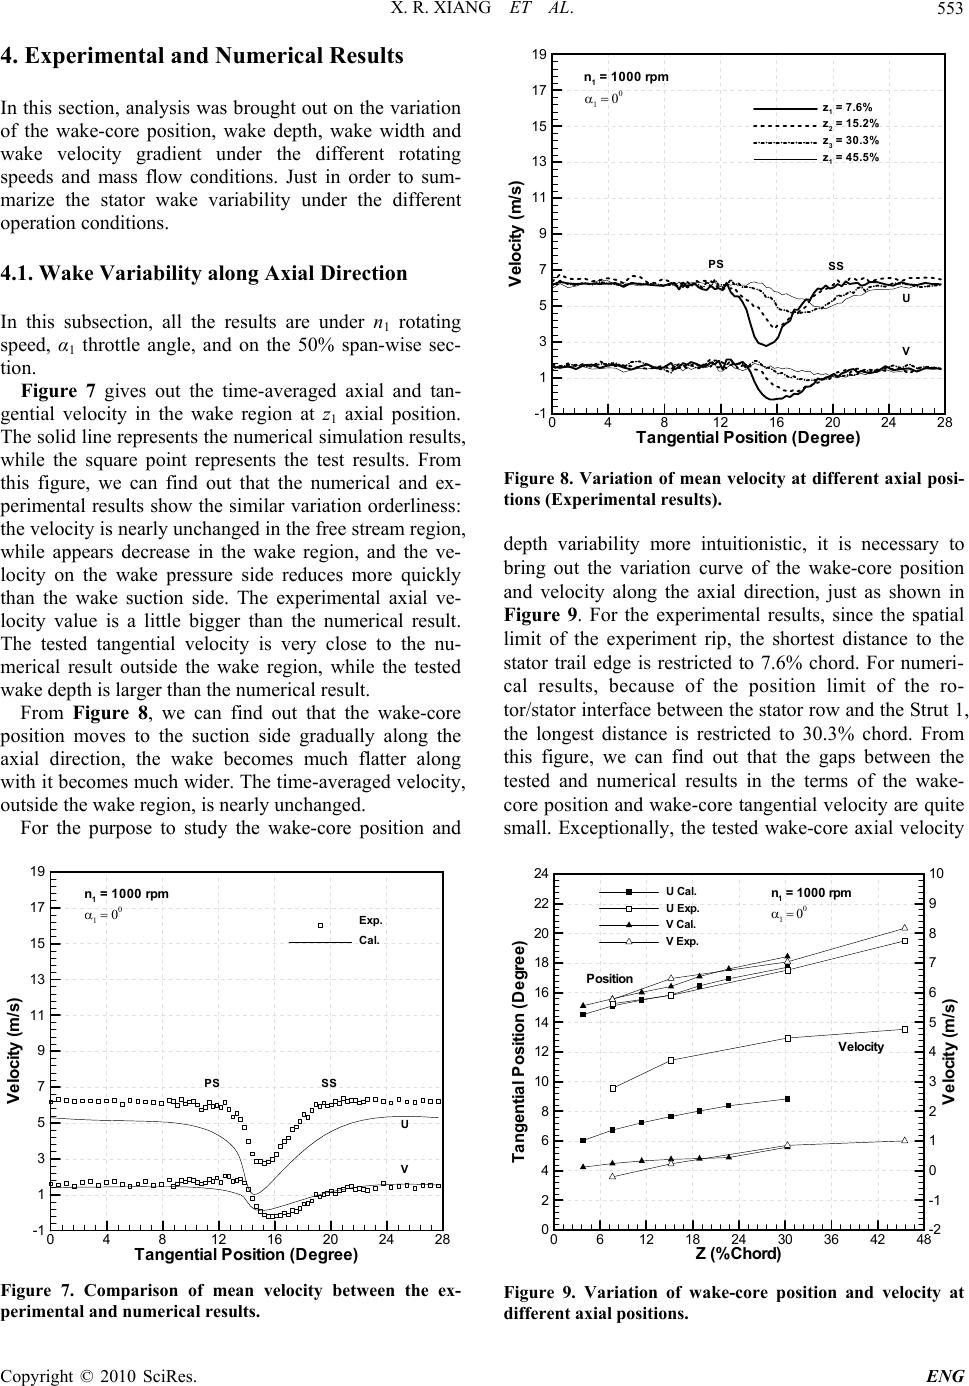 X. R. XIANG ET AL.553 4. Experimental and Numerical Results In this section, analysis was brought out on the variation of the wake-core position, wake depth, wake width and wake velocity gradient under the different rotating speeds and mass flow conditions. Just in order to sum- marize the stator wake variability under the different operation conditions. 4.1. Wake Variability along Axial Direction In this subsection, all the results are under n 1 rotating speed, α1 throttle angle, and on the 50% span-wise sec- tion. Figure 7 gives out the time-averaged axial and tan- gential velocity in the wake region at z1 axial position. The solid line represents the nu merical simulation results, while the square point represents the test results. From this figure, we can find out that the numerical and ex- perimental results show the similar variation orderliness: the velocity is nearly un changed in the free stream region, while appears decrease in the wake region, and the ve- locity on the wake pressure side reduces more quickly than the wake suction side. The experimental axial ve- locity value is a little bigger than the numerical result. The tested tangential velocity is very close to the nu- merical result outside the wake region, while the tested wake depth is larger than the numerical result. From Figure 8, we can find out that the wake-core position moves to the suction side gradually along the axial direction, the wake becomes much flatter along with it becomes much wider. The time-averaged velocity, outside the wake region, is nearly unchanged. For the purpose to study the wake-core position and Tangential Position (Degree) Velocity(m/s) 048 12 16 20 24 28 -1 1 3 5 7 9 11 13 15 17 19 Cal. Exp. SSPS V U n1= 1000 rpm Figure 7. Comparison of mean velocity between the ex- perimental and numerical results. Tangential Position (Degree) Velocity (m/s) 048 12 16 20 24 28 -1 1 3 5 7 9 11 13 15 17 19 z1=45.5% z1=7.6% z2=15.2% z3=30.3% SS PS V U n1=1000rpm Figure 8. Variation of mean velocity at different axial posi- tions (Experimental results). depth variability more intuitionistic, it is necessary to bring out the variation curve of the wake-core position and velocity along the axial direction, just as shown in Figure 9. For the experimental results, since the spatial limit of the experiment rip, the shortest distance to the stator trail edge is restricted to 7.6% chord. For numeri- cal results, because of the position limit of the ro- tor/stator interface between the stator row and the Strut 1, the longest distance is restricted to 30.3% chord. From this figure, we can find out that the gaps between the tested and numerical results in the terms of the wake- core position and wake-core tangential velocity are quite small. Exceptionally, the tested wake-core axial velocity Z(%Chord) Tangential Position (Degree) Velocity (m/s) 06 12 18 24 30 36 42 48 0 2 4 6 8 10 12 14 16 18 20 22 24 -2 -1 0 1 2 3 4 5 6 7 8 9 10 VExp. UCal. UExp. VCal. Velocity Position n1=1000rpm Figure 9. Variation of wake-core position and velocity at different axial positions. Copyright © 2010 SciRes. ENG  X. R. XIANG ET AL. 554 is bigger than the numerical one. From the variation curve of the wake-core position, it can be found that the wake-core moves to the wake suction side gradually along the axial direction, and the variation curve is nearly linear. In this paper, we consider the link of the wake-core along the axial direction as the Wake-core Line, and consider the yaw angle between the wake-core line and the axial direction as the Wake-core Yaw Angle. From the Figure 9, it can also be found that the Wake-core Line of the axial velocity is always below the tangential velocity one, but the Wake-core Yaw Angles are almost the same. Since the velocity outside the wake region is nearly unchanged at different axial positions, the high wake-core velocity represents to the small wake depth. The variation curve of the wake-core velocity reflects that the wake depth decreases gradually along the axial direction, because of the influence of the mix of the main flow and the wake, and the decrement of the axial wake depth is larger than the tangential one. Furthermore, the gradient of the wake-core velocity also decreases along the axial direction. The wake velocity gradient can obviously reflect the position of the velocity inflexion which represents the unsteady poin t of the wake flow [9], so it is necessary to bring out the analysis of the wake velocity gradient, for the purpose to study the wake variability much deeply. The radial Vorti ci ty is defined by the below formula: yVz Ux (2) In the formula, y represents the radial vorticity, represents tangential velocity, U represents the axial velocity, x, y, z represents th e tangential, radial and axial direction respectively. V For the tangential velocity is nearly unchanged in the main flow region, that is the Vz nearly equals to zero. In the wake region, Vz is also quite smaller compared to the Ux . So, the value of the y is mainly influenced by the Ux. From the transforma- tion of the radial vorticity, we can approximately sum- marize the variation orderliness of the velocity gradient in the wake region. Figure 10 gives out the radial vorticity contours in the wake region. In this figure, the zero vorticity line repre- sents the Wake-core Line of the axial velocity, and its transformation is consistent to the Figure 9. On both sides of the zero line, there are two extremum points at the same axial position, one is positive on the wake pressure side, while the other is negative on the suction side, and the negative one is smaller than the positive one. Along the axial direction, the two extremums reduce gradually, and the positive one decreases much quickly than the negative one. Simultaneously, the extremum points away from the wake core gradually. 1431.5 896.2 690.1 573.2 495.1 428.9 332.5 -363.3 -350.1 -335.0 -324.5 -310.1 -278.3 -176.8 0.0 0.0 0.0 0.0 0.0 0.0 0.0 Z(%Chord) PS 3.87.611.4 15.218.9 22.7 SS 30.3 n1=1000 rpm Figure 10. Radial vorticity contours in the stator wake re- gion (Numerical results). From the above analysis, it is obviously that the vor- ticity extremum point can approximately represents the axial velocity inflexion, which indicates the unsteady point in the wake region. The high vorticity extremum means the smart variation of the axial velocity in the wake region. From the variation of the vorticity extre- mum, it can be found that the distance between the ve- locity inflexion and wake-core increases gradually along the axial direction, on both sides of the wake-core. And the axial velocity on the wake pressure side changes much more acutely compared to the suction side, that is to say, the wake pressure side is more unsteady than the suction side. Along the axial direction, this difference, between the pressure and suction side, becomes more and more inconspicuous, because of the influence of the mixing of the main flow and wake. This variation order- liness is consistent to the experiment results shown in Figure 8. 4.2. Wake Variability Relating to Operation Condition In this subsection, numerical results under different op- eration conditions will be brought ou t, for the purpose to analyze the wake variability relating to the operation condition. The variation of the rotating speed and mass flow directly affects the inlet Mach number and the inci- dent angle of the stato r blade. So, it is more intuition istic to summarize the wake variability through analyzing the influence of the inlet Mach number and the incident an- gle of the stator blade on the wake-core position. The Figures 11 and 12 respectively give out the varia- tion of the stator inlet flow angle under different rotating Copyright © 2010 SciRes. ENG  X. R. XIANG ET AL.555 InletAngle(Degree) Percent Span (%) -80 -70 -60 -50 -40 -30 -20 -10 0 0 10 20 30 40 50 60 70 80 90 100 Flow Angle(1000rpm) Blade Angle Flow Angle(2500rpm) Flow Angle(2000rpm) Flow Angle(1500rpm) Figure 11. Variation of the stator inlet flow angle under different rotating speeds . Inlet Angle(Degree) Percent Span (%) -80 -70 -60 -50 -40 -30 -20 -10 0 0 10 20 30 40 50 60 70 80 90 100 FlowAngle( ) Blade Angle FlowAngle( ) FlowAngle( ) FlowAngle( ) Figure 12. Variation of the stator inlet flow angle under different throttle angles. speeds and mass flow conditions. The stator blade angle is shown in the both figures (the dash-dot line), so it is convenient to analyze the changes of the incident angle. Just as shown in Figure 11, above the 20% span-wise section, the incident angle decreases gradually along with the rotating speed increase, while it increase gradu- ally below this section . Above the 15% span-wise section, the incident angle increases gradually along with the mass flow decrease, while it decrease below this section, just except for the throttle angle α4. Just as shown in the Figure 13, the stator inlet Mach number decreases as the rotating speed reducing. The decrement almost obtains the maximum at the middle Mach Number Percent Span (%) 00.01 0.02 0.03 0.040.05 0.060.07 0.08 0 10 20 30 40 50 60 70 80 90 100 1000rpm 2500rpm 2000rpm 1500rpm Figure 13. Variation of the stator inlet Mach number under different operation conditions. span-wise section, and it is nearly symmetrical to the middle section. As the mass flow reducing, the inlet Mach number decreases gradually below the 90% span-wise section, while it appears increase above this section. In this part, we will pay attention to the variation of the wake-core position under different operation condi- tions, just as shown in the Figure 14. For the Wake-core Yaw Angles of the axial and tangential velocity are al- most the same, the analysis is carried out just about the axial velocity wake-core in this part. At 15% and 20% span-wise section, the incident angle is nearly unchanged, but the inlet Mach number de- creases gradually, respectively as the mass flow and the rotating speed decreasing. At the 20% section, the wake-core position which nearby the stator trail edge is nearly unchanged, but the Wake-core Yaw Angle in- creases gradually as the rotatin g speed decreasing. Along with the mass flow decrease at the 15% section, the Wake-core Yaw Angle is nearly unchanged. Until the mass flow decreases to a certain value, the Wake-core Line moves up in the tangen tial direction . That is to say, the inlet Mach number is an influence factor of the wake-core position. At 90% span-wise section, as the mass flow decreas- ing, the inlet Mach number is nearly unchanged, but the incident angle increases gradually. Exceptionally for the throttle angle α4, the incident angle appears decrease comparing to the α3 situation. At this section, the Wake-core Yaw Angle increases gradually along the axial direction, and the Wake-core Line moves up in the tangential direction. Especially for the α4 situation, the Wake-core Line moves down in the tangential direction, for the incident angle decreass compare to α3. That is to e Copyright © 2010 SciRes. ENG  X. R. XIANG ET AL. Copyright © 2010 SciRes. ENG 556 Z (%Chord) Tangential Position (Degree) 246810 12 14 16 18 20 22 24 13 14 15 16 17 18 19 20 21 22 23 24 1000rpm 2500rpm 2000rpm 1500rpm (15% ) (20% ) (20% ) (20% ) (20% ) (15% ) (15% ) Z(%Chord) Tangential Position (Degree) 26 10 14 18 22 26 30 34 13 14 15 16 17 18 19 20 21 22 23 24 (a) (b) Z (%Chord) Tangential Position (Degree) 26 10 14 18 22 26 30 34 13 14 15 16 17 18 19 20 21 22 23 24 2500rpm 2000rpm 1500rpm 1000rpm ( ) Z (%Chord) Tangential Position (Degree) 246810 12 14 16 18 20 22 24 13 14 15 16 17 18 19 20 21 22 23 24 1000rpm 2500rpm 2000rpm 1500rpm ( ) (c) (d) Figure 14. Variation of wake-core position and velocity under different operation conditions. (a) At 15% and 20% span-wise section; (b) At 90% span-wise section; (c) At 50% span-wise section; (d) At 10% span-wise section. say, the incident angle is another influence factor of the wake-core position, and its influence is opposite to the inlet Mach number. At 50% span-wise section, as the rotating speed and mass flow decreasing, the inlet Mach number decreases and the incident angle increases gradually. At this section, the variation of the Wake-core Yaw Angle is similar to the 20% span-wise section, but the increment is much huger than it. However, at 10% span-wise section, the variation of the incident angle is opposite to the 50% section along with the rotating speed and mass flow de- crease. At this section, the increment of the Wake-core Yaw Angle is quite smaller than the 50% section, and also smaller than the 20% section. There is a special situation, at the 50% section, when the throttle angle in- creases from α3 to α4, the increment of the incident ang le is smaller than α2 to α3, but the wake-core moves up in a huge quantum. This situation can be considered as the flow separation on the suction side. 5. Conclusions Based on the analysis of the time-averaged velocity, the radial vorticity along the axial direction, and the wake-core development under different operation condi- tions, the following conclusions were drawn: 1) The experimental and numerical results almost  X. R. XIANG ET AL.557 show the same variation orderliness, the test values are a little bigger than the numerical results. 2) Along the axial direction, the wake-core moves to the wake suction side gradually, and the Wake-core Line of the axial velocity is below the tangential one. The wake width increases gradually along with wake depth decreasing, and the decrement of the wake depth reduces by degrees. 3) The distance between the axial velocity inflexion and the wake-core increases gradually along the axial direction. The axial velocity on the wake pressure side changes more acutely compared to the suction side, and this different reduces by degrees along the axial direc- tion. 4) The inlet Mach number and the incident angle are both the key influence factors of the wake-core position. As the inlet Mach number decreasing and the incident angle increasing, the Wake-core Yaw Angle increases gradually. The wake-core nearby the trail edge is nearly unchanged, until the inlet Mach number (the incident angle) reduces (increases) to a certain value. 6. References [1] D. Gurak, Mehmet S. Kavsaoglu and I. S. Akmandor, “Multi Block Unsteady Navier Stokes Solution of Com- pressor Stator in Rotor Wake,” 43rd American Institute of Aeronautics and Astronautics (AIAA) aerospace sciences meeting and exhibit, Reno, Nevada, 10-13 January 2005, p. 1011. [2] Albert J. Sanders and Fleeter Sanford, “Rotor Blade-to- Blade Wake Variability and Effect on Downstream Vane Response,” Journal of propulsion and power, 2002, Vol. 18, No.2, pp. 456-464. [3] G. M. Mcnerney, C. P. Van Dam and D. T. Yen Nakafuji, “Blade-Wake Interaction Noise for Turbines with Down- Wind Rotors,” Journal of solar energy engineering, Vol. 125, No. 4, 2003, pp. 497-505. [4] M. Roger, “Analytical Modelling of Wake-Interaction Noise in Centrifugal Compressors with Vaned Diffusers,” 10th AIAA/CEAS Aeroacoustics Conference, Manchester, 10-12 May 2004, p. 2994. [5] A. Ferrecchia, W. N. Dawes and P. C. Dhanasekaran, “Compressor Rotor Wakes and Tone Noise Study,” 9th AIAA/CEAS Aeroacoustics Conference and Exhibit, Hil- ton Head, South Carolina, 12-14 May 2003, p. 3328. [6] Shaobin Li, Fu Chen and Peigang Yan, “Numerical In- vestigation of the Effect of Stator Clocking on Blade Boundary Layer Flow in Compressor,” Acta Aeronautica Et Astronautica Sinica, Vol. 28, No. z1, 2007, pp. s62-69. [7] J. Estevadeordal, S. Gogineni and L. Goss, “DPIV Study of Wake-rotor Synchronization in a Transonic Compres- sor,” 31st AIAA Fluid Dynamics Conference and Exhibit, Anaheim, CA, 11-14 June 2001, p. 3095. [8] Bo Liu, Zhipeng Cao and Yuanhu Cai, “Numerical Simulation of Unsteady Vortex in the Wake of Cascade Flow,” Journal of Northwestern Polytechnical University, Vol. 23, No. 5, 2005, pp. 562-566. [9] Guanghua Wang, Baojie Liu and Tao Liu, “A PIV Study of Near Wake Flow of airfoil Part I-Kinematic Charac- teristics,” Journal of Aerospace Power, Vol. 14, No. 2, 1999, pp. 119- 124. [10] Nicole L. Key, Patrick B. Lawless and Sanford Fleeter, “Rotor Wake Variability in a Multistage Compressor,” 45th AIAA Aerospace Sciences Meeting and Exhibit, Reno, Nevada, 8-11 January 2007, p. 19. [11] S. T. Hsu and A. M. Wo, “Near-Wake Measurement in a Rotor/Stator Axial Compressor Using Slanted Hot-Wire Technique,” Experiments in Fluids, Vol. 23, No. 5, 1997, pp. 441-444. [12] A. Jameson, W. Schmit and E. Turkel, “Numerical Solu- tion of the Euler Equations by Finite Volume Methods Using Runge-Kutta Time-Stepping Schemes,” 14th AIAA Fluid and Plasma Dynamics Conference, Palo Alto, CA, 23-25 June 1981, p. 1259. Copyright © 2010 SciRes. ENG |