 Vol.3, No.5, 678-696 (2012) Agricultural Sciences http://dx.doi.org/10.4236/as.2012.35083 Copyright © 2012 SciRes. OPEN ACCESS Short-term influence of anaerobically-digested and conventional swine manure, and N fertilizer on organic C and N, and available nutrients in two contrasting soils Sukhdev S. Malhi1*, R. L. Lemke2, M. Stumborg3, F. Selles4 1Agriculture and Agri-Food Canada, Melfort, Canada; *Corresponding Author: sukhdev.malhi@agr.gc.ca 2Agriculture and Agri-Food Canada, Saskatoon, Canada 3Agriculture and Agri-Food Canada, Swift Current, Canada 4Agriculture and Agri-Food Canada, Brandon, Canada Received 3 June 2012; revised 3 July 2012; accepted 23 July 2012 ABSTRACT A three-year (2006-2008) field experiment was conducted at Swift Current and Star City in Saskatchewan to determine the short-term in- fluence of land-applied anaerobically digested swine manure (ADSM), conventionally treated swine manure (CTSM) and N fertilizer on total organic C (TOC), total organic N (TON), light fraction organic C (LFOC), light fraction organic N (LFON) and pH in the 0 - 7.5 and 7.5 - 15 cm soil layers, and ammonium-N, nitrate-N, ex- tractable P, exchangeable K and sulphate-S in the 0 - 15, 15 - 30, 30 - 60, 60 - 90 and 90 - 120 cm soil layers. Treatments included spring and au- tumn applications of CTSM and ADSM at a 1x rate (10,000 and 7150 L·ha−1, respectively) ap- plied each year, a 3x rate (30,000 and 21,450 L·ha−1, respectively) applied once at the begin- ning of the experiment, plus a treatment receiv- ing commercial fertilizer (UAN at 60 kg·N·ha−1·yr−1) and a zero-N control. There was no effect of swine manure rate, type and application time on soil pH. Mass of TOC and TON in the 15 cm soil layer increased significantly with swine manure application compared to the control, mainly at the Swift Current site, with greater increases from 3x rate than 1x rate (by 2.21 Mg·C·ha−1 and 0.167 Mg·N·ha−1). Compared to the control, mass of LFOC and LFON in the 15 cm soil layer in- creased with swine manure application at both sites, with greater increases from 3x rate than 1x rate (by 287 kg·C·ha−1 and 26 kg·N·ha−1 at Star City, and by 194 kg·C·ha−1 and 19 kg·N·ha−1 at Swift Current). Mass of TOC and TON in soil layer was tended to be greater with ADSM than CTSM, but mass of LFOC and LFON in soil was greater with CTSM than ADSM. Mass of TOC, TON, LFOC and LFON in soil also increased with annual N fertilizer application compared to the control (by 3.2 Mg·C·ha−1 for TOC, 0.195 Mg·N·ha−1 for TON, 708 kg·C·ha−1 for LFOC and 45 kg·N·ha−1 for LFON). In conclusion, our findings suggest that the quantity and quality of organic C and N in soil can be affected by swine manure rate and type, and N fertilization even after three years, most likely by influencing inputs of C and N through crop residue, and improve soil quality. Keywords: Anaerobic Digestion; Available N; P, K and S; Organic C and N; Soil; Swine Manure 1. INTRODUCTION Of the approximately 30 million hogs marketed in Canada, nearly one-half of that industry is located in the Canadian prairie region, and approximately 90% of in- tensive livestock operations (ILOs) store manure in liq- uid form in a holding tank or lagoon until it can be land-applied. Land application of liquid swine manure (LSM) is an effective source of nutrients for crop pro- duction [1-3]. Economically feasible, environmentally friendly, and socially acceptable management of LSM from ILOs is a key element for the future viability of this industry. In LSM, there is usually less than 2% solid ma- terial [4] and most of the nutrients are in plant-available inorganic form. Thus, LSM can potentially increase soil organic C (SOC) mainly by supplying nutrients to crops [5,6] and increasing above and below ground plant bio- mass thereby adding organic matter to the soil. In the Prairie Provinces of Canada, previous research has  S. S. Malhi et al. / Agricultural Sciences 3 (2012) 678-696 Copyright © 2012 SciRes. OPEN ACCESS 679 documented the agronomic benefits of LSM application on enhancing crop yields [1]. Increased soil fertility is an important benefit of LSM application that substantially increases the concentration of N, P, K and micronutrients in soil [1,3]. Anaerobic digestion is a promising technology that may reduce greenhouse gas (GHG, CH4 and N2O) emis- sions by utilizing the biogas produced during digestion to displace fossil fuels and by reducing emissions during lagoon storage. The effects of land-applied anaerobically digested swine manure (ADSM) versus conventionally treated swine manure (CTSM) or N fertilizer on crop yields and GHG emissions in the Canadian prairies are presented in our previous report [7]. However, the re- search information on the impact of ADSM versus CTSM or N fertilizer on soil biochemical and chemical properties is lacking in the Canadian prairies, especially in the Parkland region. The objective of this study was to compare relative effects of land-applied ADSM, CTSM, or N fertilizer on quantity and quality of soil organic C and N (TOC, TON, LFOC and LFON), and some soil chemical properties (pH, ammonium-N, nitrate-N, ex- tractable P, exchangeable K and sulphate-S). 2. MATERIALS AND METHODS A field experiment was conducted over three years from 2006 to 2008 at two field sites in Saskatchewan [Star City (Dark Gray Luvisol soil) and Swift Current (Brown Chernozem soil)], having contrasting soil and climatic conditions. Precipitation in the growing season (May, June, July and August) at the two sites from 2006 to 2008, and long-term (30-year) average of precipitation in May to August at the nearest Environment Canada Meteorological Station (AAFC Melfort and AAFC Swift Current) are presented in Table 1. Precipitation in the 2006 growing season was slightly below average at both sites. In 2007, the growing season precipitation was much below long-term average at Swift Current (with particularly limited precipitation in July), but was slight- ly above average at Star City. In 2008, the growing sea- son precipitation was much higher than average (espe- cially in June) at Swift Current, but much below average (especially in May during seeding) at Star City. Treat- ments included autumn and spring applications of CTSM and ADSM at a 1x rate (10,000 and 7150 L·ha−1 respec- tively) applied each year, and a 3x rate (30,000 and 21,450 L·ha−1 respectively) applied once at the beginning of the study. A treatment receiving commercial fertilizer urea-ammonium nitrate (UAN) solution and a check (no N) were also included. Eleven treatments (Table 2) were arranged in a randomized complete block design with four replications. Liquid swine manures were applied by the Prairie Agricultural Machinery Institute (PAMI) us- ing a customized applicator, which injected the material to 10 cm. All plots were seeded to barley (Hordeum vul- gare L.) in each of the three years, and harvested for seed and straw yield, and total N uptake. In the autumn of 2008, soil in each plot was sampled to 0 - 7.5, 7.5 - 15 and 15 - 20 cm depths for TOC, TON, LFOC, LFON and pH, and to 0 - 15, 15 - 30, 30 - 60 and 60 - 90 cm depths for ammonium-N, nitrate-N, extractable P, exchangeable K and sulphate-S. For TOC, TON, LFOC, LFON and pH, soil cores at 10 locations in each plot were collected using a 2.4 cm di- ameter coring tube. Bulk density of soil was determined by the core method using soil weight and core volume [8]. The soil samples were air dried at room temperature after removing coarse roots and easily detectable crop Table 1. Monthly cumulative precipitation in the growing season during 2006, 2007 and 2008 at Star City and Swift Current, Sas- katchewan. Precipitation (mm) Location/Year May June July August Total Star City 2006 63 73 39 46 221 2007 71 119 47 40 277 2008 6 32 117 22 177 30-year mean 46 66 76 57 245 Swift Current 2006 35 96 31 21 183 2007 26 48 10 19 103 2008 27 152 64 69 312 30-year mean 50 66 52 40 208  S. S. Malhi et al. / Agricultural Sciences 3 (2012) 678-696 Copyright © 2012 SciRes. OPEN ACCESS 680 Table 2. List of treatments and the corresponding total amount of N applied and input of C from crop residue returned and land-ap- plied liquid swine manure (LSM) during a three-year (2006-2008) field study at Star City and Swift Current, Saskatchewan. Time of application Product appliedz Application rate of LSM or N fertilizer Total amount of N applied in 3 years (kg·N·ha−1) Input of C from crop residue plus LSM in 3 years at Star City (kg·C·ha−1) Input of C from crop residue plus LSM in 3 years at Swift Current (kg·C·ha−1) Control No manure or N fert 0 4037 3710 Autumn ADSM-3x 21,450 L·ha−1 214 6665 5753 ADSM-1x 7150 L·ha−1 205 6446 4719 CTSM-3x 30,000 L·ha−1 403 7603 5919 CTSM-1x 10,000 L·ha−1 360 8765 4872 Spring ADSM-3x 21,450 L·ha−1 257 6745 5270 ADSM-1x 7150 L·ha−1 255 7601 4444 CTSM-3x 30,000 L·ha−1 343 7405 5701 CTSM-1x 10,000 L·ha−1 326 7906 5210 UAN 60 kg·N·ha−1 180 6158 5278 zADSM = anaerobically digested swine manure, CTSM = conventionally treated swine manure, UAN = urea ammonium nitrate (liquid), 3x = once in 3 years, 1x = annual application. residues, and ground to pass a 2-mm sieve. Sub-samples were pulverized in a vibrating-ball mill (Retsch, Type MM2, Brinkman Instruments Co., Toronto, Ontario) for determination of TOC, TON, LFOC and LFON in soil. Soil samples used for organic C and N analyses were tested for the presence of inorganic C (carbonates) using dilute HCl, and none was detected in any soil sample. Therefore, C in soil associated with each fraction was considered to be of organic origin. Total organic C in soil was measured by Dumas combustion using a Carlo Erba instrument (Model NA 1500, Carlo Erba Strumentazione, Italy), and Technicon Industrial Systems [9] method was used to determine TON in the soil. Light fraction organic matter (LFOM) was separated using a NaI solution of 1.7 Mg·m−3 specific gravity, as described by Janzen et al. [10] and modified by Izaurralde et al. [11]. The C and N in LFOM (LFOC, LFON) were measured by Dumas com- bustion. Soil samples (ground to pass a 2-mm sieve) taken for organic C and N from the 0 - 15 cm layer were also monitored for pH in 0.01 M CaCl2 solution with a pH meter. For other chemical properties, soil cores (using a 4 cm diameter coring tube) were collected at 4 locations in each plot from the 0 - 15, 15 - 30, 30 - 60, 60 - 90 and 90 - 120 cm layers. The bulk density of each depth was cal- culated using soil weight and core volume [8]. The soil samples were air dried at room temperature, ground to pass a 2-mm sieve, and analyzed for ammonium-N [12] and nitrate-N [13] by extracting soil in a 1:5 soil: 2M KCl solution; extractable P [9] by extracting soil in Kelowna extract, exchangeable K [14] and sulphate-S [15]. The data on each parameter were subjected to analysis of variance (ANOVA) using GLM procedure in SAS [16]. For each ANOVA, the least significant difference at P ≤ 0.05 (LSD0.05) was used to determine significant differ- ences between treatment means, and standard error of the mean (SEM) and significance are also reported. 3. RESULTS 3.1. Soil Biochemical Properties At Star City, there was no significant beneficial effect of swine manure or UAN fertilizer application on TOC and TON mass in soil compared to the zero-N control treatment (Ta bl e 3 ). At Swift Current, mass of TOC and TON in soil increased with application of swine manure at 3x rate compared to control in the 0 - 7.5 and also in the total 0 - 15 cm depth, with the greatest increase from 3x rate of ADSM applied in spring (Table 4). On average, TOC and TON in soil was greater with 3x rate (once in 3 years) than 1x rate (annual application) of swine manure, and greater with ADSM than CTSM in some cases. At Star City, mass of LFOC and LFON in soil in- creased with increasing rate of swine manure and also with UAN application compared to the zero-N control treatment in the 0 - 7.5 cm layer (Ta bl e 5). On average, mass of LFOC and LFON was greater with the 3x rate (once in 3 years) than the 1x rate (annual application) of swine manure in the 0 - 7.5 cm soil layer, but there was little or no effect of timing and type of swine manure application on these parameters. At Swift Current, there was a significant effect of swine manure and N fertilizer treatments on mass of LFOC and LFON in the 0 - 7.5 cm  S. S. Malhi et al. / Agricultural Sciences 3 (2012) 678-696 Copyright © 2012 SciRes. OPEN ACCESS 681 Table 3. Effect of land-applied anaerobically digested swine manure (ADSM), conventionally treated swine manure (CTSM) and urea-ammonium-nitrate (UAN) solution fertilizer over three years from 2006 to 2008 on mass of total organic C (TOC) and total organic N (TON) in soil in autumn 2008 at Star City, Saskatchewan, Canada (Gray Luvisol soil). TOC mass (Mg·C·ha−1) in soil layers (cm) TON mass (Mg·N·ha−1) in soil layers (cm) Treatments 0 - 7.5 7.5 - 15 0 - 15 0 - 7.5 7.5 - 15 0 - 15 Control 22.27 16.58 38.85 2.024 1.519 3.543 ADSM-3x Autumn 22.57 17.73 40.31 2.037 1.636 3.673 ADSM-1x Autumn 22.26 15.52 37.78 1.999 1.476 3.474 CTSM-3x Autumn 21.86 17.49 39.34 2.082 1.751 3.833 CTSM-1x Autumn 21.31 16.21 37.52 1.926 1.463 3.388 ADSM-3x Spring 22.52 15.99 38.51 2.106 1.588 3.694 ADSM-1x Spring 22.54 17.94 40.48 2.045 1.723 3.768 CTSM-3x Spring 21.96 16.43 38.39 2.001 1.556 3.557 CTSM-1x Spring 21.55 17.90 39.45 1.924 1.673 3.597 UAN Spring 23.64 19.13 42.76 2.106 1.774 3.880 LSD0.05 ns ns ns ns ns ns SEM (Probability) 0.733ns 1.249ns 1.620ns 0.0731ns 0.1116ns 0.1505ns Manure rate 1x 21.91 16.89 38.80 1.973 1.584 3.557 3x 22.23 16.91 39.14 2.057 1.633 3.690 LSD0.05 ns ns ns 0.112 ns ns SEM (Probability) 0.359ns 0.653ns 0.837ns 0.0385• 0.0592ns 0.0816ns Manure type ADSM 22.47 16.80 39.27 2.047 1.606 3.653 CTSM 21.67 17.01 38.68 1.983 1.611 3.594 LSD0.05 1.04 ns ns ns ns ns SEM (Probability) 0.359• 0.653ns 0.837ns 0.0385ns 0.0592 ns 0.0816ns Manure application time Autumn 22.00 16.74 38.74 2.011 1.581 3.592 Spring 22.14 17.07 39.21 2.019 1.635 3.654 LSD0.05 ns ns ns ns ns ns SEM (Probability) 0.359ns 0.653ns 0.837ns 0.0385ns 0.0592ns 0.0816ns • and ns refer to significant treatment effects in ANOVA at P ≤ 0.10 and not significant, respectively. soil layer (Table 6). On average, mass of LFOC and LFON in soil was greater with the 3x rate (once in 3 years) than the 1x rate (annual application) of swine manure, but there was little effect of timing and type of swine manure application on these parameters. At both sites, the correlation coefficients among the TOC, TON, LFOC and LFON fractions in soil were strong, and were highly significant between TOC and TON, and between LFOC and LFON (Table 7). At Swift Current, the correlation between TOC and LFOC or LFON was significant at P = 0.12 or 0.15. The correla- tion coefficients between crop residue C input over 3 growing seasons (Table 1) and TOC, TON, LFOC or LFON were not significant in any case at Star City, but  S. S. Malhi et al. / Agricultural Sciences 3 (2012) 678-696 Copyright © 2012 SciRes. OPEN ACCESS 682 Table 4. Effect of land-applied anaerobically digested swine manure (ADSM), conventionally treated swine manure (CTSM) and urea-ammonium-nitrate (UAN) solution fertilizer over three years from 2006 to 2008 on mass of total organic C (TOC) and total organic N (TON) in soil in autumn 2008 at Swift Current, Saskatchewan, Canada (Dark Brown Chernozem soil). TOC mass (Mg·C·ha−1) in soil layers (cm) TON mass (Mg·N·ha−1) in soil layers (cm) Treatments 0 - 7.5 7.5 - 15 0 - 15 0 - 7.5 7.5 - 15 0 - 15 Control 19.50 15.60 35.10 1.948 1.723 3.671 ADSM-3x Autumn 21.59 16.69 38.28 2.096 1.760 3.856 ADSM-1x Autumn 20.50 17.57 38.07 2.065 1.814 3.879 CTSM-3x Autumn 22.02 15.88 37.90 2.126 1.711 3.837 CTSM-1x Autumn 20.50 16.17 36.67 2.062 1.714 3.776 ADSM-3x Spring 23.31 17.52 40.83 2.347 1.853 4.200 ADSM-1x Spring 20.41 16.17 36.58 2.016 1.694 3.710 CTSM-3x Spring 22.08 16.69 38.77 2.121 1.726 3.847 CTSM-1x Spring 20.67 14.97 35.64 2.084 1.623 3.707 UAN Spring 20.68 16.90 37.58 2.023 1.701 3.724 LSD0.05 2.14 ns 3.48 0.178 ns 0.290 SEM (Probability) 0.736* 0.845ns 1.201• 0.0613* 0.0682ns 0.0999* Manure rate 1x 20.52 16.22 36.74 2.057 1.711 3.768 3x 22.25 16.70 38.95 2.172 1.762 3.935 LSD0.05 1.14 ns 1.87 0.107 ns 0.167 SEM (Probability) 0.392** 0.439ns 0.644* 0.0366* 0.0343ns 0.0575* Manure type ADSM 21.45 16.99 38.44 2.131 1.780 3.911 CTSM 21.32 15.93 37.25 2.098 1.693 3.792 LSD0.05 ns 1.28 ns ns 0.100 0.167 SEM (Probability) 0.392ns 0.439• 0.644ns 0.0366ns 0.0343• 0.0575• Manure application time Autumn 21.15 16.58 37.73 2.087 1.750 3.837 Spring 21.62 16.34 37.96 2.142 1.724 3.866 LSD0.05 ns ns ns ns ns 0.167 SEM (Probability) 0.392ns 0.439ns 0.644ns 0.0366ns 0.0343ns 0.0575ns •, *, **and ns refer to significant treatment effects in ANOVA at P ≤ 0.10, P ≤ 0.05, P ≤ 0.01 and not significant, respectively. was significant for LFOC and LFON at Swift Current. For linear regressions between crop residue C input and TOC, TON, LFOC or LFON, the R2 values were not sig- nificant in any case at Star City, but highly significant for LFOC and LFON at Swift Current (Table 8). 3.2. Soil Chemical Properties and Distribution of Available N, P, K and S in the Soil Profile There was no significant effect of swine manure (fre- quency, type and application time) or N fertilizer appli- cation after three years on soil pH in the 0 - 15 cm layer at either site (data not shown). The soil pH ranged from 6.4 to 6.7 at Star City and from 5.8 to 6.5 at Swift Cur- rent among different treatments. There was also no effect of swine manure or N fertilizer treatments on ammo- nium-N and exchangeable K in soil at both sites, and sulphate-S in soil at Swift Current (data not shown). The amount of nitrate-N increased with the 3x rate of swine manure application in the 30 - 60, 60 - 90 and 90 - 120 cm soil layers at Star City (Table 9), and in all soil layers  S. S. Malhi et al. / Agricultural Sciences 3 (2012) 678-696 Copyright © 2012 SciRes. OPEN ACCESS 683 Table 5. Effect of land-applied anaerobically digested swine manure (ADSM), conventionally treated swine manure (CTSM) and urea-ammonium-nitrate (UAN) solution fertilizer over three years from 2006 to 2008 on mass of light fraction organic C (LFOC) and light fraction organic N (LFON) in soil in autumn 2008 at Star City, Saskatchewan, Canada (Gray Luvisol soil). LFOC mass (Mg·C·ha−1) in soil layers (cm) LFON mass (Mg·N·ha−1) in soil layers (cm) Treatments 0 - 7.5 7.5 - 15 0 - 7.5 7.5 - 15 0 - 7.5 7.5 - 15 Control 1931 649 2580 135 35 170 ADSM-3x Autumn 2263 603 2866 158 33 191 ADSM-1x Autumn 2116 749 2865 143 40 183 CTSM-3x Autumn 2286 1004 3290 154 52 206 CTSM-1x Autumn 2306 762 3068 149 41 190 ADSM-3x Spring 2333 817 3150 160 47 207 ADSM-1x Spring 2034 673 2707 134 36 170 CTSM-3x Spring 2277 957 3234 161 55 216 CTSM-1x Spring 1878 875 2753 127 48 175 UAN Spring 2203 952 3155 150 55 205 LSD0.05 ns ns ns ns ns ns SEM (Probability) 206.8ns 122.1ns 241.7ns 13.3ns 7.2ns 14.6ns Manure rate 1x 2083 765 2848 138 41 179 3x 2290 845 3135 158 47 205 LSD0.05 296 ns 346 19 ns 21 SEM (Probability) 101.5ns 55.0ns 118.7• 6.5* 3.1ns 7.1* Manure type ADSM 2187 710 2897 149 39 188 CTSM 2187 900 3087 148 49 197 LSD0.05 ns 160 ns ns 9 ns SEM (Probability) 101.5ns 55.0* 118.7ns 6.5ns 3.1* 7.1ns Manure application time Autumn 2242 780 3022 151 41 192 Spring 2131 830 2961 145 47 192 LSD0.05 ns ns ns ns ns ns SEM (Probability) 101.5ns 55.0ns 118.7ns 6.5ns 3.1ns 7.1ns •, * and ns refer to significant treatment effects in ANOVA at P ≤ 0.10, P ≤ 0.05 and not significant, respectively. up to the 120 cm depth at Swift Current (Tabl e 10 ). Ap- plication of UAN fertilizer had a significant effect on nitrate-N in soil at Swift Current, but no effect on soil nitrate-N at Star City. The increase in nitrate-N due to swine manure in the 120 cm soil profile was greater with CTSM than ADSM, and also greater with autumn appli- cation than spring application at Star City site. However, the opposite was true at Swift Current. The amounts of extractable P in soil tended to increase in a few cases with swine manure application in the 0 - 15 and 15 - 30 cm layers at Star City (Ta bl e 11) and in the 0 - 15, 15 - 30 or 30 - 60 cm layers at Swift Current (Table 12). Ap- plication of UAN fertilizer had no significant effect on extractable P in soil at either site. On average, extractable P in soil tended to be greater with CTSM than ADSM at Swift Current, but there was no effect of swine manure 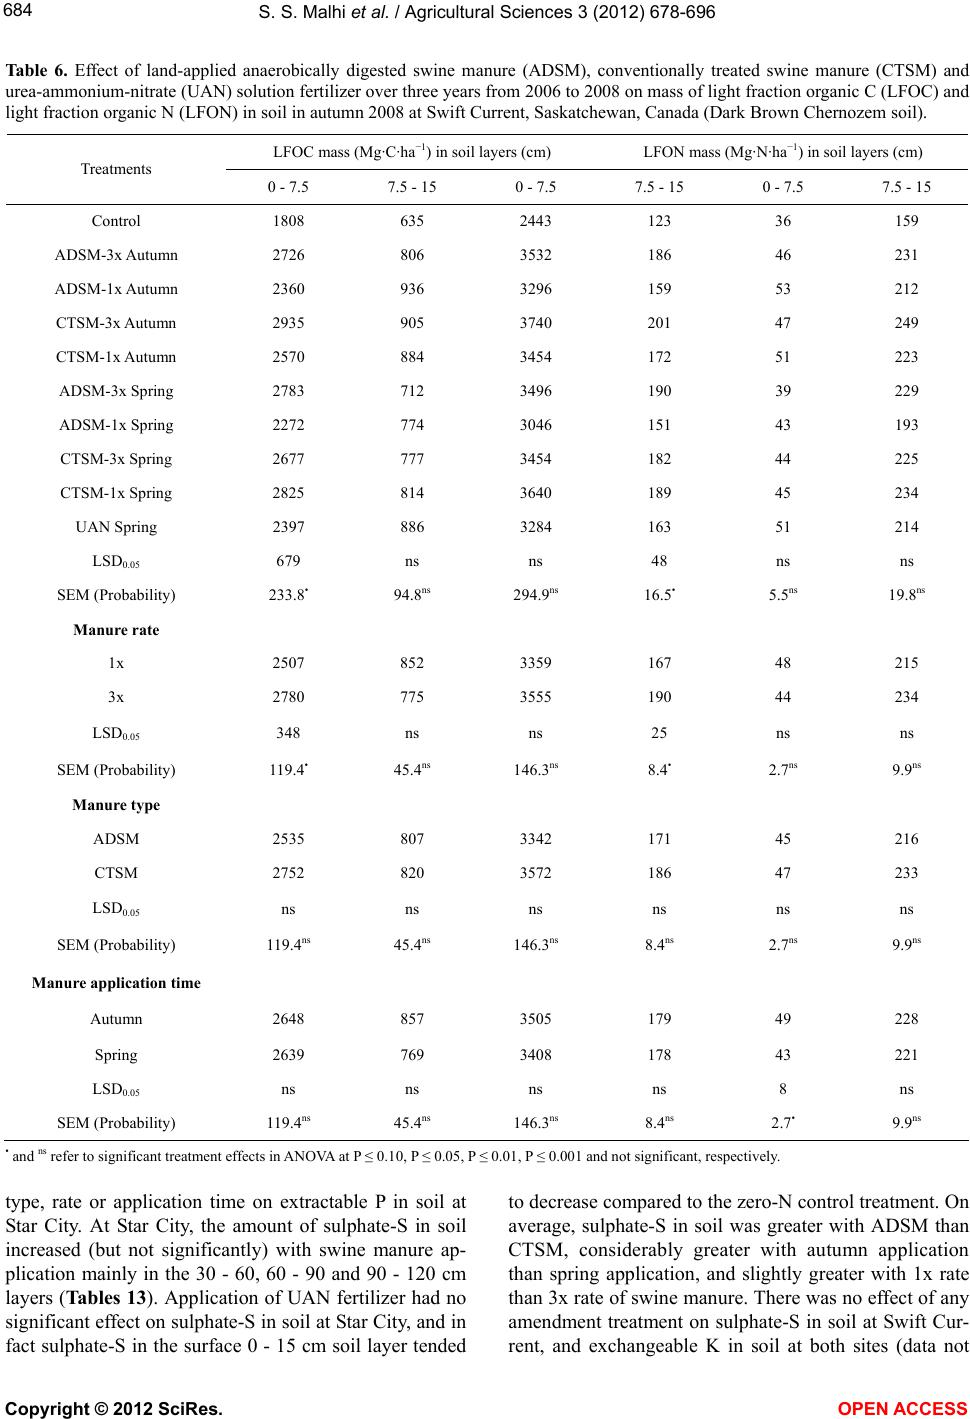 S. S. Malhi et al. / Agricultural Sciences 3 (2012) 678-696 Copyright © 2012 SciRes. OPEN ACCESS 684 Table 6. Effect of land-applied anaerobically digested swine manure (ADSM), conventionally treated swine manure (CTSM) and urea-ammonium-nitrate (UAN) solution fertilizer over three years from 2006 to 2008 on mass of light fraction organic C (LFOC) and light fraction organic N (LFON) in soil in autumn 2008 at Swift Current, Saskatchewan, Canada (Dark Brown Chernozem soil). LFOC mass (Mg·C·ha−1) in soil layers (cm) LFON mass (Mg·N·ha−1) in soil layers (cm) Treatments 0 - 7.5 7.5 - 15 0 - 7.5 7.5 - 15 0 - 7.5 7.5 - 15 Control 1808 635 2443 123 36 159 ADSM-3x Autumn 2726 806 3532 186 46 231 ADSM-1x Autumn 2360 936 3296 159 53 212 CTSM-3x Autumn 2935 905 3740 201 47 249 CTSM-1x Autumn 2570 884 3454 172 51 223 ADSM-3x Spring 2783 712 3496 190 39 229 ADSM-1x Spring 2272 774 3046 151 43 193 CTSM-3x Spring 2677 777 3454 182 44 225 CTSM-1x Spring 2825 814 3640 189 45 234 UAN Spring 2397 886 3284 163 51 214 LSD0.05 679 ns ns 48 ns ns SEM (Probability) 233.8• 94.8ns 294.9ns 16.5• 5.5ns 19.8ns Manure rate 1x 2507 852 3359 167 48 215 3x 2780 775 3555 190 44 234 LSD0.05 348 ns ns 25 ns ns SEM (Probability) 119.4• 45.4ns 146.3ns 8.4• 2.7ns 9.9ns Manure type ADSM 2535 807 3342 171 45 216 CTSM 2752 820 3572 186 47 233 LSD0.05 ns ns ns ns ns ns SEM (Probability) 119.4ns 45.4ns 146.3ns 8.4ns 2.7ns 9.9ns Manure application time Autumn 2648 857 3505 179 49 228 Spring 2639 769 3408 178 43 221 LSD0.05 ns ns ns ns 8 ns SEM (Probability) 119.4ns 45.4ns 146.3ns 8.4ns 2.7• 9.9ns • and ns refer to significant treatment effects in ANOVA at P ≤ 0.10, P ≤ 0.05, P ≤ 0.01, P ≤ 0.001 and not significant, respectively. type, rate or application time on extractable P in soil at Star City. At Star City, the amount of sulphate-S in soil increased (but not significantly) with swine manure ap- plication mainly in the 30 - 60, 60 - 90 and 90 - 120 cm layers (Tables 13). Application of UAN fertilizer had no significant effect on sulphate-S in soil at Star City, and in fact sulphate-S in the surface 0 - 15 cm soil layer tended to decrease compared to the zero-N control treatment. On average, sulphate-S in soil was greater with ADSM than CTSM, considerably greater with autumn application than spring application, and slightly greater with 1x rate than 3x rate of swine manure. There was no effect of any amendment treatment on sulphate-S in soil at Swift Cur- rent, and exchangeable K in soil at both sites (data not 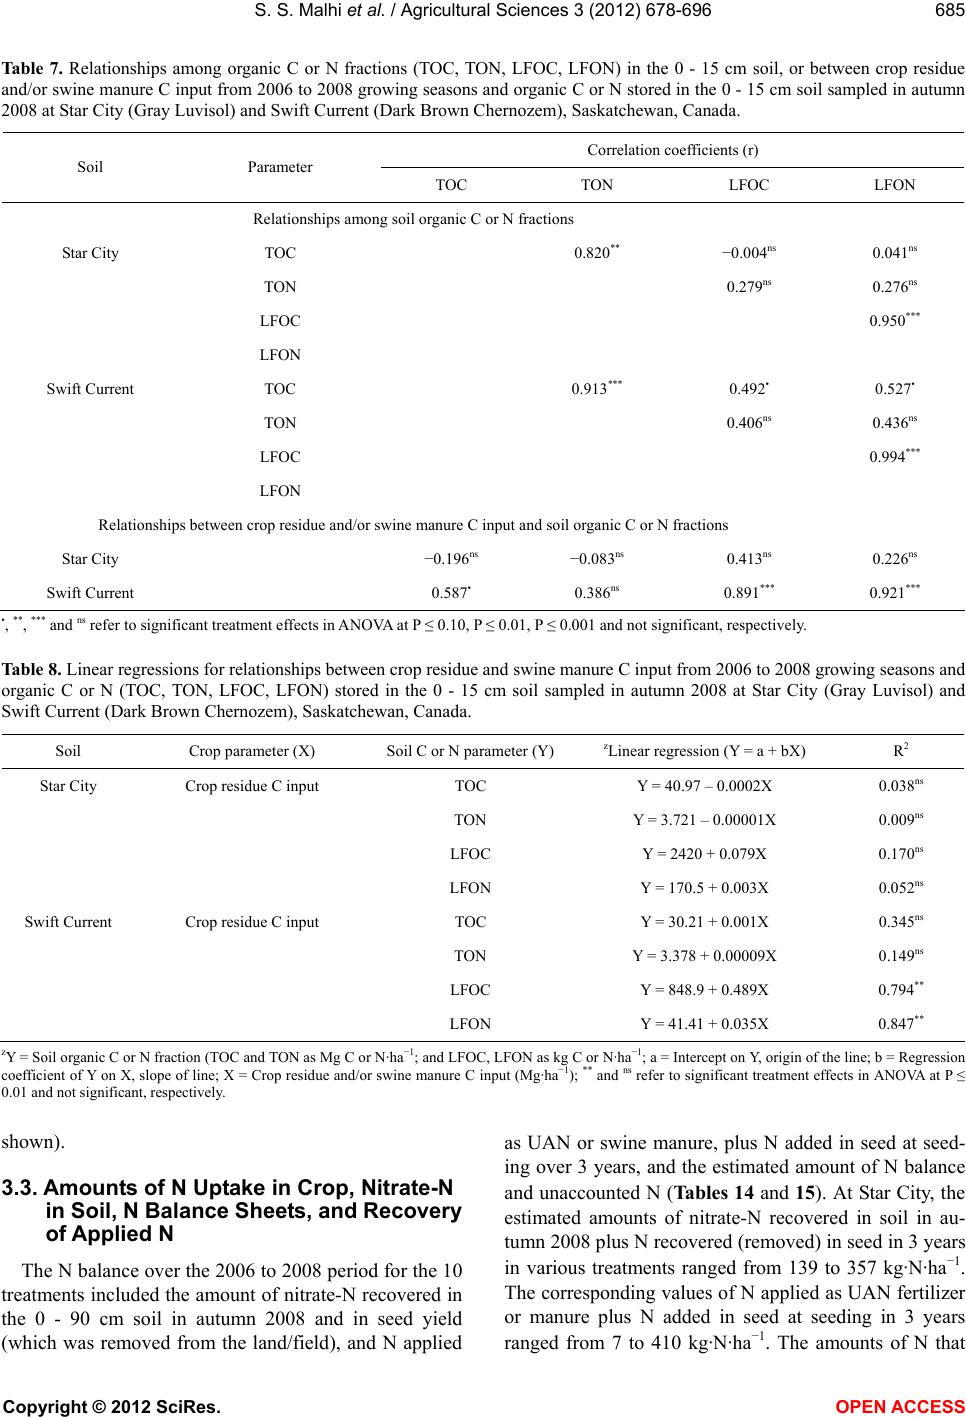 S. S. Malhi et al. / Agricultural Sciences 3 (2012) 678-696 Copyright © 2012 SciRes. OPEN ACCESS 685 Ta ble 7. Relationships among organic C or N fractions (TOC, TON, LFOC, LFON) in the 0 - 15 cm soil, or between crop residue and/or swine manure C input from 2006 to 2008 growing seasons and organic C or N stored in the 0 - 15 cm soil sampled in autumn 2008 at Star City (Gray Luvisol) and Swift Current (Dark Brown Chernozem), Saskatchewan, Canada. Correlation coefficients (r) Soil Parameter TOC TON LFOC LFON Relationships among soil organic C or N fractions Star City TOC 0.820** −0.004ns 0.041ns TON 0.279ns 0.276ns LFOC 0.950*** LFON Swift Current TOC 0.913*** 0.492• 0.527• TON 0.406ns 0.436ns LFOC 0.994*** LFON Relationships between crop residue and/or swine manure C input and soil organic C or N fractions Star City −0.196ns −0.083ns 0.413ns 0.226ns Swift Current 0.587• 0.386ns 0.891*** 0.921*** •, **, *** and ns refer to significant treatment effects in ANOVA at P ≤ 0.10, P ≤ 0.01, P ≤ 0.001 and not significant, respectively. Table 8. Linear regressions for relationships between crop residue and swine manure C input from 2006 to 2008 growing seasons and organic C or N (TOC, TON, LFOC, LFON) stored in the 0 - 15 cm soil sampled in autumn 2008 at Star City (Gray Luvisol) and Swift Current (Dark Brown Chernozem), Saskatchewan, Canada. Soil Crop parameter (X) Soil C or N parameter (Y) zLinear regression (Y = a + bX) R2 Star City Crop residue C input TOC Y = 40.97 – 0.0002X 0.038ns TON Y = 3.721 – 0.00001X 0.009ns LFOC Y = 2420 + 0.079X 0.170ns LFON Y = 170.5 + 0.003X 0.052ns Swift Current Crop residue C input TOC Y = 30.21 + 0.001X 0.345ns TON Y = 3.378 + 0.00009X 0.149ns LFOC Y = 848.9 + 0.489X 0.794** LFON Y = 41.41 + 0.035X 0.847** zY = Soil organic C or N fraction (TOC and TON as Mg C or N·ha−1; and LFOC, LFON as kg C or N·ha−1; a = Intercept on Y, origin of the line; b = Regression coefficient of Y on X, slope of line; X = Crop residue and/or swine manure C input (Mg·ha−1); ** and ns refer to significant treatment effects in ANOVA at P ≤ 0.01 and not significant, respectively. shown). 3.3. Amounts of N Uptake in Crop, Nitrate-N in Soil, N Balance Sheets, and Recovery of Applied N The N balance over the 2006 to 2008 period for the 10 treatments included the amount of nitrate-N recovered in the 0 - 90 cm soil in autumn 2008 and in seed yield (which was removed from the land/field), and N applied as UAN or swine manure, plus N added in seed at seed- ing over 3 years, and the estimated amount of N balance and unaccounted N (Tables 14 and 15). At Star City, the estimated amounts of nitrate-N recovered in soil in au- tumn 2008 plus N recovered (removed) in seed in 3 years in various treatments ranged from 139 to 357 kg·N·ha−1. The corresponding values of N applied as UAN fertilizer or manure plus N added in seed at seeding in 3 years ranged from 7 to 410 kg·N·ha−1. The amounts of N that 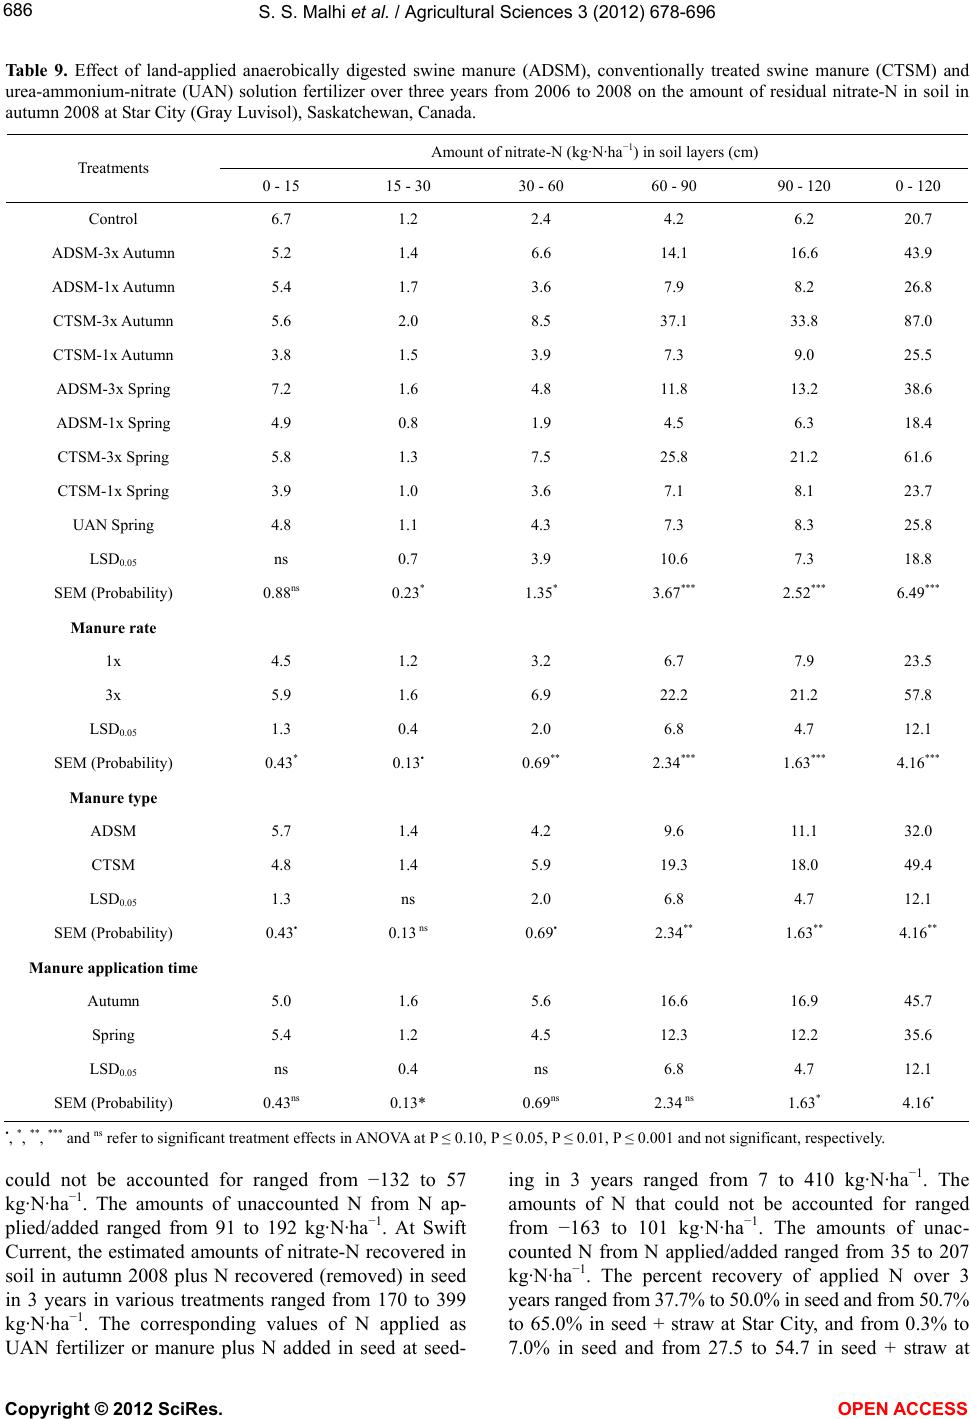 S. S. Malhi et al. / Agricultural Sciences 3 (2012) 678-696 Copyright © 2012 SciRes. OPEN ACCESS 686 Table 9. Effect of land-applied anaerobically digested swine manure (ADSM), conventionally treated swine manure (CTSM) and urea-ammonium-nitrate (UAN) solution fertilizer over three years from 2006 to 2008 on the amount of residual nitrate-N in soil in autumn 2008 at Star City (Gray Luvisol), Saskatchewan, Canada. Amount of nitrate-N (kg·N·ha−1) in soil layers (cm) Treatments 0 - 15 15 - 30 30 - 60 60 - 90 90 - 120 0 - 120 Control 6.7 1.2 2.4 4.2 6.2 20.7 ADSM-3x Autumn 5.2 1.4 6.6 14.1 16.6 43.9 ADSM-1x Autumn 5.4 1.7 3.6 7.9 8.2 26.8 CTSM-3x Autumn 5.6 2.0 8.5 37.1 33.8 87.0 CTSM-1x Autumn 3.8 1.5 3.9 7.3 9.0 25.5 ADSM-3x Spring 7.2 1.6 4.8 11.8 13.2 38.6 ADSM-1x Spring 4.9 0.8 1.9 4.5 6.3 18.4 CTSM-3x Spring 5.8 1.3 7.5 25.8 21.2 61.6 CTSM-1x Spring 3.9 1.0 3.6 7.1 8.1 23.7 UAN Spring 4.8 1.1 4.3 7.3 8.3 25.8 LSD0.05 ns 0.7 3.9 10.6 7.3 18.8 SEM (Probability) 0.88ns 0.23* 1.35* 3.67*** 2.52*** 6.49*** Manure rate 1x 4.5 1.2 3.2 6.7 7.9 23.5 3x 5.9 1.6 6.9 22.2 21.2 57.8 LSD0.05 1.3 0.4 2.0 6.8 4.7 12.1 SEM (Probability) 0.43* 0.13• 0.69** 2.34*** 1.63*** 4.16*** Manure type ADSM 5.7 1.4 4.2 9.6 11.1 32.0 CTSM 4.8 1.4 5.9 19.3 18.0 49.4 LSD0.05 1.3 ns 2.0 6.8 4.7 12.1 SEM (Probability) 0.43• 0.13 ns 0.69• 2.34** 1.63** 4.16** Manure application time Autumn 5.0 1.6 5.6 16.6 16.9 45.7 Spring 5.4 1.2 4.5 12.3 12.2 35.6 LSD0.05 ns 0.4 ns 6.8 4.7 12.1 SEM (Probability) 0.43ns 0.13* 0.69ns 2.34 ns 1.63* 4.16• •, *, **, *** and ns refer to significant treatment effects in ANOVA at P ≤ 0.10, P ≤ 0.05, P ≤ 0.01, P ≤ 0.001 and not significant, respectively. could not be accounted for ranged from −132 to 57 kg·N·ha−1. The amounts of unaccounted N from N ap- plied/added ranged from 91 to 192 kg·N·ha−1. At Swift Current, the estimated amounts of nitrate-N recovered in soil in autumn 2008 plus N recovered (removed) in seed in 3 years in various treatments ranged from 170 to 399 kg·N·ha−1. The corresponding values of N applied as UAN fertilizer or manure plus N added in seed at seed- ing in 3 years ranged from 7 to 410 kg·N·ha−1. The amounts of N that could not be accounted for ranged from −163 to 101 kg·N·ha−1. The amounts of unac- counted N from N applied/added ranged from 35 to 207 kg·N·ha−1. The percent recovery of applied N over 3 years ranged from 37.7% to 50.0% in seed and from 50.7% to 65.0% in seed + straw at Star City, and from 0.3% to 7.0% in seed and from 27.5 to 54.7 in seed + straw at 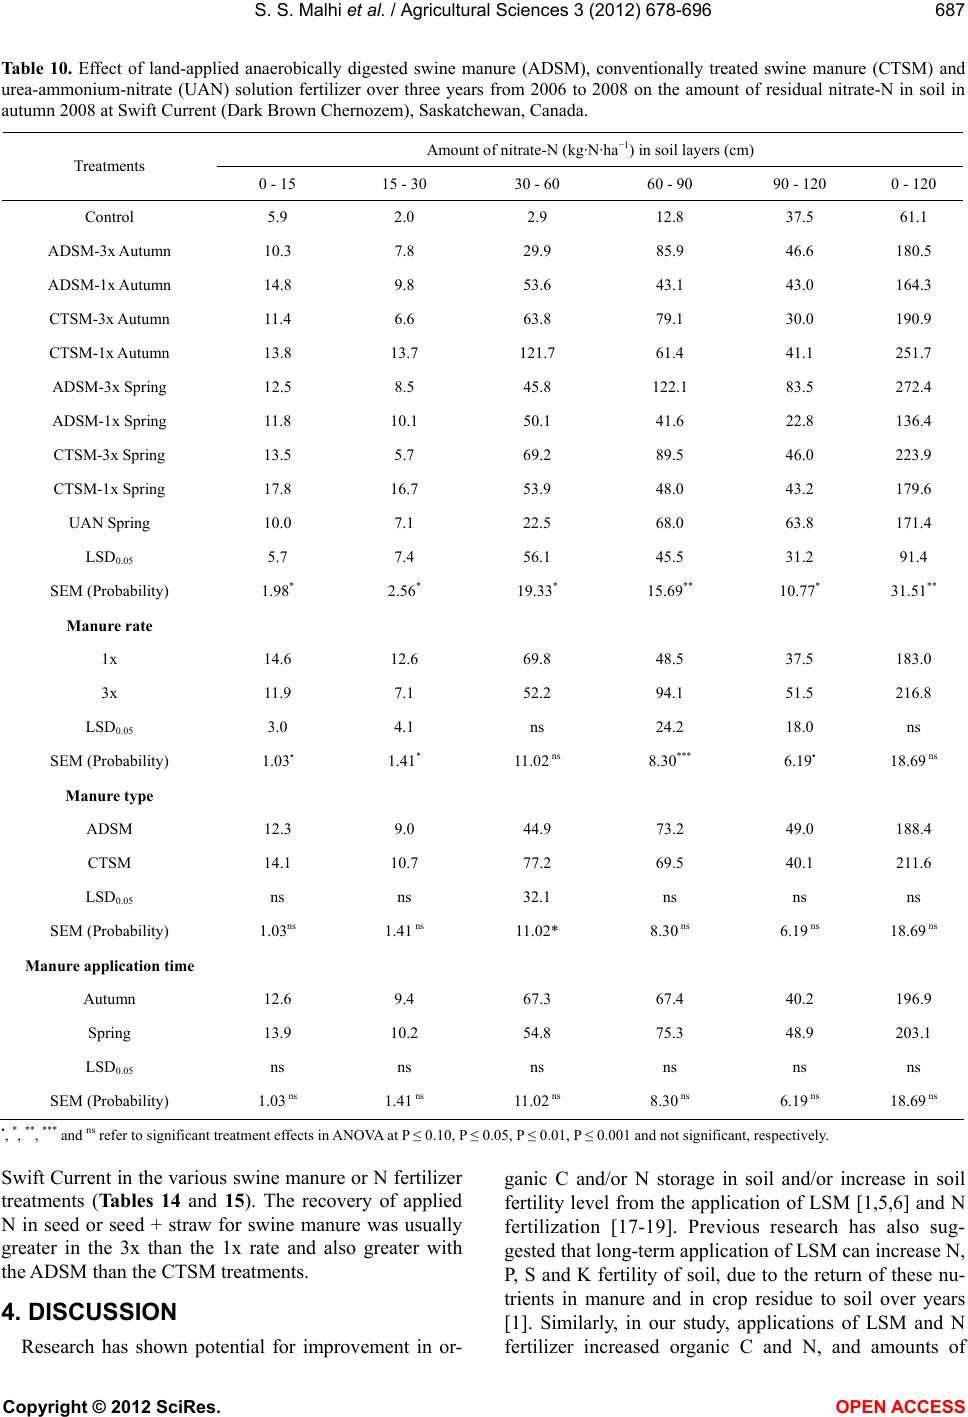 S. S. Malhi et al. / Agricultural Sciences 3 (2012) 678-696 Copyright © 2012 SciRes. OPEN ACCESS 687 Table 10. Effect of land-applied anaerobically digested swine manure (ADSM), conventionally treated swine manure (CTSM) and urea-ammonium-nitrate (UAN) solution fertilizer over three years from 2006 to 2008 on the amount of residual nitrate-N in soil in autumn 2008 at Swift Current (Dark Brown Chernozem), Saskatchewan, Canada. Amount of nitrate-N (kg·N·ha−1) in soil layers (cm) Treatments 0 - 15 15 - 30 30 - 60 60 - 90 90 - 120 0 - 120 Control 5.9 2.0 2.9 12.8 37.5 61.1 ADSM-3x Autumn 10.3 7.8 29.9 85.9 46.6 180.5 ADSM-1x Autumn 14.8 9.8 53.6 43.1 43.0 164.3 CTSM-3x Autumn 11.4 6.6 63.8 79.1 30.0 190.9 CTSM-1x Autumn 13.8 13.7 121.7 61.4 41.1 251.7 ADSM-3x Spring 12.5 8.5 45.8 122.1 83.5 272.4 ADSM-1x Spring 11.8 10.1 50.1 41.6 22.8 136.4 CTSM-3x Spring 13.5 5.7 69.2 89.5 46.0 223.9 CTSM-1x Spring 17.8 16.7 53.9 48.0 43.2 179.6 UAN Spring 10.0 7.1 22.5 68.0 63.8 171.4 LSD0.05 5.7 7.4 56.1 45.5 31.2 91.4 SEM (Probability) 1.98* 2.56* 19.33* 15.69** 10.77* 31.51** Manure rate 1x 14.6 12.6 69.8 48.5 37.5 183.0 3x 11.9 7.1 52.2 94.1 51.5 216.8 LSD0.05 3.0 4.1 ns 24.2 18.0 ns SEM (Probability) 1.03• 1.41* 11.02 ns 8.30*** 6.19• 18.69 ns Manure type ADSM 12.3 9.0 44.9 73.2 49.0 188.4 CTSM 14.1 10.7 77.2 69.5 40.1 211.6 LSD0.05 ns ns 32.1 ns ns ns SEM (Probability) 1.03ns 1.41 ns 11.02* 8.30 ns 6.19 ns 18.69 ns Manure application time Autumn 12.6 9.4 67.3 67.4 40.2 196.9 Spring 13.9 10.2 54.8 75.3 48.9 203.1 LSD0.05 ns ns ns ns ns ns SEM (Probability) 1.03 ns 1.41 ns 11.02 ns 8.30 ns 6.19 ns 18.69 ns •, *, **, *** and ns refer to significant treatment effects in ANOVA at P ≤ 0.10, P ≤ 0.05, P ≤ 0.01, P ≤ 0.001 and not significant, respectively. Swift Current in the various swine manure or N fertilizer treatments (Tabl es 1 4 and 15). The recovery of applied N in seed or seed + straw for swine manure was usually greater in the 3x than the 1x rate and also greater with the ADSM than the CTSM treatments. 4. DISCUSSION Research has shown potential for improvement in or- ganic C and/or N storage in soil and/or increase in soil fertility level from the application of LSM [1,5,6] and N fertilization [17-19]. Previous research has also sug- gested that long-term application of LSM can increase N, P, S and K fertility of soil, due to the return of these nu- trients in manure and in crop residue to soil over years [1]. Similarly, in our study, applications of LSM and N fertilizer increased organic C and N, and amounts of  S. S. Malhi et al. / Agricultural Sciences 3 (2012) 678-696 Copyright © 2012 SciRes. OPEN ACCESS 688 Ta b l e 11. Effect of land-applied anaerobically digested swine manure (ADSM), conventionally treated swine manure (CTSM) and urea-ammonium-nitrate (UAN) solution fertilizer over three years from 2006 to 2008 on the amount of residual extractable P in soil in autumn 2008 at Star City (Gray Luvisol), Saskatchewan, Canada. Amount of extractable P (kg·N·ha−1) in soil layers (cm) Treatments 0 - 15 15 - 30 30 - 60 60 - 90 90 - 120 0 - 120 Control 21.4 8.6 12.6 6.0 4.5 53.1 ADSM-3x Autumn 22.0 11.5 7.1 5.7 4.3 50.6 ADSM-1x Autumn 21.7 10.5 9.1 3.9 3.3 48.5 CTSM-3x Autumn 18.4 8.6 10.9 3.3 3.6 44.8 CTSM-1x Autumn 27.2 11.9 7.4 4.7 5.0 56.2 ADSM-3x Spring 18.4 9.1 10.3 5.5 4.2 47.5 ADSM-1x Spring 34.2 16.8 8.7 4.8 4.1 68.6 CTSM-3x Spring 39.3 11.2 12.7 6.4 4.2 73.8 CTSM-1x Spring 24.0 9.8 10.8 5.0 7.5 57.1 UAN Spring 21.8 10.0 9.4 4.8 5.2 51.2 LSD0.05 ns ns ns ns ns ns SEM (Probability) 5.88ns 2.29 ns 3.42 ns 1.06 ns 1.43 ns 8.28 ns Manure rate 1x 26.8 12.3 9.0 4.6 5.0 57.5 3x 24.5 10.1 10.3 5.2 4.1 54.2 LSD0.05 ns ns ns ns ns ns SEM (Probability) 3.24ns 1.21ns 1.73ns 0.53ns 0.76ns 4.39ns Manure type ADSM 24.1 12.0 8.8 5.0 4.0 53.9 CTSM 27.2 10.4 10.5 4.9 5.1 58.1 LSD0.05 ns ns ns ns ns ns SEM (Probability) 3.24ns 1.21ns 1.73ns 0.53ns 0.76ns 4.39ns Manure application time Autumn 22.3 10.6 8.6 4.4 4.1 50.0 Spring 29.0 11.7 10.6 5.4 5.0 61.7 LSD0.05 ns ns ns ns ns 12.8 SEM (Probability) 3.24ns 1.21ns 1.73ns 0.53ns 0.76ns 4.39• • and ns refer to significant treatment effects in ANOVA at P ≤ 0.10 and not significant, respectively. plant-available N, P or S in soil in many cases, depend- ing on soil type/site. The following sections discuss the short-term effects of LSM and N fertilization on soil biochemical and chemical properties. 4.1. Soil Biochemical Properties Earlier research has shown positive effects of swine manure or N fertilizer application on crop yield, and soil organic matter and fertility [1,5,6]. Similarly, we found increase in TOC and TON from swine manure applica- tion due to its dual effect by directly contributing to or- ganic C and N, plus additional indirect contribution of C from increased crop residue (roots, stubble, straw, chaff/ fallen leaves) returned to the land/soil, as evidenced by greatest increase in straw yield in this treatment [7]. In- organic fertilizers supply specific nutrients, but do not  S. S. Malhi et al. / Agricultural Sciences 3 (2012) 678-696 Copyright © 2012 SciRes. OPEN ACCESS 689 Table 12. Effect of land-applied anaerobically digested swine manure (ADSM), conventionally treated swine manure (CTSM) and urea-ammonium-nitrate (UAN) solution fertilizer over three years from 2006 to 2008 on the amount of residual extractable P in soil in autumn 2008 at Swift Current (Dark Brown Chernozem), Saskatchewan, Canada. Amount of extractable P (kg·P·ha−1) in soil layers (cm) Treatments 0 - 15 15 - 30 30 - 60 60 - 90 90 - 120 0 - 120 Control 53.0 8.4 7.7 7.3 13.4 89.7 ADSM-3x Autumn 55.0 9.1 8.7 8.2 13.9 94.9 ADSM-1x Autumn 51.6 8.4 11.0 8.0 19.6 98.6 CTSM-3x Autumn 48.4 8.1 6.9 7.3 25.9 96.6 CTSM-1x Autumn 56.8 10.6 7.1 9.1 24.7 108.3 ADSM-3x Spring 48.1 11.0 11.6 5.4 16.6 92.7 ADSM-1x Spring 52.4 8.4 8.5 4.6 16.7 90.6 CTSM-3x Spring 66.6 13.7 8.1 6.1 15.7 110.2 CTSM-1x Spring 59.6 8.6 7.2 6.2 18.4 100.0 UAN Spring 54.3 10.4 9.1 5.3 14.6 93.7 LSD0.05 ns ns ns ns ns ns SEM (Probability) 7.25ns 2.01 ns 1.68 ns 1.80 ns 3.33 ns 8.64 ns Manure rate 1x 55.1 9.0 8.5 7.0 19.8 99.4 3x 54.5 10.5 8.8 6.8 18.0 98.6 LSD0.05 ns ns ns ns ns ns SEM (Probability) 3.71ns 1.02ns 0.83ns 0.87ns 1.77ns 4.06ns Manure type ADSM 51.8 9.2 10.0 6.5 16.7 94.2 CTSM 57.9 10.3 7.4 7.2 21.2 104.0 LSD0.05 ns ns 2.4 ns 5.2 11.8 SEM (Probability) 3.71ns 1.02ns 0.83* 0.87ns 1.77• 4.06• Manure application time Autumn 53.0 9.1 8.4 8.2 21.0 99.7 Spring 56.7 10.5 8.9 5.6 16.8 98.5 LSD0.05 ns ns ns 2.5 5.2 ns SEM (Probability) 3.71ns 1.02ns 0.83ns 0.87* 1.77• 4.06ns •, * and ns refer to significant treatment effects in ANOVA at P ≤ 0.10, P ≤ 0.05 and not significant, respectively. contribute directly to soil organic matter, and thus may result in much less contribution to soil organic C and N. However, in our study, there was relatively greater stor- age of organic C and N from N fertilizer application than swine manure, at least at Star City site. The smaller stor- age of TOC or TON from swine manure or UAN fertil- izer applications at Star City than Swift Current was probably due to the differences in soil type (Gray Luvisol loam soil at Star City versus Brown Chernozem silt loam at Swift Current) and climatic conditions (relatively moister soils at Star City than Swift Current) at the two sites, resulting in greater turn over of organic matter at Star City compared to Swift Current. In our study, the changes in LFOC and LFON due to LSM application and N fertilization were more pro- nounced than TOC and TON in both soils. For example,  S. S. Malhi et al. / Agricultural Sciences 3 (2012) 678-696 Copyright © 2012 SciRes. OPEN ACCESS 690 Table 13. Effect of land-applied anaerobically digested swine manure (ADSM), conventionally treated swine manure (CTSM) and urea-ammonium-nitrate (UAN) solution fertilizer over three years from 2006 to 2008 on the amount of residual sulphate-S in soil in autumn 2008 at Star City (Gray Luvisol), Saskatchewan, Canada. Amount of sulphate-S (kg·S·ha−1) in soil layers (cm) Treatments 0 - 15 15 - 30 30 - 60 60 - 90 90 - 120 0 - 120 Control 27.9 8.8 12.7 11.2 13.8 74.4 ADSM-3x Autumn 23.3 9.7 20.5 44.5 45.1 143.1 ADSM-1x Autumn 27.8 10.4 13.2 19.0 30.1 100.5 CTSM-3x Autumn 18.9 10.1 13.4 10.7 9.9 63.0 CTSM-1x Autumn 22.7 11.1 16.5 38.2 42.6 131.1 ADSM-3x Spring 30.2 10.1 11.6 12.1 11.2 75.2 ADSM-1x Spring 25.8 9.1 10.4 9.5 8.8 63.6 CTSM-3x Spring 18.1 9.8 13.2 9.5 8.6 59.4 CTSM-1x Spring 17.0 8.1 12.7 13.9 22.2 73.9 UAN Spring 18.6 10.3 12.0 12.4 13.7 67.0 LSD0.05 ns ns ns ns ns ns SEM (Probability) 6.48ns 0.99ns 4.24ns 12.68ns 11.77ns 28.29ns Manure rate 1x 23.3 9.7 13.2 20.1 25.9 92.2 3x 22.7 9.9 14.7 19.2 18.8 85.3 LSD0.05 ns ns ns ns ns ns SEM (Probability) 3.15ns 0.51ns 2.23ns 7.04ns 6.62ns 15.42ns Manure type ADSM 26.8 9.8 13.9 21.3 23.8 95.6 CTSM 19.2 9.8 13.9 18.1 20.9 81.9 LSD0.05 9.2 ns ns ns ns ns SEM (Probability) 3.15• 0.51ns 2.23ns 7.04ns 6.62ns 15.42ns Manure application time Autumn 23.2 10.3 15.9 28.1 31.9 109.4 Spring 22.8 9.3 12.0 11.2 12.8 68.1 LSD0.05 ns ns ns 20.5 19.3 44.9 SEM (Probability) 3.15ns 0.51ns 2.23ns 7.04• 6.62* 15.42• •, * and ns refer to significant treatment effects in ANOVA at P ≤ 0.10, P ≤ 0.05 and not significant, respectively. in the 0 - 15 cm soil layer after 3 years, and compared to the zero-N control treatment, the manure and N fertilizer treatments, respectively, increased TOC by 10.1% and 3.2%, TON by 9.5% and 2.3%, LFOC by 22.3% and 16.0% and LFON by 20.6% and 12.9% at Star City. The corresponding increases at Swift Current were 7.1% and 7.8% for TOC, 1.4% and 4.9% for TON, 34.4% and 41.5% for LFOC and 34.6% and 41.5% for LFON, re- spectively. Other researchers have also observed greater responses of LFOC and LFON to N fertilization and other management practices than TOC and TON [18-20]. Our findings confirm that the changes in LFOC and LFON can be considered good indicators of changes of organic C and N in soil as a result of manure addition or appropriate fertilization. This also suggests that monitor- ing the changes in LFON and LFOC in the surface soil  S. S. Malhi et al. / Agricultural Sciences 3 (2012) 678-696 Copyright © 2012 SciRes. OPEN ACCESS 691 Table 14. Balance sheets of land-applied anaerobically digested swine manure (ADSM), conventionally treated swine manure (CTSM) and urea-ammonium-nitrate (UAN) solution fertilizer over three years from 2006 to 2008 at Star City (Gray Luvisol), Sas- katchewan, Canada. Treatments Fall application Spring application Parameters Control UAN spring ADSM-3x ADSM-1xCTSM-3xCTSM-1xADSM-3x ADSM-1x CTSM-3xCTSM-1x Nitrate-N recovered in soil (0 - 90 cm) after 3 years in fall 2008 (kg·N·ha−1) 21 26 44 27 87 26 39 18 62 24 N recovered in seed in 3 years kg·N·ha−1) 118 199 225 204 270 284 235 242 253 262 N recovered in soil after 3 years + N recovered in seed in 3 years (kg·N·ha−1) 139 225 269 231 357 310 274 260 315 286 Total N applied in UAN or in SM in 3 years (kg·N·ha−1) 0 180 214 205 403 360 257 255 343 326 Organic N added in seed in 3 years (kg·N·ha−1) 7 7 7 7 7 7 7 7 7 7 Total N added in UAN + SM + seed in 3 years (kg·N·ha−1) 7 187 221 212 410 367 264 262 350 333 N balance (N applied in UAN/SM/seed – N recovered in seed) (kg·N·ha−1) −111 −12 −4 8 140 83 29 20 97 71 Unaccounted N (N applied in UAN/SM/seed – N recovered in soil + seed) (kg·N·ha−1) −132 −38 −48 −19 53 57 −10 2 35 47 N recovered in seed in 3 years from applied N (kg·N·ha−1) 81 107 86 152 166 117 124 135 144 N recovered in soil after years + seed in 3 years from applied N (kg·N·ha−1) 86 130 92 218 171 134 121 176 147 N balance (N applied in UAN/SM/seed – N recovered in seed from applied N) (kg·N·ha−1) 106 114 126 258 201 147 138 215 189 Unaccounted N (N applied in UAN/SM/seed – N recovered in soil + seed from applied N) (kg·N·ha−1) 101 91 120 192 196 130 141 174 186 Recovery of applied N in seed over 3 years (%) 45.0 50.0 42.0 37.7 46.1 45.5 48.6 39.4 44.2 N recovered in seed + straw in 3 years (kg·N·ha−1) 159 264 298 263 365 371 313 311 346 341 Recovery of applied N in seed + straw over 3 years (%) 58.3 65.0 50.7 51.1 58.9 59.9 59.6 54.5 55.8 could be a good strategy to determine the potential for N supplying power, and improvement in soil quality/health. The trends of higher organic C and N in light organic fractions than total organic fractions in the manure and N fertilizer treatments were most likely associated with greater inputs of C and N to soil through manure, and also straw, chaff [17] and roots [21,22]. The relative greater increases in C or N for LFOC or LFON than TOC or TON in our study are in agreement with other research, where light organic fraction was also more responsive to management practices than total or- ganic fraction [18-20]. Unlike TOC and TON, there was a greater build-up of light fraction organic C or N at Swift Current than at Star City, in spite of greater input of C from crop residues plus LSM in 3 years at Star City than Swift Current. We do not have any real explanation for this unusual trend for the greater build-up of light organic fraction under relatively warmer temperature conditions at Swift Current than Star City, but this may be possibly due to relatively drier conditions which may have resulted in relatively slower decomposition of freshly added crop residues at swift Current than Star City. Earlier long-term research studies have shown strong and highly significant correlations among TOC, TON, LFOC and LFON fractions in soil due to management practices [18-20]. However, in our study, the strong posi- tive correlations were found only between TOC and TON,  S. S. Malhi et al. / Agricultural Sciences 3 (2012) 678-696 Copyright © 2012 SciRes. OPEN ACCESS 692 Table 15. Balance sheets of land-applied anaerobically digested swine manure (ADSM), conventionally treated swine manure (CTSM) and urea-ammonium-nitrate (UAN) solution fertilizer over three years from 2006 to 2008 at Swift Current (Dark Brown Chernozem), Saskatchewan, Canada. Treatments Fall application Spring application Parameters Control UAN spring ADSM-3x ADSM-1xCTSM-3xCTSM-1xADSM-3x ADSM-1x CTSM-3xCTSM-1x Nitrate-N recovered in soil (0 - 90 cm) after 3 years in autumn 2008 (kg·N·ha−1)61 171 181 164 191 252 272 136 224 180 N recovered in seed in 3 years (kg·N·ha−1) 109 110 123 114 118 110 127 112 132 116 N recovered in soil after 3 years + N recovered in seed in 3 years kg·N·ha−1) 170 281 304 278 309 362 399 248 356 296 Total N applied in UAN or in SM in 3 years (kg·N·ha−1) 0 180 214 205 403 360 257 255 343 326 Organic N added in seed in 3 years (kg·N·ha−1) 7 7 7 7 7 7 7 7 7 7 Total N added in UAN + SM + seed in 3 years (kg·N·ha−1) 7 187 221 212 410 367 264 262 350 333 N balance (N applied in UAN/SM/seed – N recovered in seed) (kg·N·ha−1) −102 77 98 98 292 257 137 150 218 217 Unaccounted N (N applied in UAN/SM/seed – N recovered in soil + seed) (kg·N·ha−1) −163 −94 −83 −66 101 5 −135 14 −6 37 N recovered in seed in 3 years from applied N kg·N·ha−1) 1 14 5 9 1 18 3 23 7 N recovered in soil after years + seed in 3 years from applied N (kg·N·ha−1) 111 134 108 139 192 229 78 186 126 N balance (N applied in UAN/SM/ seed – N recovered in seed from applied N) (kg·N·ha−1) 186 207 207 401 366 249 259 327 326 Unaccounted N (N applied in UAN/SM/seed – N recovered in soil + seed from applied N) (kg·N·ha−1) 76 87 104 271 175 35 184 164 207 Recovery of applied N in seed over 3 years (%) 0.6 6.5 2.4 2.2 0.3 7.0 1.2 6.7 2.1 N recovered in seed + straw in 3 years (kg·N·ha−1) 162 242 279 240 297 261 290 233 299 259 Recovery of applied N in seed + straw over 3 years (%) 44.4 54.7 38.0 35.5 27.5 49.8 27.8 39.9 29.8 and between LFOC and LFON in both soils. Previous long-term studies have shown positive relationships be- tween the input of increased amounts of manure and/or crop residue C or N and TOC, TON, LFOC or LFON, especially in the labile/light organic fractions [18-20, 23,24]. However, in our study after 3 years, the signifi- cant linear regressions between the amounts of C or N input and mass of organic C or N in the 0 - 15 cm soil layer in various organic fractions were found only for LFOC and LFON and only at Swift Current. This lack of significant relationships between C or N input and mass of organic C or N stored in soil was probably due to short duration of our study. 4.2. Soil Chemical Properties and Distribution of Available N, P, K and S in the Soil Profile Slow acidification of soil from N fertilization has been earlier reported after long-term annual applications of moderate rates of N fertilizer to annual crops in North America [25-27]. However, in our study, there was no effect of manure or N fertilization on soil pH, and this was probably due to the shorter duration of our present study. In a study in Quebec, Canada, Ndayegamiye and Cote [5] also found no effect of pig slurry application on soil pH even after 10 annual applications. There was no build-up of residual ammonium-N in  S. S. Malhi et al. / Agricultural Sciences 3 (2012) 678-696 Copyright © 2012 SciRes. OPEN ACCESS 693 soil after three annual applications of swine manure or N fertilizer, no doubt due to the rapid nitrification of any ammonium-N released during mineralization of organic matter. The amount of residual nitrate-N in soil increased with increasing rate of swine manure in the 30 - 60, 60 - 90 and 90 - 120 cm layers in the 0 - 120 cm soil profile, particularly at Swift Current. This suggests potential risk of nitrate leaching below the root zone, even within the short duration of our study (only three years), as other long-term studies in China have shown a great potential of underground water contamination with nitrate-N from annual applications of farmyard manure (FYM) at rela- tively high rates [28-30]. Our findings also suggest the need for deep soil sampling, as soils in our study were sampled only to the 120 cm depth. In our study at Star City, there was a significant increase in nitrate-N in the soil profile with 3x LSM rate while there was only little increase in residual nitrate-N in the 0 - 120 cm soil pro- file due to fertilizer N application. The rate of fertilizer-N applied in our study was below the rate needed for opti- mum yield in this soil-climatic region [31], and the amount of N removed in the grain closely matched the amount of fertilizer-N added. This would have mini- mized the amount of surplus N available for leaching or other losses. However, a portion of the applied N may have been immobilized into the soil organic N pool, es- pecially when straw was retained [20]. It is also possible that a portion of the residual soil nitrate-N may have been lost as gaseous N over the winter and especially in early spring after snow melting [32,33]. It is unlikely that much of the applied N at Star City leached below the 120 cm depth, as evidenced by little residual nitrate-N recov- ered in the 30 - 60, 60 - 90 and 90 - 120 cm soil layers in autumn 2008 sampling At Swift Current, the amounts of fertilizer and manure N applied exceeded the amounts of N removed in the grain, and based on the moderate amounts of residual nitrate-N recovered in the 30 - 60, 60 - 90 and 90 - 120 cm soil layers in autumn 2008 at Swift Current it may well that a portion of the applied N had leached below the 120 cm depth, particularly at the high rate of manure. Previous research in Saskatchewan where soil samples were taken to 240 cm depth after 12 growing seasons, Malhi et al. [34] observed large amounts of residual ni- trate-N accumulation in the 210 - 240 cm layer for treat- ments where N applications had exceeded N removals. It should be noted that at Swift Current, crops were drought stressed during grain filling during both 2006 and 2007 and final grain yields were greatly depressed, while in 2008 the study suffered severe hail damage prior to grain filling. Minimal grain N uptake at Swift Current in all three years no doubt influenced the amount of nitrate N accumulating in the soil profile. Regardless, the results also emphasizes the need for deep soil sampling (maybe up to 3 or 4 m depth) in future research in order to make valid conclusions related to nitrate leaching losses in the soil profile. Earlier research in China has shown substantial in- crease in extractable P and total P in soil with long-term annual applications of FYM [35]. In our study, there was a tendency towards increased extractable P in the surface 0 - 5 cm soil with swine manure in some treatments even after three annual applications, probably due to fairly high concentration of P in swine manure. The increase of extractable P with swine manure only in the 0 - 15 cm soil layer suggests that P is relatively immobile, but the slow build-up of P in the surface soil, especially after repeated applications to increase crop production, may subsequently increase the potential risk of contamination of surface waters with P from surface run-off of water after snow melt in early spring and/or after heavy rainfall events which often occur in this region during summer. Sulphate-S in soil tended to increase with swine ma- nure at Star City. This suggests that swine manure either contained sulphate-S or possibly increased sulphate-S through mineralization of organic matter. Sulphate-S increased with increasing rate of swine manure. It is pos- sible that a portion of the sulphate-S may have leached below the 120 cm depth, as evidenced by large amounts of sulphate-S in the 30 - 60, 60 - 90 and 90 - 120 cm lay- ers, although no soil samples were obtained below 120 cm to verify this in our study. This suggests the need for future soil sampling to greater depths in order to make valid conclusions related to sulphate-S leaching. Earlier research in Saskatchewan has suggested that long-term application of LSM can increase K fertility of soil, due to the return of these nutrients in manure and in crop resi- due to soil over years [1]. However, in our present study, there was no increase in extractable K in soil from LSM or UAN application over three years at both sites. 4.3. Amounts of N Uptake in Crop, Nitrate-N in Soil, N Balance Sheets, and Recovery of Applied N The amounts of unaccounted N increased with appli- cation of swine manure or N fertilizer compared to zero-N control. This unaccounted N reflects a portion of the applied N which did not become available to the crop, and may have been lost from the soil mineral N pool and/or from the soil-plant system. At Star City, it is unlikely that a portion of the applied N was leached down below 120 cm soil depth, because there was little nitrate-N recovered in the deeper soil layers in autumn 2008. At Swift Current, it is possible that a portion of the applied N may have leached down below 120 cm soil depth, because there were large amounts of nitrate-N recovered in the 30 - 60, 60 - 90 and 90 - 120 cm soil  S. S. Malhi et al. / Agricultural Sciences 3 (2012) 678-696 Copyright © 2012 SciRes. OPEN ACCESS 694 layers in autumn 2008 in many cases for swine manure and UAN treatments. Other researchers have reported an increase in the concentration of residual nitrate-N in the soil profile at high N fertilizer rates [36-39], and any soil nitrate-N below the effective root zone of crops is sus- ceptible to leaching, The loss of nitrate-N through leach- ing can result in N contamination of groundwater, and thus represents a potential risk to groundwater quality and soil health [40]. Our N balance results suggest that a portion of the applied N in the N treatments may have been immobilized in soil organic N, as evidenced by higher amount of soil organic N, especially in LFON even after 3 years in autumn 2008 (Ta b l e s 3 - 6 ). At Star City, the amount of applied N recovered in LFON in soil ranged from −155 to 290 kg·N·ha−1 in various swine manure and UAN treatments. The corresponding values for the amounts of applied N recovered in total organic N in soil at Swift Current ranged from 36 to 529 kg·N·ha−1. In addition, it is possible that a portion of the applied N may have been lost from the soil-plant system through denitrification (e.g., nitrous oxide and other N gases) due to wet surface soil conditions which temporarily exist in the present study area in most years in early spring after snow melt, or after occasional heavy rainfalls during summer and/or autumn [32,33,41]. It is also possible that a small portion of the applied N may have leached below the 120 cm soil depth profile, as suggested by Malhi et al. [34] who found large amounts of nitrate-N accumulation in the 120 to 240 cm soil profile in a long-term study in Saskatchewan with high input of N fertilizer and low crop intensity. This suggests the need for deep soil sam- pling below the 120 cm depth in future in our present long-term experiments. Overall, the amount of residual soil nitrate-N recov- ered in the 0 - 120 cm soil profile was relatively small in the Gray Luvisol soil at Star City. This indicates low ac- cumulation of nitrate-N in the soil profile. However, large amounts of unaccounted N from applied N suggest a great potential for gaseous N loss, especially in early spring after snow thawing when the surface soil is very wet (conducive to denitrification), and N immobilization, and possibility of some nitrate-N leaching below the 120 cm depth soil profile in the Brown Chernozem soil at Swift Current. However, as noted previously, grain N uptake was limited due to environmental conditions which no doubt influenced the amount of nitrate N ac- cumulating in the soil profile. There were large amounts of N balance and unaccounted N in the zero-N treatments and also in the swine manure or N fertilizer treatments, especially at Swift Current. The implication of these large negative values for N balance and unaccounted N in the zero-N treatments is that large amounts of N be- came available to the crops in the growing seasons through mineralization of soil organic matter. However, the large negative values for N balance and unaccounted N in the N fertilizer treatments at Swift Current suggest that the soil at this site may be gaining some N by wet/ dry deposition through precipitation (rain/snow) and po- ssibly by non-symbiotic N fixation. The Swift Current site is not close to any large city or industry, we don’t know if soil at this site gained any N deposited through dry (snow) and wet (rainfall) precipitation. This supports the need for future research to obtain information on the contribution of N from rain/snow and non-symbiotic N fixation, or other outside sources, in order to optimize the use and accounting of N resources, and their effects on greenhouse gas (GHG) emissions to the atmosphere. The percent recovery of applied N over 3 years ranged from 37.7% to 50.0% in seed and from 50.7% to 65.0% in seed + straw at Star City, and from 0.3% to 7.0% in seed and from 27.5 to 54.7 in seed + straw at Swift Cur- rent in various swine manure or N fertilizer treatments (Tables 13 and 14). The recovery of applied N in seed or seed + straw for swine manure was usually greater in the 3x rate than the 1x rate and also greater with the ADSM than the CTSM treatments. The greater recovery of ap- plied N from swine manure in seed or seed + straw with the 3x rate than the 1x rate was possibly due to greater mineralization of any organic N because of much longer time of contact with soil microorganisms. The poor re- covery of applied N in LSM or UAN fertilizer at Swift Current was most likely due to lack of crop response to these amendments, thus low input of organic C or N from crop residue which probably is the main/major source of C or N input to soil. 5. CONCLUSION Our findings suggest that the quantity and quality of organic C and N in soil can be affected by swine manure rate and type, and N fertilization, most likely influencing inputs of C and N through crop residue, and improve soil quality. 6. ACKNOWLEDGEMENTS We are grateful to Environmental Technologies Assessment for Ag- riculture (ETAA) program for funding, Prairie Agricultural Machinery Institute (PAMI) for excellent collaboration, Cudworth Pork Investors Group Ltd. and Clear-Green Environmental Inc. for providing access to raw and digested material, and D. Leach, D. Hahn and D. James for technical help. REFERENCES [1] Mooleki, S.P., Schoenau, J.J., Hultgreen, G., Wen, G. and Charles, J.L. (2002) Effect of rate, frequency and method of liquid hog manure application on soil nitrogen avail- ability, crop performance and N use efficiency in east-  S. S. Malhi et al. / Agricultural Sciences 3 (2012) 678-696 Copyright © 2012 SciRes. OPEN ACCESS 695 central Saskatchewan. Canadian Journal of Soil Science, 82, 457-467. doi:10.4141/S01-057 [2] Mooleki, S.P., Schoenau, J.J., Hultgreen, G., Malhi, S.S. and Brandt, S. (2003) Soil and crop response to injected liquid hog manure on two Gray Luvisols. Proceedings of Soils and Crops Workshop, University of Saskatchewan, Saskatoon. [3] Schoenau, J.J., Mooleki, S.P., Qian, P. and Malhi, S.S. (2003) Balancing availability of nutrients in manured soils. Proceedings of Soils and Crops Workshop, Univer- sity of Saskatchewan, Saskatoon. [4] Saskatchewan Agriculture and Food (SAF) (2003) Tri- Provincial manure application and use guidelines. Gov- ernment of Saskatchewan, Regina Saskatchewan. [5] Ndayegamiye, A. and Cote, D. (1989) Effect of long-term pig slurry and solid cattle manure application on soil che- mical and biochemical properties. Canadian Journal of Soil Science, 69, 39-47. doi:10.4141/cjss89-005 [6] Schoenau, J.J. and Assefa, B. (2004) Land application and handling of manure. In: M. Amrani, Ed., Manure Re- search Findings and Technologies, Alberta Agriculture, Food and Rural Development, Technical Press, Edmonton, 97-140. [7] Lemke, R.L., Malhi, S.S., Selles, F. and Stumborg, M. (2012) Agronomic and greenhouse gas assessment of land-applied anaerobically-digested swine manure. Agri- cultural Scie nces , In Review. [8] Culley, J.L.B. (1993) Density and compressibility. In: Carter, M.R., Ed., Soil Sampling and Methods of Analysis, Lewis Publishers, Boca Raton, 529-549. [9] Technicon Industrial Systems (1977) Industrial/simulta- neous determination of nitrogen and/or phosphorus in BD acid digests. Industrial Method No. 334-74W/Bt, New York. [10] Janzen, H.H., Campbell, C.A., Brandt, S.A., Lafond, G.P. and Townley-Smith, L. (1992) Light-fraction organic mat- ter in soil from long term rotations. Soil Science Society of America Journal, 56, 1799-1806. doi:10.2136/sssaj1992.03615995005600060025x [11] Izaurralde, R.C., Nyborg, M., Solberg, E.D., Janzen, H.H., Arshad, M.A., Malhi, S.S. and Molina-Ayala, M. (1997) Carbon storage in eroded soils after five years of recla- mation techniques. In: Lal, R., Kimble, J.M., Follett, R.F. and Stewart, B.A., Eds., Management of Carbon Seques- tration in Soil, Advances in Soil Science, CRC Press, Boca Raton, 369-385. [12] Technicon Industrial Systems (1973) Ammonium in water and waste water. Industrial Method No. 90-70W-B. Re- vised January 1978. Technicon Industrial Systems, New York. [13] Technicon Industrial Systems (1973) Nitrate in water and waste water. Industrial Method No. 100-70W-B. Revised January 1978. Technicon Industrial Systems, New York. [14] Qian, P., Schoenau, J.J. and Karamanos, R.E. (1994) Si- multaneous extraction of phosphorus and potassium with a new soil test: A modified Kelowna extraction. Commu- nications in Soil Science and Plant Analysis, 25, 627-635. doi:10.1080/00103629409369068 [15] Combs, S.M., Denning, J.L. and Frank, K.D. (1998) Sul- fate-sulfur. Recommended Chemical Soil Test Procedures for the North Central Region. Missouri Agriculture Ex- periment Station Publication No. 221 (revised). Extension and Agricultural Information, I-98 Agricultural Building, University of Missouri, Columbia, 35-39. [16] SAS Institute Inc. (2004) SAS product documentation. Version 8. http://support.sas.com/documentation/onlinedoc/index.html [17] Malhi, S.S. and Lemke, R. (2007) Tillage, crop residue and N fertilizer effects on crop yield, nutrient uptake, soil quality and greenhouse gas emissions in the second 4-yr rotation cycle. Soil and Tillage Research, 96, 269-283. doi:10.1016/j.still.2007.06.011 [18] Malhi, S.S., Nyborg, M., Goddard, T. and Puurveen, D. (2011) Long-term tillage, straw management and N fer- tilization effects on quantity and quality of organic C and N in a Black Chernozem soil. Nutrient Cycling in Agro- ecosystems, 90, 227-241. doi:10.1007/s10705-011-9424-6 [19] Malhi, S.S., Nyborg, M., Solberg, E.D., McConkey, B., Dyck, M. and Puurveen, D. (2011) Long-term straw management and N fertilizer rate effects on quantity and quality of organic C and N, and some chemical properties in two contrasting soils in western Canada. Biology and Fertility of Soils, 47, 785-800. doi:10.1007/s00374-011-0587-8 [20] Malhi, S.S., Nyborg, M., Goddard, T. and Puurveen, D. (2010) Long-term tillage, straw and N rate effects on quantity and quality of organic C and N in a Gray Luvisol soil. Nutrient Cycling in Agroecosystems, 90, 1-20. [21] Lorenz, R.J. (1977) Changes in root weight and distribu- tion in response to fertilization and harvest treatment of mixed prairie. In: Marshall, J.K., Ed., The Belowground Ecosystem, Range Science Department, Science Series, Colorado State University, Fort Collins, 63-71. [22] Malhi, S.S. and Gill, K.S. (2002) Fertilizer N and P ef- fects on root mass of bromegrass, alfalfa and barley. Jour- nal of Sustainable Agriculture, 19, 51-63. doi:10.1300/J064v19n03_06 [23] Bremer, E., Janzen, H.H. and Johnston, A.M. (1994) Sen- sitivity of total, light fraction and mineralizable organic matter to management practices in a Lethbridge soil. Ca- nadian Journal of Soil Science, 74, 131-138. doi:10.4141/cjss94-020 [24] Campbell, C.A., Janzen, H.H. and Juma, N.G. (1997) Case studies of soil quality in the Canadian Prairies: Long-term field experiments. In: Gregorih, E.G. and Carter, M.R., Eds., Soil Quality for Crop Production and Ecosystem Health, Chapter 17, Elsevier, New York, 351- 397. doi:10.1016/S0166-2481(97)80044-X [25] Hoyt, P.B. and Hennig, A.M. (1982) Soil acidification by fertilizers and longevity of lime applications in the Peace River region. Canadian Journal of Soil Science, 62, 155- 163. doi:10.4141/cjss82-017 [26] Campbell, C.A. and Zentner, R.P. (1984) Effect of fertile- izer on soil pH after seventeen years of continuous crop- ping in southwestern Saskatchewan. Canadian Journal of Soil Science, 64, 750-710. doi:10.4141/cjss84-070 [27] Schwab, A.P., Owensby, C.E. and Kulyingyoung, S.  S. S. Malhi et al. / Agricultural Sciences 3 (2012) 678-696 Copyright © 2012 SciRes. OPEN ACCESS 696 (1990) Changes in soil chemical properties due to 40 years of fertilization. Soil Science, 149, 35-43. doi:10.1097/00010694-199001000-00004 [28] Yuan, X., Tong, Y., Yang, X., Li, X. and Zhang, F. (2000) Effect of organic manure on soil nitrate accumulation. Soil Environmental Scien c e, 9, 197-200. [29] Yang, S., Li, F., Malhi, S.S., Wang, P., Suo, D. and Wang, J. (2004) Long-term fertilization effects on crop yield and nitrate-N accumulation in soil in northwest China. Agro- nomy Journal, 96, 1039-1049. doi:10.2134/agronj2004.1039 [30] Yang, S., Malhi, S.S., Song, J.R., Yue, W.Y., Wang, J.G. and Guo, T.W. (2006) Crop yield, N uptake and nitrate-N accumulation in soil as affected by 23 annual applications of fertilizers and manure on in the rainfd region of northwestern China. Nutrient Cycling in Agroecosystems, 76, 81-94. doi:10.1007/s10705-006-9042-x [31] Mooleki, S.P., Malhi, S.S., Lemke, R., Schoenau, J.J., Lafond, G., Brandt, S., Hultgreen, G., Wang, H. and May, W.E. (2010) Effect of nitrogen management, and phos- phorus placement on wheat production in Saskatchewan. Canadian Journal of Soil Science, 90, 319-337. [32] Heaney, D.J., Nyborg, M., Solberg, E.D., Malhi, S.S. and Ashworth, J. (1992) Overwinter nitrate loss and denitrifi- cation potential of cultivated soils in Alberta. Soil Biology and Biochemistry, 24, 877-884. doi:10.1016/0038-0717(92)90009-M [33] Nyborg, M., Laidlaw, J.W., Solberg, E.D. and Malhi, S.S. (1997) Denitrification and nitrous oxide emissions from soil during spring thaw in a Malmo loam, Alberta. Cana- dian Journal of Soil Science, 77, 53-160. doi:10.4141/S96-105 [34] Malhi, S.S., Brandt, S.A., Lemke, R., Moulin, A.P. and Zentner, R.P. (2009) Effects of input level and crop diver- sity on soil nitrate-N, extractable P, aggregation, organic C and N, and N and P balance in the Canadian Prairie. Nutrient Cycling in Agroecosystems, 84, 1-22. doi:10.1007/s10705-008-9220-0 [35] Yang, S., Malhi, S.S., Li, F., Suo, D., Jia, Y. and Wang, J. (2007) Long-term effects of manure and fertilization on soil organic matter and quality parameters of a calcareous soil in northwestern China. Journal of Plant Nutrition and Soil Science, 170, 234-243. doi:10.1002/jpln.200622012 [36] Benbi, D.K., Biswas, C.R. and Kalkat, J.S. (1991) Nitrate distribution and accumulation in an Ustochrept soil pro- file in a long-term fertilizer experiment. Fertilizer Re- search, 28, 173-177. doi:10.1007/BF01049747 [37] Guillard, K., Griffin, G.F., Allinson, D.W., Yamartino, W.R., Rafey, M.M. and Pietryzk, S.W. (1995) Nitrogen utilization of selected cropping systems in the US North- east. II. Soil profile nitrate distribution and accumulation. Agronomy Journal, 87, 199-207. doi:10.2134/agronj1995.00021962008700020011x [38] Fan, J., Hao, M.D. and Shao, M.A. (2003) Nitrate accu- mulation in soil profile of dry land farming in Northwest China. Pedosphere, 13, 367-374. [39] Zhang, S.X., Li, X.Y., Li, X.P., Yuan, F.M., Yao, Z.H., Sun, Y.L. and Zhang, F.D. (2004) Crop yield, N uptake and nitrates in a fluvo-aquic soil profile. Pedosphere, 14, 131-136. [40] Zhang, W.L., Tian, Z.X., Zhang, N. and Li, X.O. (1996) Nitrate pollution of groundwater in northern China. Ag- riculture, Ecosystem and Environment, 59, 223-231. doi:10.1016/0167-8809(96)01052-3 [41] Lemke, R.L., Izaurralde, R.C., Malhi, S.S., Arshad, M.A. and Nyborg, M. (1998) Nitrous oxide emissions from ag- ricultural soils of the Boreal and Parkland regions of Al- berta. Soil Science Society of America Journal, 62 , 1096- 1102. doi:10.2136/sssaj1998.03615995006200040034x
|