Paper Menu >>
Journal Menu >>
 Journal of Cosmetics, Dermatological Sciences and Applications, 2012, 2, 184-195 http://dx.doi.org/10.4236/jcdsa.2012.23035 Published Online September 2012 (http://www.SciRP.org/journal/jcdsa) Sensitive Skin in China Miranda A. Farage1*, Christian P. Mandl2, Enzo Berardesca3, Howard I. Maibach4 1The Procter & Gamble Company, Winton Hill Business Center, Cincinnati, USA; 2The Procter & Gamble Company, Schwalbach, Germany; 3San Gallicano Dermatological Institute, Rome, Italy; 4Department of Dermatology University of San Francisco, Medical School, San Francisco, USA. Email: *farage.m@pg.com Received May 10th, 2012; revised June 15th, 2012; accepted June 29th, 2012 ABSTRACT Background: Many consumers in the USA and Europe define themselves as having sensitive skin, a phenomenon whose etiology appears to include both physiological and psychosocial factors. Objectives: Sensitive skin data from the developing world is sparse. This study evaluates the prevalence and characteristics of sensitive skin in China and com- pares data collected to existing data from the western world. Patients/Materials/Methods: A total of 408 Chinese wo- men voluntarily completed a survey on sensitive skin. Results: Some degree of skin sensitivity was claimed by 94 (23%) of respondents; most (90.4%) said their skin was only slightly or moderately sensitive. Facial sensitivity was claimed by 21% of Chinese women, sensitivity of the body surface by 9% and genital sensitivity by only 6%. Small numbers of respondents reported a history of skin allergy (3%) or a familial history of sensitive skin (2%). Many reported making buying decisions based on product claims. Conclusions: Only 23% of Chinese women claimed any degree of sensitive skin, a prevalence substantially lower than that observed in most Western countries. Sensitivity of the genital skin, in particular, was dramatically lower, suggesting at least some cultural component to perceptions of sensitive skin. Keywords: Sensitive Skin; Genital Skin; Irritation; Skin Sensitivity; Stinging; Erythema; Feminine Hygiene; Fabrics; Sensory 1. Introduction Many consumers in industrialized countries today define themselves as having “sensitive skin”, reporting unplea- sant dermatological sensations to common exposures like weather conditions or health and beauty products, the lat- ter despite extensive premarket testing which had seem- ingly confirmed a lack of irritant potential. The condition is typically self-diagnosed, with sensory manifestations which include burning, stinging, and itching with visual manifestations such rashes, erythema, and papules. Many patients, however, report sensory hyperstimulation with- out any measurable cutaneous manifestation. An authoritative definition of sensitive skin is elusive. Numerous testing methodologies have attempted to de- fine the physiological basis for these complaints, include- ing visual inspection, transepidermal water loss (TEWL), hydration of the stratum corneum, erythema, blood flow, and surface pH. Subjective effects are more difficult to study; and no consistent correlation between the degree of perceived sensitivity and any measurable physiologi- cal parameters has been established. The diversity of both the causes of sensitive skin and its manifestations implies a multifactorial syndrome in which numerous components, both intrinsic and extrinsic, may play significant roles. Gender is an obvious contri- butor; women report sensitive skin significantly more of- ten than men [1-6]. Age may also be a factor, as well as skin type, concurrent dermatological diseases, or a his- tory of allergy or atopy. Ethnicity also may influence skin sensitivity, as ethnicity and skin type strongly influ- ence both skin structure and function [7]. The anatomic location in question may also be influ- ential. Skin structure differs at different anatomic sites [7]. Green found differences in sensory responses to cap- saicin between the face and the forearm [8]; Britz and Maibach [9] and Elsner [10] observed that vulvar skin exhibits chemical-specific differences from forearm skin with regards to reactivity to a variety of known chemical irritants. Genital skin, particularly, differs structurally and his- tologically from skin in other anatomical areas and those differences affect skin sensitivity. While no association between sensitive skin and ethnic background was found at the face or body, sensitive skin of the genital region was significantly higher in African Americans than in Caucasians, Asians, or Hispanics [1]. Similarly, while skin on the face and body showed no gender-specific dif- *Corresponding author. Copyright © 2012 SciRes. JCDSA  Sensitive Skin in China 185 ferences in sensitivity, the genital area did: 58.1% of wo- men report skin sensitivity in the genital area as com- pared to 44.2% of men [1]. Older people are more likely to claim sensitivity of genital skin than younger [1]. Geographical differences have also been observed in the prevalence of skin sensitivity. Geographical disparity may stem from natural factors like weather patterns, but some scientists have proposed that the geographic dif- ferences may represent a cultural phenomenon related to media and advertising wherein it has become culturally fashionable to claim sensitive skin. Cultural factors do seem to play a role in the pheno- menon of skin sensitivity. The percentage of people who perceive themselves to have sensitive skin appear to be on the increase, particularly among men [11], probably related to an increase in marketing of sensitive-skin pro- ducts to men which may make it more culturally accept- able for men to claim sensitive skin [12]. The fact that the majority are women in the industrialized world defies the perception as a minority complaint and tends to sup- port at least some psychosocial component. Surveys have been a popular method for collecting epi- demiological data on sensitive skin, a largely self-iden- tified condition, in various populations. Although sur- veys across Europe, Asia, and North and South America have consistently shown that the majority of the popula- tions of industrialized societies (and more women than men) believe themselves to have sensitive skin (Table 1), Table 1. Percentage of overall skin sensitivity across the world. Reported sensitivity (%) Country Year Population Overall sensitivity** Very sensitive Moderately sensitive Slightly sensitive Reference China 2009 F 18 - 65 N = 408 23 2 5 16 Present study Global 2010 F N = 191 84 10 38 36 Asia 2010 M and F 18 - 65 years N = 72 90 NA NA NA Europe 2010 M and F 18-65 years N = 94 88 NA NA NA Latin America 2010 M and F 18 - 65 years N = 78 85 NA NA NA North America, OH 2010 M and F 18-65 years N = 122 78 NA NA NA North America, all other 2010 M and F 18-65 years N = 71 77 NA NA NA Farage, data yet unpublished USA (MS) 2010 F 18 - 68 years N = 57 87.5 NA NA NA Farage, data yet unpublished Europe (total) 2007 M and F ≥15 years N = 4506 74.7 13 25.1 36.6 [3] Greece 2007 M and F ≥15 years N = 500 70 8.6 22.4* 29* [3] Germany 2007 M and F ≥15 years N = 500 59 15.8* 20* 23.2 [3] Belgium 2007 M and F ≥ 15 years N = 500 60 10* 16* 4 * [3] Switzerland 2007 M and F ≥15 years N = 500 59 13* 18* 28* [3] Spain 2007 M and F ≥15 years N = 500 88 13* 20* 55* [3] Copyright © 2012 SciRes. JCDSA 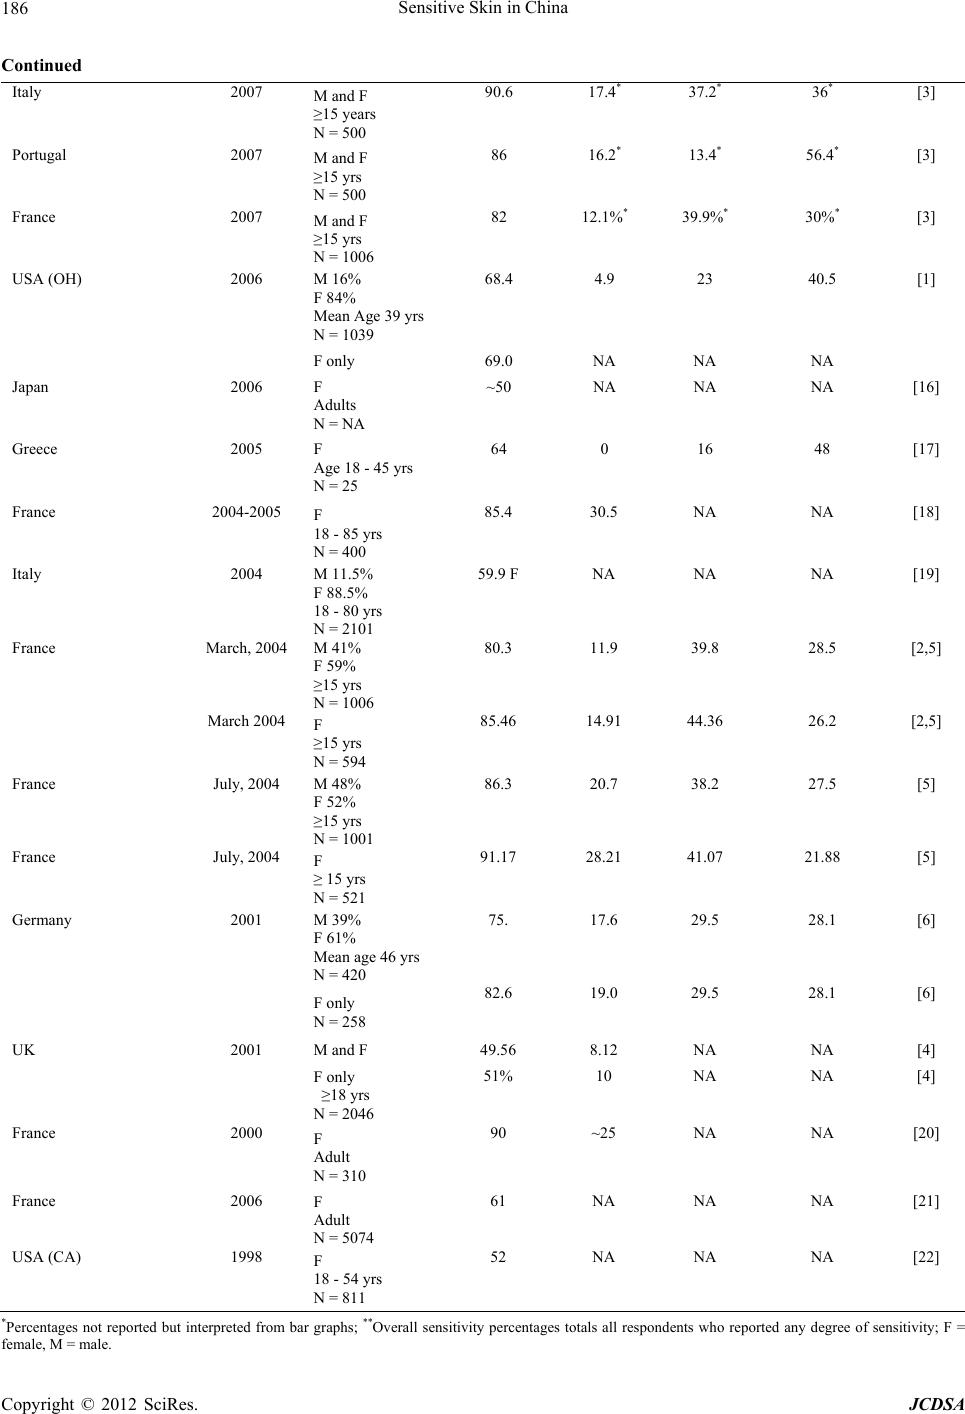 Sensitive Skin in China 186 Continued Italy 2007 M and F ≥15 years N = 500 90.6 17.4* 37.2* 36* [3] Portugal 2007 M and F ≥15 yrs N = 500 86 16.2* 13.4* 56.4* [3] France 2007 M and F ≥15 yrs N = 1006 82 12.1%* 39.9%* 30%* [3] USA (OH) 2006 M 16% F 84% Mean Age 39 yrs N = 1039 68.4 4.9 23 40.5 [1] F only 69.0 NA NA NA Japan 2006 F Adults N = NA ~50 NA NA NA [16] Greece 2005 F Age 18 - 45 yrs N = 25 64 0 16 48 [17] France 2004-2005 F 18 - 85 yrs N = 400 85.4 30.5 NA NA [18] Italy 2004 M 11.5% F 88.5% 18 - 80 yrs N = 2101 59.9 F NA NA NA [19] France March, 2004 M 41% F 59% ≥15 yrs N = 1006 80.3 11.9 39.8 28.5 [2,5] March 2004 F ≥15 yrs N = 594 85.46 14.91 44.36 26.2 [2,5] France July, 2004 M 48% F 52% ≥15 yrs N = 1001 86.3 20.7 38.2 27.5 [5] France July, 2004 F ≥ 15 yrs N = 521 91.17 28.21 41.07 21.88 [5] Germany 2001 M 39% F 61% Mean age 46 yrs N = 420 75. 17.6 29.5 28.1 [6] F only N = 258 82.6 19.0 29.5 28.1 [6] UK 2001 M and F 49.56 8.12 NA NA [4] F only ≥18 yrs N = 2046 51% 10 NA NA [4] France 2000 F Adult N = 310 90 ~25 NA NA [20] France 2006 F Adult N = 5074 61 NA NA NA [21] USA (CA) 1998 F 18 - 54 yrs N = 811 52 NA NA NA [22] *Percentages not reported but interpreted from bar graphs; **Overall sensitivity percentages totals all respondents who reported any degree of sensitivity; F = female, M = male. Copyright © 2012 SciRes. JCDSA  Sensitive Skin in China Copyright © 2012 SciRes. JCDSA 187 no data has previously been collected with regard to the experience of sensitive skin in the rapidly developing nation of China. 2. Methods The Chinese data presented here were obtained in the context of a study that evaluated the needs of sensitive- skin consumers in China. The survey assessed multiple parameters of perception of sensitive skin in Chinese women. Subjects were aged 18 - 65. Of subjects who completed surveys, 84.3% were between 25 and 54 years of age, 9.1% were 24 or younger, and 6.6% were 55 and older. Specific questions addressed the relationship of skin sensitivity to intrinsic factors like age and anatomic site as well as to environmental exposures, product use, and product buying decisions. 3. Results 3.1. Overall Skin Sensitivity A total of 408 surveys were collected. Of those respon- dents, 314 (77%) denied sensitive skin, while 65 respon- dents (16%) claimed they had slightly sensitive skin, 20 respondents (5%) claimed they had moderately sensitive skin, and 9 respondents (2%) claimed they had very sen- sitive skin. Only 3% of respondents stated that they have skin allergies confirmed by a doctor, and only 2% of re- spondents claimed a family member also had sensitive skin. Eleven percent of the respondents claimed not to buy products with specific ingredients because of poten- tial irritation. An additional 128 surveys were collected exclusively from subjects who perceived themselves to have sensi- tive skin, yielding a total of 222 sensitive-skin subjects. There were no directional differences between the three body areas in perceived duration of skin sensitivity. Overall there was a slight correlation between the degree of sensitive skin and its duration, particularly with regard to genital skin. When the duration of skin sensitivity was evaluated only in those who claimed sensitivity, no dif- ference was observed between body areas and just over a third of the respondents claimed to have sensitive skin for less than 6 months. Although not significant, severity of sensitive skin tended to decrease over time in all three body areas evaluated. Only skin sensitivity in the facial area increased. The majority of the 408 respondents from the general population, 79%, stated that their menstrual cycle was regular, 3% stated their cycle was not regular and they were not close to menopause, 2% stated their cycle was not regular but that they were close to menopause, 2% stated they were experiencing menopausal symptoms, 14% stated they no longer have menstrual cycles, and none of the respondents stated they were pregnant. None of the respondents were taking hormone replacement the- rapy (HRT), while 97.9% stated they were not experi- encing menopausal symptoms and the remaining 2.1% stated they had symptoms but were not on HRT. 3.1.1. Facial Skin Of the 408 respondents 324 (79%) claimed to be not sen- sitive in the facial area, while 50 respondents (12%) claimed to be slightly sensitive, 22 respondents (5%) claimed to be moderately sensitive, and 12 respondents (3%) claimed to be very sensitive. Respondents were asked “Why you think you have sensitive facial skin?” The most common answer among those that claimed to have sensitive skin was due to topi- cal products causing visual side effects (35.1%). Another 29.3% stated it was due to sensory side effects by topical products, 29.8% stated it was due to the weather, 2.0% stated rough fabrics to be the cause and 3.9% stated other reasons. Of the respondents who claimed to have sensitive skin, 39.5% said they have had sensitive skin for less than 6 months, 7.3% said 6 to 11 months, 27.8% said 1 to 5 years, 7.3% said 6 to 10 years, and 18% said 10 years or more. Respondents were also asked if their sensitive skin has changed over time and 43.4% stated they were either much less or a little less sensitive now, 46.8% stated there was no change and 9.8% stated they were either much more or a little more sensitive now. Answers were scored as +2 for much more sensitive over time, +1 for a little more, 0 for no change, –1 for a little less sensitive over time, and –2 for much less sensitive. The average change in severity of sensitive facial skin was –0.49 (±0.90), a value that indicates slight improvement of over- all facial skin sensitivity over time. 3.1.2. Body Of the 408 respondents, 370 (91%) denied sensitivity of the body area, while 26 respondents (6.0%) claimed to be slightly sensitive, 9 respondents (2%) claimed to be mo- derately sensitive, and 3 respondents (1%) claimed to be very sensitive. When sensitive skin respondents were asked why they have sensitive skin of the body, the most common an- swer was weather (44.3%). Another 21.6% claimed to be due to rough fabrics, 9.1% was due to visual effects, 19.3% due to sensory effects, and 5.7% by other causes. Of the respondents claiming sensitive skin of the body, 34.1% stated they have had it for less than 6 months, 6.8% stated 6 to 11 months, 27.3% stated 1 to 5 years, 6.8% stated 6 to 10 years, and 25% stated 10 years or more. Twenty-five percent of respondents stated their skin of the body was either much less or little less sensi- tive now, 61.4% stated there was no change, and 13.6%  Sensitive Skin in China 188 stated it was either much more or little more sensitive now. The average change in severity of sensitive skin of the body was –0.22 (±0.81), a value that indicates a slight decrease in skin sensitivity on the body, although not as much of a decrease as was observed with regards to fa- cial skin. 3.1.3. Genital Area Of the 408 respondents, 383 (94%) denied sensitivity in the genital area, while 18 respondents (4%) claimed to be slightly sensitive, 4 respondents (1%) claimed to be mo- derately sensitive, and 3 respondents (1%) claimed to be very sensitive. Among those who claimed sensitivity of genital skin, the most common cause was reported to be rough fabrics (42.5%). Weather was blamed by 22.5%, 12.5% claimed topical products were to blame (causing visual effects), and 20% named topical products (causing sensory ef- fects). Some 2.5% claimed other causes. Of the respondents who claimed to have sensitive ge- nital skin, 37.5% stated they have had it for less than 6 months, 15% stated 7 to 11 months, 22.5% stated 1 to 5 years, 5% stated 6 to 10 years, and 20% stated 10 years or more. When asked about change in skin sensitivity, 47.5% of respondents said their skin is much less or a little less sensitive now, 47.5% stated no change, and 5% reported that their skin was much more or a little more sensitive now. The average change in severity of sensi- tive genital skin was –0.68 (±0.92), indicating improve- ment of skin sensitivity in the genital area that exceeds that of both the facial skin and the body. 3.2. Age Distribution Individuals between the ages of 18 - 65 were chosen and the average age of respondents in each perceived sensi- tivity degree were similar average ages. Respondents who claimed to not have sensitive skin in general were an average age of 39 years old, those who claimed to be slightly sensitive were 38 years old, those who claimed moderate sensitivity were 40 years old, and those who claimed to be very sensitive were 38 years old. The dis- tribution of sensitive skin with respect to age was similar between all age groups and no difference was observed between any age group with the perceived degree of sen- sitive skin at any body site. Women in the 55 - 65 age group had the highest percentage of respondents who claimed they did not have sensitive skin in all three body areas. 3.3. Factors Attributed to Skin Irritation 3.3.1. Environmental Factors The sun and hot weather caused skin irritation (34.5%, 31.2% respectively) and breakouts (21.6%, 22.6% re- spectively) more often any other weather condition. Fab- rics were the least likely cause of irritation with only 11.6% of the population claiming it. Most other envi- ronmental factors caused irritation in 15% to 20% of the population. Only 16.6% of women claimed their men- strual cycle ever caused them to have skin irritation. For most the environmental factors, greater than 80% of re- spondents who claimed to have irritation caused by that factor had irritation only sometimes. 3.3.2. Household, Health, and Beauty Products Seven products that were perceived as irritating by less than 5% of the respondents as follows: shampoo/condi- tioner, deodorants, antiperspirants, household cleaners, dishwashing liquid, laundry detergent, and fabric soften- ers. Eight products perceived to cause irritation by greater than 10% of the respondents as follows: hair colorants, facial cosmetics, facial moisturizers, facial astringents, facial cleanser, body moisturizers, sunscreen, and pow- der/talc (Figure 1). All the products used directly on the face were perceived as irritating in greater than 10% of the population. Powder/talc maybe more likely to be perceived to cause irritation than deodorant because in the eastern hemisphere powder is used as a deodorant more than other products. Household products were not frequently perceived as a source of irritation. Laundry detergent was the most likely household product to be perceived as a source of irritation (4.9%); the least likely was dishwashing liquid (1.8%). 3.3.3. Personal-Hygiene Products Respondents were asked whether certain feminine prod- ucts used on the genitalia caused irritation (redness, burning or itching). The products most likely to be per- ceived as a source of irritation were clothing, toilet paper, and feminine wipes. The two products with the most re- spondents claiming perceived irritation, feminine wipes and incontinence pads, however were most often defined as only sometimes causing irritation (Figure 2). Men- strual pads, pantiliners, tampons, deodorants/antiperspi- rants and douching products were used by less than 40% of the respondents. Menstrual pads and pantiliners were the least likely products to be perceived to cause irrita- tion on a regular basis. No respondent perceived men- strual pads or pantiliners to always or frequently be a source of irritation, though respondents did claim that menstrual pads (3.7%) and pantiliners (1.3%) did some- times seem to cause irritation. 4. Discussion The study population was relatively large with 536 re- spondents and composed entirely of adults Chinese wo- men. Although comparison ata cannot be collected for d Copyright © 2012 SciRes. JCDSA  Sensitive Skin in China Copyright © 2012 SciRes. JCDSA 189 Figure 1. Percent of females reporting irritation caused by products. gender or ethnicity, since the questionnaire employed was similar to our previous study conducted in Cincin- nati, Ohio, the results can still be effectively compared to the US data. The majority of the studies conducted globally have shown that greater than 50% of individuals have sensi- tive skin (Table 1), with percentages of women who claim sensitive skin across the globe varying from about 60% to 90%. The present study found that only 23% of Chinese women claim to have sensitive skin, demonstra- bly lower than lower than that found thus far in other countries. When the Chinese data is compared to our prior US data there is a clear difference in the perceived skin sen- sitivity. In the study conducted in Cincinnati, Ohio, in 2009, 68.4% of 1039 people surveyed claimed to have some degree of sensitivity, compared to 23% in China [1]. Facial skin sensitivity also showed different findings:  Sensitive Skin in China 190 21% claimed to have some degree of sensitivity of facial skin in China respectively, compared to 77.3% in our prior study [1] and as much as 85% of women in France (Table 2). A prior study in San Francisco evaluated com- parative skin sensitivity in specific ethnic groups, includ- ing 200 Asians and found that 52% claimed to have sen- sitive facial skin. This finding is closer to the overall rate for Chinese women of 23% than the overall US average obtained in our prior study of 77.3% [1]. However, the San Francisco study found similar prevalence with a 52% prevalence of sensitive skin overall, a difference which could result from the different wording of the questions asking women to define their skin as sensitive. In addi- tion, the San Francisco study was one of the earliest epi- demiological studies performed (2001) and self-reported sensitive skin in industrialized countries has steadily ri- sen (Table 1). The most dramatic differences could be seen in the body and genital areas, where the US population shows that 60.7% and 56.3% have some degree of sensitivity in those areas respectively compared to 9% and 6% respec- tively for the Chinese population [1] (Table 3). Genital skin differs from exposed skin in other body areas, in eing dramatically thinner [13] and to varying degrees b Figure 2. Frequency (%) of irritation (redness, burning, itching) in the genital area following the use of different products (China). Table 2. Percent of women with self-declared sensitive skin at the face. Reported Sensitivity (%) Country Year Population Overall sensitivityVery sensitiveModerately sensitiveSlightly sensitive Reference China 2009 F 18 - 65 yrs N = 408 21.0 3.0 5.0 12.0 Present data USA (Ohio) 2006 F Adults N = 1039 77.3 4.9 23.0 40.5 [1] France 2004-2005 F 18 - 85 yrs N = 400 85.4 30.5 NA NA [18] UK 2001 F ≥18 yrs N = 2036 34.6 NA NA NA [4] USA (California) 1998 F 18 - 54 yrs N = 811 52 NA NA NA [22] F = Female, NA = Data not available. Copyright © 2012 SciRes. JCDSA  Sensitive Skin in China 191 Table 3. Percent of individuals with self-declared sensitive skin at specific anatomic locations. Anatomic Location (%) Country Year Population Face Body Genitals Reference China 2009 F 18 - 65 yrs N = 408 21 9 6 Current study USA 2009 M (16%) F (84%) Mean age 35.1 yrs N = 1039 77.3 60.7 56.3 [1] France 2008 M and F ≥ 15 yrs N = 1011 NA Scalp 47.4 F 40.8 M NA [23] France 2004-2005 F 18 - 85 yrs N = 400 85 58 Hands 36 Scalp 34 Feet 27 Neck 23 Torso 21 Back NA [18] F = Female, M = Male, NA = Data not available. non-keratinized and occluded. These differences may make the genital area in women more permeable than ex- posed keratinized skin [14]. Our finding that skin sensitivity between the US and Chinese population of women to have the most dramatic difference observed is consistent with prior observation that findings related to genital skin tend to differ from those at other body sites. Perception of overall skin sen- sitivity was well correlated to perceptions of sensitivity of face or body skin in a prior study (weighted kappa value for agreement for general and facial skin or body skin 0.51 and 0.57, respectively), while agreement be- tween the perception of sensitive skin overall and that of genital skin sensitivity was not (weighted kappa value 0.28%) [1]. An association between incontinence and genital sensitivity was also observed), between ethnicity (African American) and genital sensitivity, and between gender (higher number of women) and genital sensitivity, while no association were observed between any of these parameters and sensitivity at the face or other non-genital sites [1]. The questionnaire presented to respondents in both US and China was identical. It is therefore likely that the differences observed from the two studies can be attrib- uted to regional or cultural differences, most likely the fact that individuals in China and eastern hemisphere countries are in general much more reserved when talk- ing about their genitalia as compared to the US or Europe. Talking about the genital area may be taboo in China compared to the US and European nations where it can be talked about freely. Also in the US, countless products targeted for sensitive skin has created the perception that sensitive skin is fashionable [1]. 4.1. Age Distribution In our previous study conducted in Cincinnati, we no- ticed a distinct correlation between age and genital sensi- tivity. As respondents age, their skin sensitivity increases. Fifty-three percent of respondents younger than 30 years old claimed to have sensitive genital skin, compared to 55% of respondent between 31 - 39 years old, 58% of respondents between 40 - 49 years old, and 66% of re- spondents older than 50 years old [1]. The Chinese popu- lation may have shown a slight increase in genital skin sensitivity but because the percentage of respondents claiming genital sensitivity was so low that it is not pos- sible to conclude that there is a statistically significant correlation between age and genital sensitivity. The age distribution did not show any differences in degree of sensitive skin, but it may have been difficult to judge the distribution of those that were sensitive for body and genital skin due to the high percentage of re- spondents who claimed to be not sensitive. The data though, for respondents not sensitive of the body and genitals was very similar in all age groups. 4.2. Factors Affecting Skin Sensitivity Subjects with sensitive skin consistently report skin sen- sitivity to a variety of factors, including topical products, weather conditions, exposure to rough fabrics or paper products, stress, and the hormones that regulate the men- strual cycle (Figure 3). Weather is an important trigger for sensitive skin, a finding borne out in numerous stud- ies on different continents (Table 4). Our previous US study had similar findings. Adverse reaction to products accounted 50% of the causes of sen- Copyright © 2012 SciRes. JCDSA  Sensitive Skin in China 192 Figure 3. Sensitive skin triggers (%). Table 4. Percentages of people who report skin sensitivity to specific weather conditions. Weather condition (%) Country Year* Population Sun Heat Cold Dry Wind Humidity Reference China 2009 F 18 - 65 years N = 408 34.5 31.2 19.2 20.5 21.1 14.7 Farage current study USA 2009 F Mean age 35.1 yrs N = 869 78.4 58.7 83.9 72.9 65.0 39.9 [11] Greece 2008 F 18 - 45 yrs N = 25 NA 20.0 33.0 38.0 25.0 16.0 [17] USA 2006 M and F Mean age 39 (M) and 35.1 (F) yrs N = 1032 (163M, 869F) 77.0 55.0 81.0 71.0 65.0 37.0 [12] France 2004-2005 F 18 - 85 yrs N = 400 50.8 27.9 65.6 NA 41.8 NA [18] France March 2004 M and F ≥15 yrs N = 1006 54.6 NA 60.2 41.1 48.9 NA [2] France July 2004 M and F ≥15 yrs N = 1001 47.6 NA 57.8 35.0 42.3 NA [5] Italy 2004 F 18 - 80 yrs N = 1850 NA 49.4 54.4 NA 54.4 NA [19] USA 2002 F 18 - 54 yrs N = 811 68.3 NA 60.2 NA 61.7 NA [22] F = Female, M = Male, NA = Data not available; *Year of publication. Copyright © 2012 SciRes. JCDSA  Sensitive Skin in China 193 sitive skin in the US, while in China it was 51% when the three body sites were combined. Weather conditions ac- counted for 35% in US [12]. In China, when the three body sites were combined, weather accounted for 33%. These figures were adjusted to only include respondents who claimed to have sensitive skin. Interviewees were asked about effects environmental factors on skin sensi- tivity. The results are dramatically different from the US study, as can be expected since individuals in China have a smaller overall perception of sensitive skin. One find- ing that was particularly interesting was that in the US cold and hot weather caused skin irritation in 83.9% and 58.7% of sensitive skin sufferers, respectively, while in China the sensitivities were reversed. In China hot weather caused more irritation than cold weather, 31.2% and 19.2% respectively. Studies in the largely Caucasian popu- lation of France, interestingly, conducted 4 months apart (March and July) similarly found higher percentages of sensitive skin in winter months than in the summer [2]. Skin sensitivity related to topical products confirmed the general findings of lower prevalence of skin sensitiv- ity in China, despite the fact that topical products osten- sibly carry a high risk of causing irritation. Soap in China does not seem to cause much irritation, while in the US, Greece and France they are some of the worst offenders (Figure 1). Allergies and hereditary causes could not be assessed due to the low number positive responses 6% and 4% respectively. 4.3. Duration of Skin Sensitivity Respondents were also asked how long they have had sensitive skin; most answers were less than 6 months, 1 to 5 years, and 10 years or more. In the US survey 42% of the individuals responded that they had it for greater than 10 years, while only 1% claimed to have had the sensitive skin for less than 6 months. After adjusting for the individuals who were not sensitive, we have 62% of respondents in the US with sensitive skin having had it for more than 10 years compared to only 20% for the Chinese population [12]. When comparing the less than 6 months group, we have 1.5% of Americans compared to 38% of Chinese [12]. Also when asked about changes in severity of sensitive skin, the findings between the US and China were dramatically different [12]. The degree of severity of sensitive skin is decreasing in China where the US survey shows that individuals feel that the sever- ity is increasing. Thirty one percent of the responders in the US survey claimed that they are either a little or much more sensitive now [12]. In China 3% stated that they are either a little or much more sensitive facial skin now, 2% for sensitive body skin, and less than 1% for sensitive genital skin. Even though there were many re- spondents who claimed to have sensitive skin for less than 6 months. between 1 and 5 years, or 10 years or more, but there were very few who claimed to have sen- sitive skin between 6 - 11 months or 6 - 10 years. Data for China came by combining data from the three body sites. The meaning of sensitive skin in the East differs from that of the West, which may contribute to the higher prevalence observed in the West as compared to China. In China sensitive skin is considered an acute and transi- tory condition while in the US it is viewed as more of a permanent condition causing chronic irritation. Therefore there may have been respondents in China who claimed not to have sensitive skin who may have had it in the past. The number of individuals who had sensitive skin in the past were not accounted for because we understood the cultural differences in sensitive skin perception only after the completion of the study. Sensitive skin in the past, therefore, was not included in the questionnaire. In gen- eral, since sensitive skin is not as well defined as other disease states, different cultures interpret or understand sensitive skin differently. 5. Conclusions When we compared this study to the one conducted in the US we were surprised to find much lower percent- ages of individuals claiming to have overall sensitive skin, but especially sensitive skin of the body and geni- tals. The percent of respondents who claimed to have sen- sitive skin was 41.4%, while 38% claimed to have sensi- tive facial skin, 16% claimed to have sensitive skin of the body, and only 7% claimed to have sensitive genital skin. Even though the sensitive skin figures were lower than in the US population we still noticed relatively similar results when we looked at what causes and exacerbates sensitive skin. Weather conditions were stated as the most likely cause of sensitive skin (32.7%), then sensory irritation (25.5%), visual irritation (25.5%), and rough fabrics (12.0%). If sensory and visual irritation were combined, the primary cause of sensitive skin would be adverse reactions to products. Of the weather conditions, the sun and hot weather were considered to be the worst offenders. There were a larger percentage of respondents who claimed to have sensitive skin for less than 6 months as compared to approximately half that claiming to have had it for greater than 10 years. Most respondents also claimed that their severity of sensitive skin was also get- ting better over time, especially those that claimed to have slightly sensitive skin. Only two respondents claim- ed to have much more sensitive skin now. As discussed, numerous interpersonal variables can af- fect evaluations of skin sensitivity such as lifestyle pa- Copyright © 2012 SciRes. JCDSA  Sensitive Skin in China 194 rameters including time spent outdoors, forms of indoor climate control, and occupational or leisure activities. In addition, slight variations in the wording of surveys can cause substantial differences in the survey results ob- tained, i.e. asking subjects whether they experience red- ness or sensory effects rather than asking if skin is “eas- ily irritated”. One debated factor in skin sensitivity is that the influ- ence that cultural components, including advertising, can play. Manufacturers of skin products, over the time pe- riod that the rise in skin sensitivity in western cultures has risen, have increasingly marketed products targeted for sensitive skin. An increase in perceived skin sensitiv- ity in men, particularly (although one recent study found the perception of sensitive skin in men and women to be virtually equal) [1]. A recent epidemiological study in Europe would seem to confirm a cultural component. A comparison of self- reported skin sensitivity in eight European countries found dramatic differences between national populations that are genetically very similar (Portugal, Italy, and Spain, for example, reporting 80% to 90% of their popu- lation as experiencing at least some sensitivity; while Germany, Belgium, and Switzerland reported just a little more than half), an unexpected finding that the authors attributed primarily to substantially more fashion and beauty-related advertising in specific European countries [3]. The finding that substantially fewer Chinese women (residents of a developing country with putatively less aggressive advertising of products targeted for sensitive skin), claim skin sensitivity than their counterparts in the west would seem to bolster the supposition that sensitive skin has at least some cultural component. However, this study relied solely on consumer claims of skin sensitivity without independent physiological verification; much progress has been made over the last decade in unraveling a genuine physiological basis for skin sensitivity as well [15]. Much work remains to be done in order to achieve a satisfactory understanding of both dermatological and psychosocial aspects of sensi- tive skin in the global context. 6. Acknowledgements The authors would like to thank for Dr. Kenneth W. Miller and Mr. Ron Visscher for the review and input on this manuscript; Mr. Sugar Shukla for his critical work on the technical draft revisions and Ms. Wendy Wippel and Ms. Zeinab Schwen (Strategic Regulatory Consult- ing) for technical writing assistance. REFERENCES [1] M. A. Farage, “How Do Perceptions of Sensitive Skin Differ at Different Anatomical Sites? An Epidemiological Study,” Clinical and Experimental Dermatology, Vol. 38, No. 8, 2009, pp. e521-e530. doi:10.1111/j.1365-2230.2 009. 03487.x [2] L. Misery, E. Myon, N. Martin, S. Consoli, T. Nocera and C. Taieb, “Sensitive Skin: Epidemiological Approach and Impact on Quality of Life in France,” In: E. Berardesca, J. W. Fluhr and H. I. Maibach, Eds., Sensitive Skin Syn- drome, Taylor & Francis, New York, 2006, pp. 181-191. [3] L. Misery, S. Boussetta, T. Nocera, N. Perez-Cullell and C. Taieb, “Sensitive Skin in Europe,” Journal of the Euro- pean Academy of Dermatology and Venereology, Vol. 23, No. 4, 2009, pp. 376-381. doi:10.1111/j.1468-3083.2 008. 03037.x [4] C. M. Willis, S. Shaw, O. De Lacharrière, M. Baverel, L. Reiche, R. Jourdain, P. Bastien and J. D. Wilkinson, “Sen- sitive Skin: An Epidemiological Study,” The British Jour- nal of Dermatology, Vol. 145, No. 2, 2001, pp. 258-263. doi:10.1046/j.1365-2133.2 001. 04343.x [5] L. Misery, E. Myon, N. Martin, S. Consoli, S. Boussetta, T. Nocera and C. Taieb, “Sensitive Skin: Psychological Effects and Seasonal Changes,” Journal of the European Academy of Dermatology and Venereology, Vol. 21, No. 5, 2007, pp. 620-628. [6] H. Löffler, “Contact Allergy and Sensitive Skin,” In: E. Berardesca, J. Fluhr and H. Maibach, Eds., Sensitive Skin Syndrome, Taylor and Francis, New York, 2006, pp. 225- 235. [7] M. A. Farage, K. W. Miller, P. Elsner and H. I. Maibach, “Intrinsic and Extrinsic Factors in Skin Ageing: A Re- view,” International Journal of Cosmetic Science, Vol. 30, No. 2, 2008, pp. 87-95. doi:10.1111/j.1468-2494.2 007. 00415.x [8] B. G. Green, “Measurement of Sensory Irritation of the Skin,” American Journal of Contact Dermatitis, Vol. 11, No. 3, 2000, pp. 170-180. doi:10.1053/ajcd.2000.7185 [9] M. B. Britz and H. I. Maibach, “Human Cutaneous Vul- var Reactivity to Irritants,” Contact Dermatitis, Vol. 5, No. 6, 1979, pp. 375-377. doi:10.1111/j.1600-0536.1 979.t b04908.x [10] P. Elsner, D. Wilhelm and H. I. Maibach, “Sodium Lauryl Sulfate-Induced Irritant Contact Dermatitis in Vulvar and Forearm Skin of Premenopausal and Postmenopausal Wo- men,” Journal of the American Academy of Dermatology, Vol. 23, No. 4, 1990, pp. 648-652. [11] M. A. Farage, “Does Sensitive Skin Differ between Men and Women?” Cutaneous and Ocular Toxicology, Vol. 29, No. 3, 2010, pp. 153-163. doi:10.3109/1556952100 377499 0 [12] M. A. Farage, “Perceptions of Sensitive Skin: Changes in Perceived Severity and Associations with Environmental Causes,” Contact Dermatitis, Vol. 59, No. 4, 2008, pp. 226-232. doi:10.1111/j.1600-0536.2008.013 98.x [13] M. A. Farage and H. I. Maibach, “Sensitive Skin: Closing in on a Physiological Cause,” Contact Dermatitis, Vol. 62, No. 3, 2010, pp. 137-149. doi:10.1111/j.1600-0536.2 009. 01697.x [14] M. A. Farage, A. Katsarou and H. I. Maibach, “Sensory, Copyright © 2012 SciRes. JCDSA  Sensitive Skin in China Copyright © 2012 SciRes. JCDSA 195 Clinical and Physiological Factors in Sensitive Skin: A Re- view,” Contact Dermatitis, Vol. 55, No. 1, 2006, pp. 1-14. doi:10.1111/j.0105-1873.2 006. 00886.x [15] E. Berardesca, J. Fluhr and H. Maibach, “Sensitive Skin Syndrome,” Taylor and Francis, New York, 2006. [16] A. Johnson and D. Page, “Making Sense of Sensitive Skin,” Congress of the International Federation of Society of Cosmetic Chemists, Yokohama, 13-16 October 1992. [17] M. A. Farage, P. Bowtell and A. Katsarou, “Self-Diag- nosed Sensitive Skin in Women with Clinically Diagnosed Atopic Dermatitis,” Clinical Medicine: Dermatology, Vol. 2, 2008, pp. 21-28. [18] C. Saint-Martory, A. M. Roguedas-Contios, V. Sibaud, A. Degouy, A. M. Schmitt and L. Misery, “Sensitive Skin Is Not Limited to the Face,” The British Journal of Derma- tology, Vol. 158, No. 1, 2008, pp. 130-133. [19] A. Sparavigna, A. Di Pietro and M. Setaro, “Healthy Skin: Significance and Results of an Italian Study on Healthy Population with Particular Regard to ‘Sensitive’ Skin,” International Journal of Cosmetic Science, Vol. 27, No. 6, 2005, pp. 327-331. doi:10.1111/j.1467-2494.2005 .00287.x [20] F. Morizot, C. Guinot, S. Lopez, I. Le Fur, E. Tschachler and C. Wood, “Sensitive Skin: Analysis of Symptoms, Per- ceived Causes and Possible Mechanisms,” Cosmetics & Toiletries, Vol. 115, 2000, pp. 83-89. [21] C. Guinot, D. Malvy, E. Mauger, K. Ezzedine, J. Latreille, L. Ambroisine, M. Tenenhaus, P. Préziosi, F. Morizot, P. Galan, S. Hercberg and E. Tschachler, “Self-Reported Skin Sensitivity in a General Adult Population in France: Data of the SU.VI.MAX Cohort,” Journal of the European Academy of Dermatology and Venereology, Vol. 20, No. 4, 2006, pp. 380-390. doi:10.1111/j.1468-3083.2 006. 01455.x [22] R. Jourdain, O. de Lacharrière, P. Bastien and H. I. Mai- bach, “Ethnic Variations in Self-Perceived Sensitive Skin: Epidemiological Survey,” Contact Dermatitis, Vol. 46, No. 3, 2002, pp. 162-169. doi:10.1034/j.1600-0536.2 002. 460307.x [23] L. Misery, V. Sibaud, M. Ambronati, G. Macy, S. Bous- setta and C. Taieb, “Sensitive Scalp: Does This Condition Exist? An Epidemiological Study,” Contact Dermatitis, Vol. 58, No. 4, 2008, pp. 234-238. doi:10.1111/j.1600-0536.2 007. 01288.x |