Impact of Coupling and Cohesion in Object-Oriented Technology
672
theory of software metrics. Gandhi and Bhatia [11] have
proposed Message received Coupling (MRC) and Degree
of Coupling (DC) metrics for the automatic detection of a
set of design problems along with an algorithm to apply
these metrics to redesign an object-oriented source code.
Hui et al. [12] also proposed a novel method to realize
dual-redundancy detection for motor rotor and joint posi-
tions by installing two resolvers onto motor shaft at the
same time, which can also have improve position detec-
tion precision and noise immunity by difference principle,
decrease joint size and simplify joint structure.
In the current scenario, many of the software compa-
nies are shifting their old traditional based software sys-
tems towards the object-oriented software systems. There-
fore, it is necessary to study the linking between the
various designed classes or linking with the attributes.
Therefore, the present work is an attempt to find out the
impact of coupling and cohesion on the object-oriented
design. A real case study of the Insurance Policy for the
handicapped person is considered and converted into the
UML class diagram alongwith attributes and thereafter
impact of coupling and cohesion is measured and com-
puted results are recorded in the form of tables.
2. Coupling and Cohesion
The term coupling is used to measure the relative inter-
dependency between various classes as one class has the
link with another class. While on the other hand cohesion
is defined as the strength of the attributes inside the class
which means how the attributes are linked inside the
class. Coupling is always correlated with cohesion in
such a way as if coupling is high then cohesion is low
and vice versa. One can say that a class is highly coupled
or many dependent with other classes, if there are many
connections and loosely coupled or some dependent with
other classes if there is a less connections. The coupling
is decided at the designing phase of the system, it de-
pends on the interface complexity of the classes. There-
fore, the coupling is a degree at which a class is con-
nected with other classes in the system.
Let us now describe the cohesive class which can per-
form a single task within the software procedure. It re-
quires little interaction with other procedures that are
used in other parts of a program. Cohesion gives the
strength to the bond between attributes of a class and it is
a concept through which capture the intra-module with
cohesion. Therefore, cohesion is used to determine how
closely or tightly bound the internal attributes of a class
to one another. Cohesion gives an idea to the designer
about whether the different attributes of a class belong
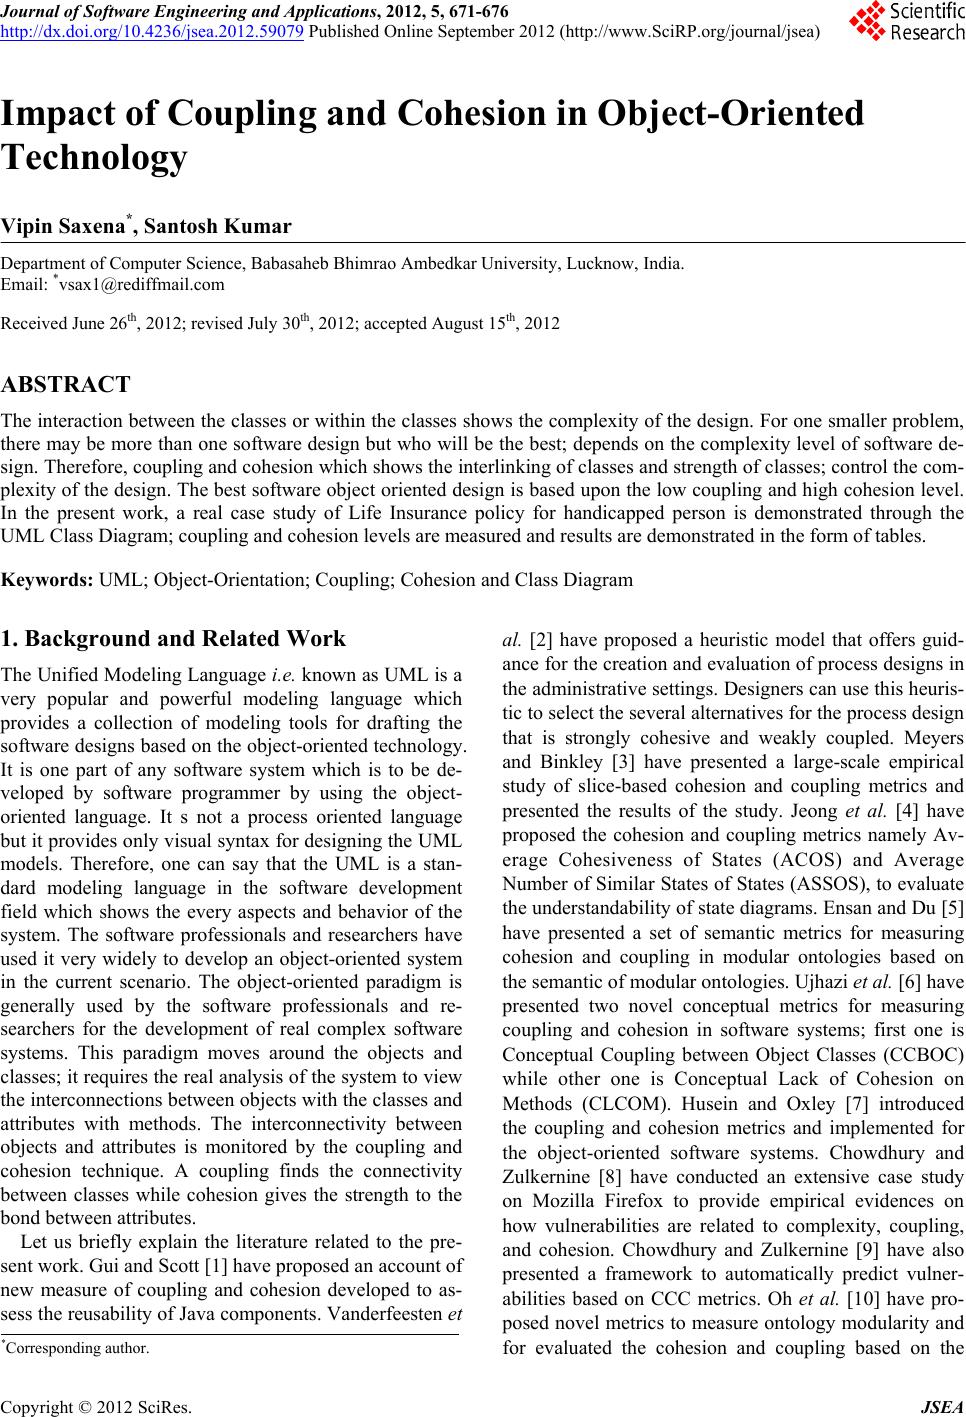
together in the same class. Thus, the coupling and cohe-
sion are related with each other; therefore the Figure 1
shows the general representation of coupling and cohesion.
+Method 1()
+Method 2()
+Method 3()
-Attribute a
-Attribute b
-Attribute c
-Attribute d
-Attribute e
Class C
+Method 1()
+Method 2()
+Method 3()
-Attribute a
-Attribute b
-Attribute c
-Attribute d
-Attribute e
Class B
+Meth od 1()
+meth od 2()
+Meth od 3()
-Attribute a
-Attribute b
-Attribute c
Class A
Coupl ing
Cohesion
Figure 1. General representation of cohesion and coupling.
3. UML Class Diagram
UML class diagram shows the functionality of a system
in a diagrammatic form, in which the classes are de-
signed and combined for designing the software system.
The dependent and independent classes are also designed
in the form of classes and subclasses in the UML class
diagram. In the current work, authors have taken a UML
class diagram of opening the policy for handicapped in
Life Insurance Corporation of INDIA as an example to
demonstrate the approach. The class diagram shows the
complete process of issuing a policy for handicapped.
The independent classes and dependent classes are rep-
resented in the class diagram; the independent classes are
shown along with the solid connecting lines while de-
pendent classes are shown alongwith the dotted arrows as
shown in the Figure 2.
Independent and Dependent Classes
Independent classes (IC’s) are those classes which are
not depending on other classes of the system. So, two
classes are independent if one class can function without
the presence of other class; these classes are easily solv-
able and modifiable separately. However, in any system
all the classes are not independent but there are many
classes which are dependent to other classes. The func-
tionality of dependent classes (DC’s) is affected when
the changes are made in the attributes of the classes on
which the classes are dependent. Thus, the dependent
classes are those classes which use the attributes of other
classes, therefore the DC’s are more dependent to other
classes if it use number of more attributes of other
classes and less dependent if they use less attributes of
other classes. The number of classes can be determined
by the summation of all the IC’s and DC’s of the system.
From the Figure 2, total number of classes (TC’s):
TC = Number of IC’s + Number of DC’s (1)
4. Experimental Study
In the experimental study, the authors have used a metric
[11] DCH (Degree of Cohesion) by exploring the two
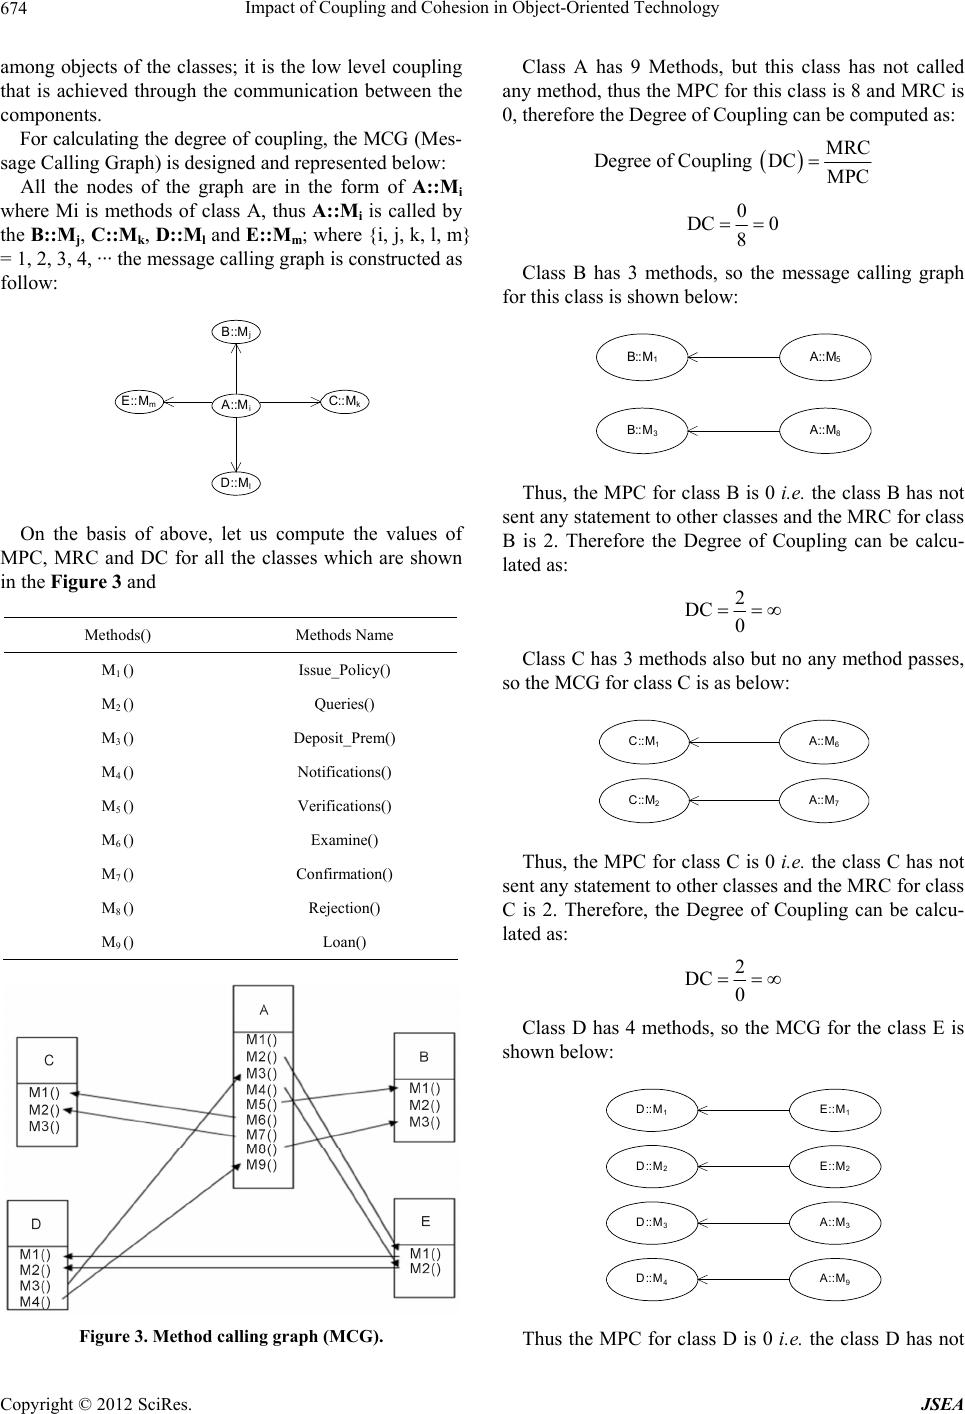
Copyright © 2012 SciRes. JSEA