 Open Journal of Obstetrics and Gynecology, 2012, 2, 255-261 OJOG http://dx.doi.org/10.4236/ojog.2012.23053 Published Online September 2012 (http://www.SciRP.org/journal/ojog/) Trends in cesarean section rates at a large East African referral hospital from 2005-2010 Ayaba Worjoloh1,2,3*, Rachel Manongi4, Olola Oneko5, Cathrine Hoyo2, Anne Kjersti Daltveit6,7, Daniel Westreich2,8 1Hubert-Yeargan Center for Global Health, Duke University, Durham, USA 2Department of Obstetrics and Gynecology, Duke University, Durham, USA 3Fogarty International Clinical Research Fellowship, Duke Global Health Institute, Duke University, Durham, USA 4Department of Community Health, Kilimanjaro Christian Medical Center, Moshi, Tanzania 5Department of Obstetrics and Gynecology, Kilimanjaro Christian Medical Center, Moshi, Tanzania 6Department of Public Health and Primary Health Care, University of Bergen, Bergen, Norway 7Division of Epidemiology, Norwegian Institute of Public Health, Oslo, Norway 8Duke Global Health Institute, Duke University, Durham, USA Email: *Ayaba.worjoloh@gmail.com Received 9 May 2012; revised 13 June 2012; accepted 30 June 2012 ABSTRACT Between 2005 to 2010 in a Tanzanian referral hospi- tal, the cesarean section rate ranged from 29.9% to 35.5%. The leading indication was previous cesar- ean section. Keywords: Cesarean Delivery; Maternal Health; Africa; Birth Registry; Tanzania; Trends 1. INTRODUCTION Emergency obstetric care is crucial to reducing maternal morbidity and mortality from direct causes such as hem- orrhage, infection, hypertensive disorders of pregnancy and obstructed labor and reaching Millennium Develop- ment Goal 5. [1,2] In the developing world, access to cesarean section (CS) is one hallmark of emergency ob- stetric services [3]. The World Health Organization (WHO) and Pan American Health Organization suggest the ideal CS rate for a country is 5% - 15% [2,4,5]. This range represents assumptions about the effective use of CS as an essential intervention, maximizing access to care while minimizing adverse outcomes. Adverse ef- fects of CS compared to vaginal delivery include higher costs of surgery [6], slower recovery for the woman, in- creased risk of adverse events in subsequent pregnancies, and increased complication rates such as infections, in- jury to nearby organs, and increased complication rates such as infections, blood transfusion and death [7], espe- cially given the high prevalence of HIV infection. According to the WHO Global Survey on Maternal and Perinatal Health, which recently collected CS data in 24 countries around the world [8-10], the average fre- quency of CS in Africa is 9% [11]. Previous studies documenting CS rates among African countries cite a range of 0.6% - 18.0% [3,4,12]. The leading indications for CS in Sub-Saharan Africa (SSA) is labor dystocia followed by previous CS [4,11]. Looking closely at fa- cilities, those with higher CS rates also have higher ma- ternal and neonatal morbidity and mortality. Therefore, examination of individual facilities driving the average as evidenced by a privately owned facility in Kenya with a 35% CS rate and a public-owned facility in Angola with a 1.1% CS rate [11]. It remains unknown whether these higher facility rates represent overuse of CS as an intervention, or whether they reflect systematic differ- ences in populations (e.g., higher HIV prevalence) such that higher rates of CS are appropriate. There are almost no studies of time-trends in CS rates conducted in and published from SSA since 2005. Ex- amination of local trends in CS is needed to assess the data gaps and explore ways for improvements because of suboptimal representation of how CS rates can be much higher at select hospitals. To our knowledge this is the third study in the past decade performed in SSA to ex- amine hospital-specific trends in frequency of CS [13,14]. Our study adds to this literature by evaluating the trend in CS rates and indications from 2005-2010 at a referral institution for a large region of Tanzania. 2. MATERIALS AND METHODS 2.1. Study Area The Kilimanjaro Christian Medical Center (KCMC) is a large, University-referral hospital in northern Tanzania. The hospital is located in the Kilimanjaro region, and is *Corresponding author. OPEN ACCESS 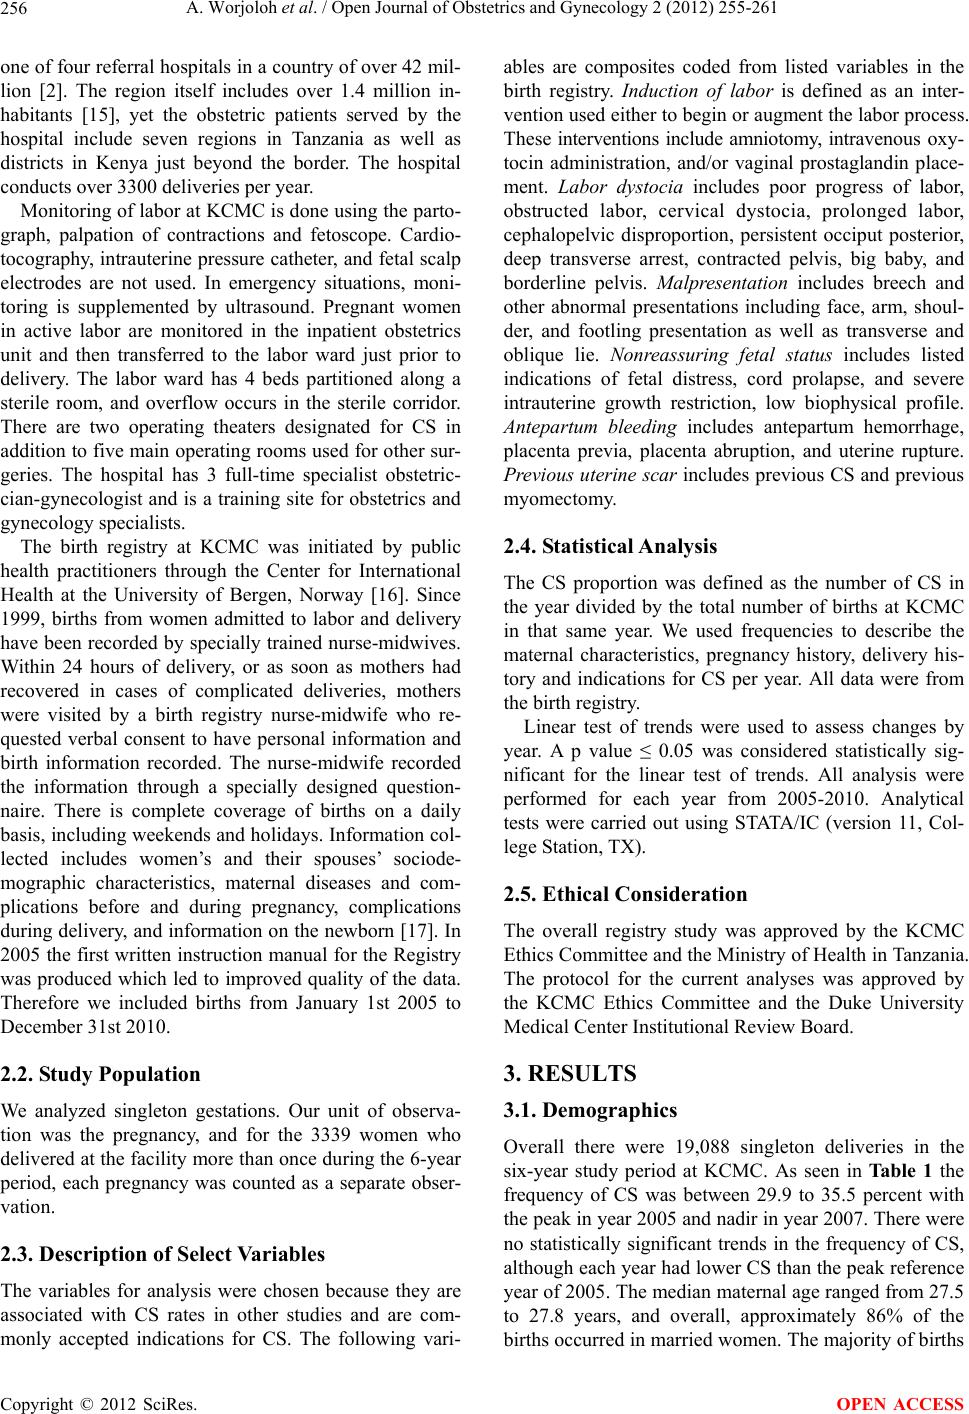 A. Worjoloh et al. / Open Journal of Obstetrics and Gynecology 2 (2012) 255-261 256 one of four referral hospitals in a country of over 42 mil- lion [2]. The region itself includes over 1.4 million in- habitants [15], yet the obstetric patients served by the hospital include seven regions in Tanzania as well as districts in Kenya just beyond the border. The hospital conducts over 3300 deliveries per year. Monitoring of labor at KCMC is done using the parto- graph, palpation of contractions and fetoscope. Cardio- tocography, intrauterine pressure catheter, and fetal scalp electrodes are not used. In emergency situations, moni- toring is supplemented by ultrasound. Pregnant women in active labor are monitored in the inpatient obstetrics unit and then transferred to the labor ward just prior to delivery. The labor ward has 4 beds partitioned along a sterile room, and overflow occurs in the sterile corridor. There are two operating theaters designated for CS in addition to five main operating rooms used for other sur- geries. The hospital has 3 full-time specialist obstetric- cian-gynecologist and is a training site for obstetrics and gynecology specialists. The birth registry at KCMC was initiated by public health practitioners through the Center for International Health at the University of Bergen, Norway [16]. Since 1999, births from women admitted to labor and delivery have been recorded by specially trained nurse-midwives. Within 24 hours of delivery, or as soon as mothers had recovered in cases of complicated deliveries, mothers were visited by a birth registry nurse-midwife who re- quested verbal consent to have personal information and birth information recorded. The nurse-midwife recorded the information through a specially designed question- naire. There is complete coverage of births on a daily basis, including weekends and holidays. Information col- lected includes women’s and their spouses’ sociode- mographic characteristics, maternal diseases and com- plications before and during pregnancy, complications during delivery, and information on the newborn [17]. In 2005 the first written instruction manual for the Registry was produced which led to improved quality of the data. Therefore we included births from January 1st 2005 to December 31st 2010. 2.2. Study Population We analyzed singleton gestations. Our unit of observa- tion was the pregnancy, and for the 3339 women who delivered at the facility more than once during the 6-year period, each pregnancy was counted as a separate obser- vation. 2.3. Description of Select Variables The variables for analysis were chosen because they are associated with CS rates in other studies and are com- monly accepted indications for CS. The following vari- ables are composites coded from listed variables in the birth registry. Induction of labor is defined as an inter- vention used either to begin or augment the labor process. These interventions include amniotomy, intravenous oxy- tocin administration, and/or vaginal prostaglandin place- ment. Labor dystocia includes poor progress of labor, obstructed labor, cervical dystocia, prolonged labor, cephalopelvic disproportion, persistent occiput posterior, deep transverse arrest, contracted pelvis, big baby, and borderline pelvis. Malpresentation includes breech and other abnormal presentations including face, arm, shoul- der, and footling presentation as well as transverse and oblique lie. Nonreassuring fetal status includes listed indications of fetal distress, cord prolapse, and severe intrauterine growth restriction, low biophysical profile. Antepartum bleeding includes antepartum hemorrhage, placenta previa, placenta abruption, and uterine rupture. Previous uterine scar includes previous CS and previous myomectomy. 2.4. Statistical Analysis The CS proportion was defined as the number of CS in the year divided by the total number of births at KCMC in that same year. We used frequencies to describe the maternal characteristics, pregnancy history, delivery his- tory and indications for CS per year. All data were from the birth registry. Linear test of trends were used to assess changes by year. A p value ≤ 0.05 was considered statistically sig- nificant for the linear test of trends. All analysis were performed for each year from 2005-2010. Analytical tests were carried out using STATA/IC (version 11, Col- lege Station, TX). 2.5. Ethical Consideration The overall registry study was approved by the KCMC Ethics Committee and the Ministry of Health in Tanzania. The protocol for the current analyses was approved by the KCMC Ethics Committee and the Duke University Medical Center Institutional Review Board. 3. RESULTS 3.1. Demographics Overall there were 19,088 singleton deliveries in the six-year study period at KCMC. As seen in Tab l e 1 the frequency of CS was between 29.9 to 35.5 percent with the peak in year 2005 and nadir in year 2007. There were no statistically significant trends in the frequency of CS, although each year had lower CS than the peak reference year of 2005. The median maternal age ranged from 27.5 to 27.8 years, and overall, approximately 86% of the births occurred in married wmen. The majority of births o Copyright © 2012 SciRes. OPEN ACCESS 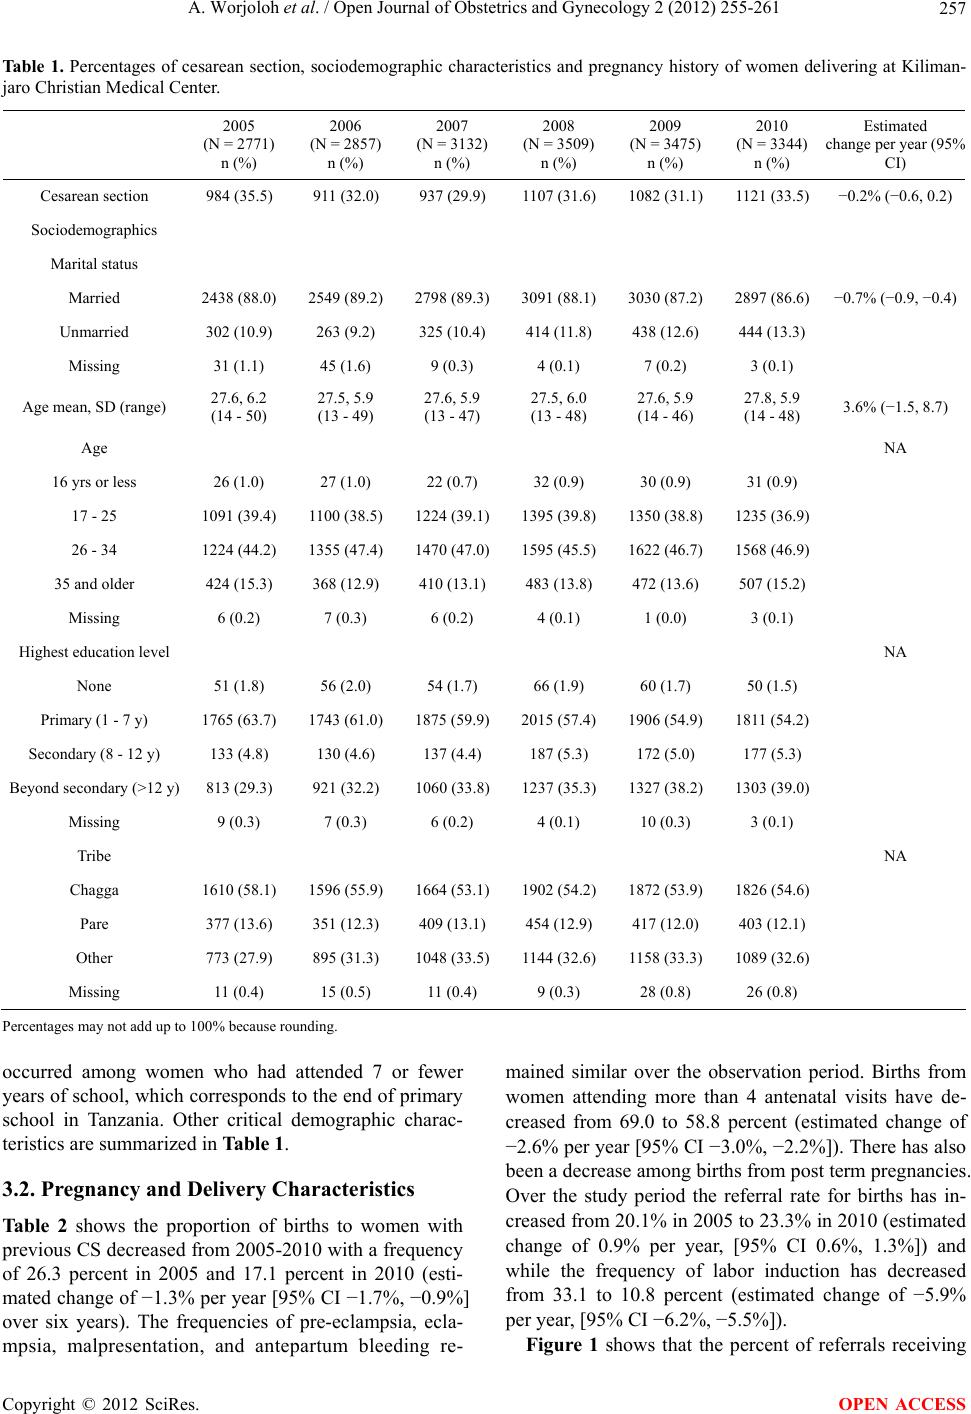 A. Worjoloh et al. / Open Journal of Obstetrics and Gynecology 2 (2012) 255-261 Copyright © 2012 SciRes. 257 OPEN ACCESS Estimated change per year (95% CI) Ta bl e 1. Percentages of cesarean section, sociodemographic characteristics and pregnancy history of women delivering at Kiliman- jaro Christian Medical Center. 2005 (N = 2771) n (%) 2006 (N = 2857) n (%) 2007 (N = 3132) n (%) 2008 (N = 3509) n (%) 2009 (N = 3475) n (%) 2010 (N = 3344) n (%) Cesarean section 984 (35.5) 911 (32.0) 937 (29.9) 1107 (31.6) 1082 (31.1) 1121 (33.5) −0.2% (−0.6, 0.2) Sociodemographics Marital status Married 2438 (88.0) 2549 (89.2) 2798 (89.3) 3091 (88.1) 3030 (87.2) 2897 (86.6) −0.7% (−0.9, −0.4) Unmarried 302 (10.9) 263 (9.2) 325 (10.4) 414 (11.8) 438 (12.6) 444 (13.3) Missing 31 (1.1) 45 (1.6) 9 (0.3) 4 (0.1) 7 (0.2) 3 (0.1) Age mean, SD (range) 27.6, 6.2 (14 - 50) 27.5, 5.9 (13 - 49) 27.6, 5.9 (13 - 47) 27.5, 6.0 (13 - 48) 27.6, 5.9 (14 - 46) 27.8, 5.9 (14 - 48) 3.6% (−1.5, 8.7) Age NA 16 yrs or less 26 (1.0) 27 (1.0) 22 (0.7) 32 (0.9) 30 (0.9) 31 (0.9) 17 - 25 1091 (39.4) 1100 (38.5) 1224 (39.1) 1395 (39.8) 1350 (38.8) 1235 (36.9) 26 - 34 1224 (44.2) 1355 (47.4) 1470 (47.0) 1595 (45.5) 1622 (46.7) 1568 (46.9) 35 and older 424 (15.3) 368 (12.9) 410 (13.1) 483 (13.8) 472 (13.6) 507 (15.2) Missing 6 (0.2) 7 (0.3) 6 (0.2) 4 (0.1) 1 (0.0) 3 (0.1) Highest education level NA None 51 (1.8) 56 (2.0) 54 (1.7) 66 (1.9) 60 (1.7) 50 (1.5) Primary (1 - 7 y) 1765 (63.7) 1743 (61.0) 1875 (59.9) 2015 (57.4) 1906 (54.9) 1811 (54.2) Secondary (8 - 12 y) 133 (4.8) 130 (4.6) 137 (4.4) 187 (5.3) 172 (5.0) 177 (5.3) Beyond secondary (>12 y) 813 (29.3) 921 (32.2) 1060 (33.8) 1237 (35.3) 1327 (38.2) 1303 (39.0) Missing 9 (0.3) 7 (0.3) 6 (0.2) 4 (0.1) 10 (0.3) 3 (0.1) Tribe NA Chagga 1610 (58.1) 1596 (55.9) 1664 (53.1) 1902 (54.2) 1872 (53.9) 1826 (54.6) Pare 377 (13.6) 351 (12.3) 409 (13.1) 454 (12.9) 417 (12.0) 403 (12.1) Other 773 (27.9) 895 (31.3) 1048 (33.5) 1144 (32.6) 1158 (33.3) 1089 (32.6) Missing 11 (0.4) 15 (0.5) 11 (0.4) 9 (0.3) 28 (0.8) 26 (0.8) Percentages may not add up to 100% because rounding. occurred among women who had attended 7 or fewer years of school, which corresponds to the end of primary school in Tanzania. Other critical demographic charac- teristics are summarized in Table 1. 3.2. Pregnancy and Delivery Characteristics Table 2 shows the proportion of births to women with previous CS decreased from 2005-2010 with a frequency of 26.3 percent in 2005 and 17.1 percent in 2010 (esti- mated change of −1.3% per year [95% CI −1.7%, −0.9%] over six years). The frequencies of pre-eclampsia, ecla- mpsia, malpresentation, and antepartum bleeding re- mained similar over the observation period. Births from women attending more than 4 antenatal visits have de- creased from 69.0 to 58.8 percent (estimated change of −2.6% per year [95% CI −3.0%, −2.2%]). There has also been a decrease among births from post term pregnancies. Over the study period the referral rate for births has in- creased from 20.1% in 2005 to 23.3% in 2010 (estimated change of 0.9% per year, [95% CI 0.6%, 1.3%]) and while the frequency of labor induction has decreased from 33.1 to 10.8 percent (estimated change of −5.9% per year, [95% CI −6.2%, −5.5%]). Figure 1 shows that the percent of referrals receiving 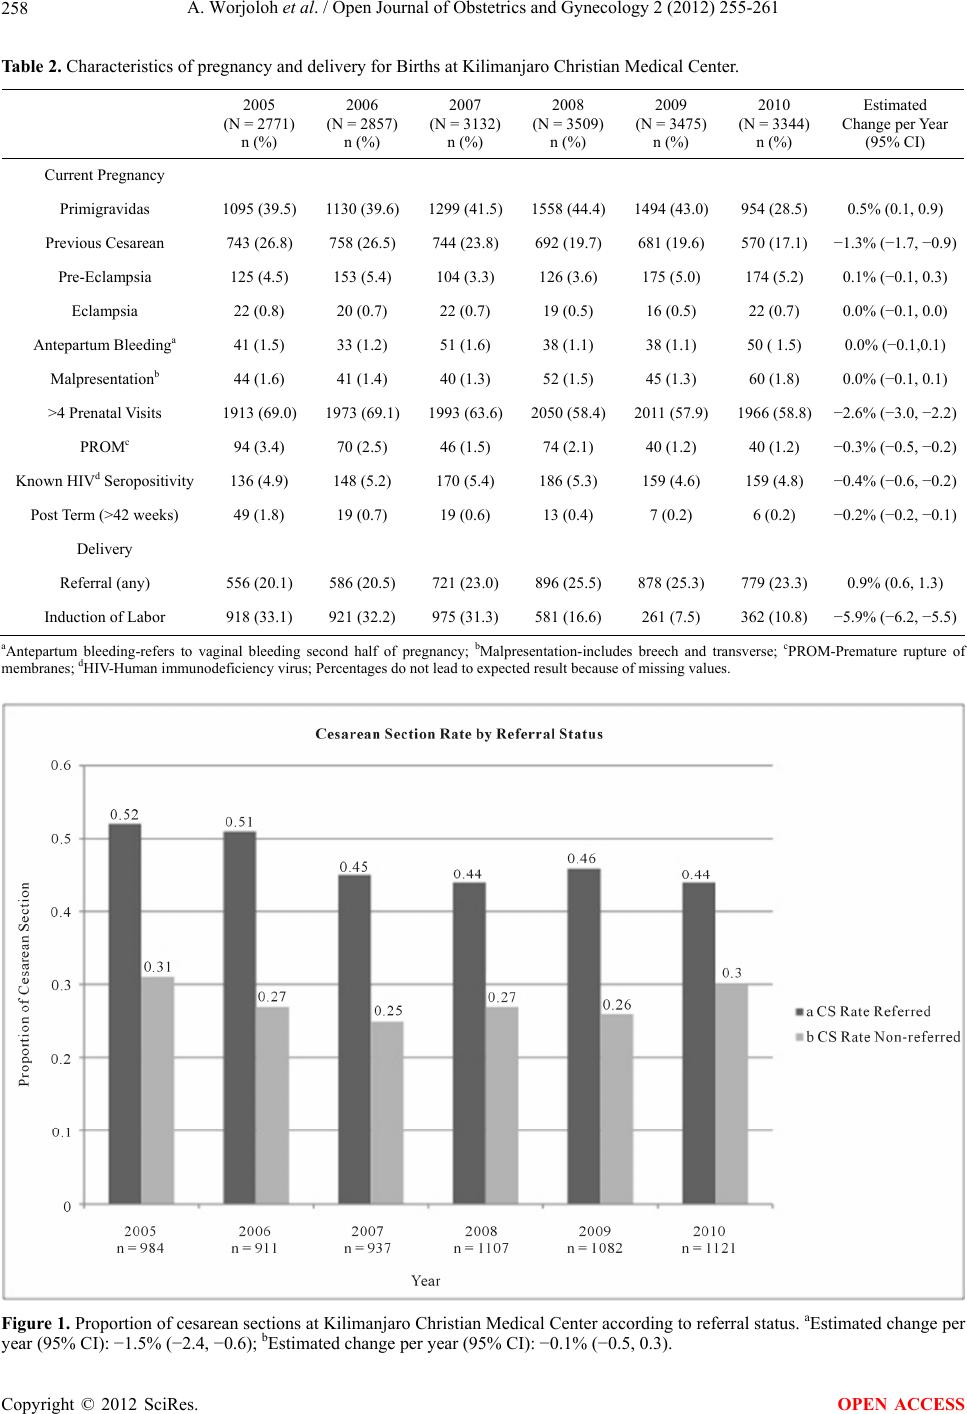 A. Worjoloh et al. / Open Journal of Obstetrics and Gynecology 2 (2012) 255-261 258 Table 2. Characteristics of pregnancy and delivery for Births at Kilimanjaro Christian Medical Center. 2005 (N = 2771) n (%) 2006 (N = 2857) n (%) 2007 (N = 3132) n (%) 2008 (N = 3509) n (%) 2009 (N = 3475) n (%) 2010 (N = 3344) n (%) Estimated Change per Year (95% CI) Current Pregnancy Primigravidas 1095 (39.5) 1130 (39.6)1299 (41.5)1558 (44.4)1494 (43.0)954 (28.5) 0.5% (0.1, 0.9) Previous Cesarean 743 (26.8) 758 (26.5) 744 (23.8) 692 (19.7) 681 (19.6) 570 (17.1) −1.3% (−1.7, −0.9) Pre-Eclampsia 125 (4.5) 153 (5.4) 104 (3.3) 126 (3.6) 175 (5.0) 174 (5.2) 0.1% (−0.1, 0.3) Eclampsia 22 (0.8) 20 (0.7) 22 (0.7) 19 (0.5) 16 (0.5) 22 (0.7) 0.0% (−0.1, 0.0) Antepartum Bleedinga 41 (1.5) 33 (1.2) 51 (1.6) 38 (1.1) 38 (1.1) 50 ( 1.5) 0.0% (−0.1,0.1) Malpresentationb 44 (1.6) 41 (1.4) 40 (1.3) 52 (1.5) 45 (1.3) 60 (1.8) 0.0% (−0.1, 0.1) >4 Prenatal Visits 1913 (69.0) 1973 (69.1)1993 (63.6)2050 (58.4)2011 (57.9)1966 (58.8) −2.6% (−3.0, −2.2) PROMc 94 (3.4) 70 (2.5) 46 (1.5) 74 (2.1) 40 (1.2) 40 (1.2) −0.3% (−0.5, −0.2) Known HIVd Seropositivity 136 (4.9) 148 (5.2) 170 (5.4) 186 (5.3) 159 (4.6) 159 (4.8) −0.4% (−0.6, −0.2) Post Term (>42 weeks) 49 (1.8) 19 (0.7) 19 (0.6) 13 (0.4) 7 (0.2) 6 (0.2) −0.2% (−0.2, −0.1) Delivery Referral (any) 556 (20.1) 586 (20.5) 721 (23.0) 896 (25.5) 878 (25.3) 779 (23.3) 0.9% (0.6, 1.3) Induction of Labor 918 (33.1) 921 (32.2) 975 (31.3) 581 (16.6) 261 (7.5) 362 (10.8) −5.9% (−6.2, −5.5) aAntepartum bleeding-refers to vaginal bleeding second half of pregnancy; bMalpresentation-includes breech and transverse; cPROM-Premature rupture of membranes; dHIV-Human immunodeficiency virus; Percentages do not lead to expected result because of missing values. Figure 1. Proportion of cesarean sections at Kilimanjaro Christian Medical Center according to referral status. aEstimated change per ear (95% CI): −1.5% (−2.4, −0.6); bEstimated change per year (95% CI): −0.1% (−0.5, 0.3). y Copyright © 2012 SciRes. OPEN ACCESS 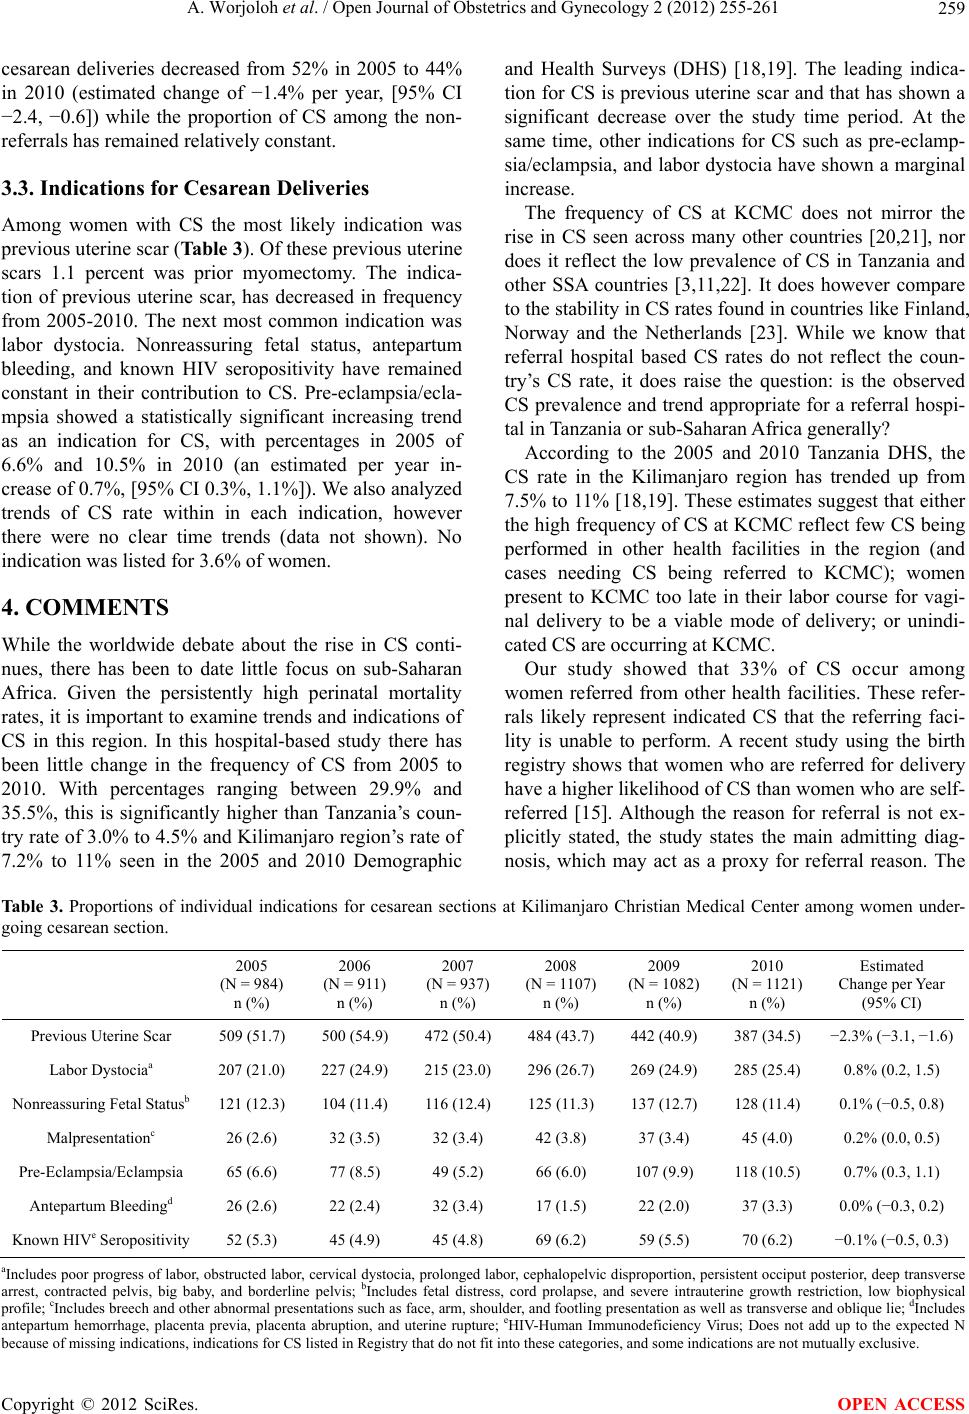 A. Worjoloh et al. / Open Journal of Obstetrics and Gynecology 2 (2012) 255-261 259 cesarean deliveries decreased from 52% in 2005 to 44% in 2010 (estimated change of −1.4% per year, [95% CI −2.4, −0.6]) while the proportion of CS among the non- referrals has remained relatively constant. 3.3. Indications for Cesarean Deliveries Among women with CS the most likely indication was previous uterine scar (Table 3). Of these previous uterine scars 1.1 percent was prior myomectomy. The indica- tion of previous uterine scar, has decreased in frequency from 2005-2010. The next most common indication was labor dystocia. Nonreassuring fetal status, antepartum bleeding, and known HIV seropositivity have remained constant in their contribution to CS. Pre-eclampsia/ecla- mpsia showed a statistically significant increasing trend as an indication for CS, with percentages in 2005 of 6.6% and 10.5% in 2010 (an estimated per year in- crease of 0.7%, [95% CI 0.3%, 1.1%]). We also analyzed trends of CS rate within in each indication, however there were no clear time trends (data not shown). No indication was listed for 3.6% of women. 4. COMMENTS While the worldwide debate about the rise in CS conti- nues, there has been to date little focus on sub-Saharan Africa. Given the persistently high perinatal mortality rates, it is important to examine trends and indications of CS in this region. In this hospital-based study there has been little change in the frequency of CS from 2005 to 2010. With percentages ranging between 29.9% and 35.5%, this is significantly higher than Tanzania’s coun- try rate of 3.0% to 4.5% and Kilimanjaro region’s rate of 7.2% to 11% seen in the 2005 and 2010 Demographic and Health Surveys (DHS) [18,19]. The leading indica- tion for CS is previous uterine scar and that has shown a significant decrease over the study time period. At the same time, other indications for CS such as pre-eclamp- sia/eclampsia, and labor dystocia have shown a marginal increase. The frequency of CS at KCMC does not mirror the rise in CS seen across many other countries [20,21], nor does it reflect the low prevalence of CS in Tanzania and other SSA countries [3,11,22]. It does however compare to the stability in CS rates found in countries like Finland, Norway and the Netherlands [23]. While we know that referral hospital based CS rates do not reflect the coun- try’s CS rate, it does raise the question: is the observed CS prevalence and trend appropriate for a referral hospi- tal in Tanzania or sub-Saharan Africa generally? According to the 2005 and 2010 Tanzania DHS, the CS rate in the Kilimanjaro region has trended up from 7.5% to 11% [18,19]. These estimates suggest that either the high frequency of CS at KCMC reflect few CS being performed in other health facilities in the region (and cases needing CS being referred to KCMC); women present to KCMC too late in their labor course for vagi- nal delivery to be a viable mode of delivery; or unindi- cated CS are occurring at KCMC. Our study showed that 33% of CS occur among women referred from other health facilities. These refer- rals likely represent indicated CS that the referring faci- lity is unable to perform. A recent study using the birth registry shows that women who are referred for delivery have a higher likelihood of CS than women who are self- referred [15]. Although the reason for referral is not ex- plicitly stated, the study states the main admitting diag- nosis, which may act as a proxy for referral reason. The Ta b le 3 . Proportions of individual indications for cesarean sections at Kilimanjaro Christian Medical Center among women under- going cesarean section. 2005 (N = 984) n (%) 2006 (N = 911) n (%) 2007 (N = 937) n (%) 2008 (N = 1107) n (%) 2009 (N = 1082) n (%) 2010 (N = 1121) n (%) Estimated Change per Year (95% CI) Previous Uterine Scar 509 (51.7) 500 (54.9) 472 (50.4) 484 (43.7) 442 (40.9) 387 (34.5) −2.3% (−3.1, −1.6) Labor Dystociaa 207 (21.0) 227 (24.9) 215 (23.0) 296 (26.7) 269 (24.9) 285 (25.4) 0.8% (0.2, 1.5) Nonreassuring Fetal Statusb 121 (12.3) 104 (11.4) 116 (12.4) 125 (11.3) 137 (12.7) 128 (11.4) 0.1% (−0.5, 0.8) Malpresentationc 26 (2.6) 32 (3.5) 32 (3.4) 42 (3.8) 37 (3.4) 45 (4.0) 0.2% (0.0, 0.5) Pre-Eclampsia/Eclampsia 65 (6.6) 77 (8.5) 49 (5.2) 66 (6.0) 107 (9.9) 118 (10.5) 0.7% (0.3, 1.1) Antepartum Bleedingd 26 (2.6) 22 (2.4) 32 (3.4) 17 (1.5) 22 (2.0) 37 (3.3) 0.0% (−0.3, 0.2) Known HIVe Seropositivity 52 (5.3) 45 (4.9) 45 (4.8) 69 (6.2) 59 (5.5) 70 (6.2) −0.1% (−0.5, 0.3) aIncludes poor progress of labor, obstructed labor, cervical dystocia, prolonged labor, cephalopelvic disproportion, persistent occiput posterior, deep transverse arrest, contracted pelvis, big baby, and borderline pelvis; bIncludes fetal distress, cord prolapse, and severe intrauterine growth restriction, low biophysical profile; cIncludes breech and other abnormal presentations such as face, arm, shoulder, and footling presentation as well as transverse and oblique lie; dIncludes antepartum hemorrhage, placenta previa, placenta abruption, and uterine rupture; eHIV-Human Immunodeficiency Virus; Does not add up to the expected N ecause of missing indications, indications for CS listed in Registry that do not fit into these categories, and some indications are not mutually exclusive. b Copyright © 2012 SciRes. OPEN ACCESS  A. Worjoloh et al. / Open Journal of Obstetrics and Gynecology 2 (2012) 255-261 260 study found that the main admitting diagnosis is previous CS and this corresponds with our study’s finding that the leading indication for CS is previous uterine scar. The next most common indications for CS found in our study are labor dystocia and fetal distress. The reasons for re- ferral deserve further exploration, starting with a focus on facilities that refer to KCMC. Expansion of the birth registry to these centers or implementation of a similar birth surveillance system could help answer this question. It also has potential to supplement our knowledge about the quality of decision making around management of labor and mode of delivery. The quality of labor management is linked to the ex- planation that women present to KCMC too late in their labor course for vaginal delivery to be a viable mode of delivery. An unpublished Master’s Thesis from the Uni- versity of Copenhagen done in the Kagera region of Tanzania revealed 10% of labor dystocia diagnoses did not receive oxytocin or amniotomy for augmentation and 20% of CS were not indicated based on internationally agreed medical indications for CS [24]. It is likely that diagnoses such as labor dystocia are not acted upon ap- propriately in the periphery and therefore when the woman presents to the referral facility the mother or fe- tus is in distress. Therefore a CS must be performed. More audits such as those from Kagera could be used as a metric to assess if a woman receives appropriate inter- vention before she is referred. This could improve labor management and potentially result in decreased CS rate. The question of unindicated CS is difficult to disen- tangle in retrospective data. Worldwide, an increasingly pervasive and often unsafe reason for CS is the unindi- cated CS or CS by maternal request [7]. An unindicated CS in one setting may be indicated in another setting. One can use the example of vaginal birth after CS (VBAC). In this study the leading indication for CS is prior CS. Studies in SSA have shown that VBAC is safe and feasible [25]. In health facilities which allow VBAC, a provider must have the resources for proper monitoring, emergency intervention and knowledge about managing the labor of women with previous CS. It is possible that a proportion of women who should VBAC, may not be given the option. It is beyond the scope of this study to delve deeper into which CS should be considered unin- dicated. There are inherent limitations in any hospital based data collection because those who do not deliver in the hospital are not included in these analyses. The 2010 DHS indicates that almost 12 percent of deliveries in the Kilimanjaro region occur at home. Another limitation of this retrospective analysis using registry data is that the indications for CS are largely subjective. One provider may interpret and diagnose labor dystocia different from another. 5. CONCLUSION Despite these limitations, this registry based study of trends in CS rates in a SSA facility shows that the CS rate is higher than recommended by WHO. The rate has been stable over many years, although it does not ap- proximate the countrywide CS rate. Furthermore, the primary indication for CS is different from most other studies in SSA. Understanding reasons for a high CS rate is a critical next step in assessing the observed rate. A facility-based audit at referral and referring centers would assist in understanding the decision making around labor and mode of delivery by health care providers, women and their families in Africa, a place often overlooked in evaluation of rising CS rates. A reasonable starting point for examination is referral centers because they perform the majority of CS. 6. ACKNOWLEDGEMENTS The Kilimanjaro Christian Medical Center Birth Registry is funded by the Center for International Health at the University of Bergen, Norway. We are grateful to all the postpartum women, providers and nurses who gave their time and talents to make it successful. We declare that we have no conflicts of interest. REFERENCES [1] Cross, S., Bell, J.S. and Graham, W.J. (2010) What you count is what you target: the implications of maternal death classification for tracking progress towards reduc- ing maternal mortality in developing countries. Bulletin of the World Health Organization, 88, 147-153. doi:10.2471/BLT.09.063537 [2] World Health Organization and Unicef (2010) Count- down to 2015 decade report (2000-2010): Taking stock of maternal, newborn and child survival. [3] Wylie, B.J. and Mirza, F.G. (2008) Cesarean delivery in the developing world. Clinics in Perinatology, 35, 571- 582. doi:10.1016/j.clp.2008.06.002 [4] Dumont, A., de Bernis, L., Bouvier-Colle, M.H. and Bre- art, G. (2001) Caesarean section rate for maternal indica- tion in sub-Saharan Africa: A systematic review. Lancet, 358, 1328-1333. doi:10.1016/S0140-6736(01)06414-5 [5] Stanton, C.K. and Holtz, S.A. (2006) Levels and trends in cesarean birth in the developing world. Studies in Family Planning, 37, 41-48. doi:10.1111/j.1728-4465.2006.00082.x [6] Henderson, J., McCandlish, R., Kumiega, L. and Petrou, S. (2001) Systematic review of economic aspects of al- ternative modes of delivery. BJOG: An International Jour- nal of Obstetrics and Gynaecology, 108, 149-157. doi:10.1111/j.1471-0528.2001.00044.x [7] Souza, J.P., Gulmezoglu, A., Lumbiganon, P., Laopaiboon, M., Carroli, G., Fawole, B. and Ruyan, P. (2010) Caesar- ean section without medical indications is associated with Copyright © 2012 SciRes. OPEN ACCESS  A. Worjoloh et al. / Open Journal of Obstetrics and Gynecology 2 (2012) 255-261 261 an increased risk of adverse short-term maternal out- comes: The 2004-2008 WHO Global Survey on Maternal and Perinatal Health. BMC Medicine, 8, 71. doi:10.1186/1741-7015-8-71 [8] Shah, A., Faundes, A., Machoki, M., Bataglia, V., Amok- rane, F., Donner, A., Mugerwa, K., Carroli, G., Fawole, B., Langer, A. et al. (2008) Methodological considerations in implementing the WHO global survey for monitoring maternal and perinatal health. Bulletin of the World Health Organization, 86, 126-131. doi:10.2471/BLT.06.039842 [9] Lumbiganon, P., Laopaiboon, M., Gulmezoglu, A.M., Souza, J.P., Taneepanichskul, S., Ruyan, P., Attygalle, D.E., Shrestha, N., Mori, R., Nguyen, D.H., et al. (2010) Method of delivery and pregnancy outcomes in Asia: The WHO global survey on maternal and perinatal health 2007-2008. Lancet, 375, 490-499. doi:10.1016/S0140-6736(09)61870-5 [10] Villar, J., Valladares, E., Wojdyla, D., Zavaleta, N., Car- roli, G., Velazco, A., Shah, A., Campodonico, L., Bataglia, V., Faundes, A. et al. (2006) Caesarean delivery rates and pregnancy outcomes: The 2005 WHO global survey on maternal and perinatal health in Latin America. Lancet, 367, 1819-1829. doi:10.1016/S0140-6736(06)68704-7 [11] Shah, A., Fawole, B., M’Imunya, J.M., Amokrane, F., Nafiou, I., Wolomby, J.J., Mugerwa, K., Neves, I., Nguti, R., Kublickas, M. et al. (2009) Cesarean delivery out- comes from the WHO global survey on maternal and perinatal health in Africa. International Journal of Gy- naecology & Obstetrics, 107, 191-197. doi:10.1016/j.ijgo.2009.08.013 [12] Stanton, C.K., Dubourg, D., De Brouwere, V., Pujades, M. and Ronsmans, C. (2005) Reliability of data on caesarean sections in developing countries. Bulletin of the World Health Organization, 83, 449-455. [13] Wanyonyi, S., Sequeira, E. and Obura, T. (2006) Caesar- ian section rates and perinatal outcome at the Aga Khan University Hospital, Nairobi. East African Medical Jour- nal, 83, 651-658. [14] Muganyizi, P.S. and Kidanto, H.L. (2009) Impact of change in maternal age composition on the incidence of Caesarean section and low birth weight: Analysis of de- livery records at a tertiary hospital in Tanzania, 1999- 2005. BMC Pregnancy Childbirth, 9, 30. doi:10.1186/1471-2393-9-30 [15] Sorbye, I.K., Vangen, S., Oneko, O., Sundby, J. and Ber- gsjo, P. (2011) Cesarean section among referred and self-referred birhting women: A cohort study from a ter- tiary hospital, northeastern Tanzania. BMC Pregnancy Childbirth, 11 , 55. [16] Bergsjo, P., Mlay, J., Lie, R.T., Lie-Nielsen, E. and Shao, J.F. (2007) A medical birth registry at Kilimanjaro Chris- tian Medical Centre. East African Journal of Public Health, 4, 1-4. [17] Habib, N.A., Dalveit, A.K., Mlay, J., Oneko, O., Shao, J., Bergsjo, P., Lie-Nielsen, E. and Lie, R.T. (2008) Birth- weight and perinatal mortality among singletons and twins in north-eastern Tanzania. Scandinavian Journal of Public Health, 36, 761-768. doi:10.1177/1403494808089559 [18] National Bureau of Statistics and Macro ORC (2005) Tanzania Demographic and Health Survey 2004-2005. Dar es Salaam, 131-161. [19] NBS and ICF Macro (2011) Tanzania Demographic and Health Survey 2010. Dar es Salaam, 127-142. [20] Howell, S., Johnston, T. and Macleod, S.L. (2009) Trends and determinants of caesarean sections births in Queen- sland, 1997-2006. Australian and New Zealand Journal of Obstetrics and Gynaecology, 49, 606-611. doi:10.1111/j.1479-828X.2009.01100.x [21] Stavrou, E.P., Ford, J.B., Shand, A.W., Morris, J.M. and Roberts, C.L. (2011) Epidemiology and trends for Cae- sarean section births in New South Wales, Australia: A population-based study. BMC Pregnancy Childbirth, 11, 8. doi:10.1186/1471-2393-11-8 [22] Althabe, F., Sosa, C., Belizan, J.M., Gibbons, L., Jac- querioz, F. and Bergel, E. (2006) Cesarean section rates and maternal and neonatal mortality in low-, medium-, and high-income countries: An ecological study. Birth, 33, 270-277. doi:10.1111/j.1523-536X.2006.00118.x [23] Declercq, E., Young, R., Cabral, H. and Ecker, J. (2011) Is a rising cesarean delivery rate inevitable? Trends in industrialized countries, 1987 to 2007. Birth, 38, 99-104. doi:10.1111/j.1523-536X.2010.00459.x [24] Maaloe, N. (2010) The quality of hospital management preceding emergency cesarean section. University of Co- penhagen, Copenhagen, 2010. [25] Aisien, A.O. and Oronsaye, A.U. (2004) Vaginal birth after one previous caesarean section in a tertiary institu- tion in Nigeria. Journal of Obstetrics & Gynaecology, 24, 886-890. doi:10.1080/01443610400018742 Copyright © 2012 SciRes. OPEN ACCESS
|