Paper Menu >>
Journal Menu >>
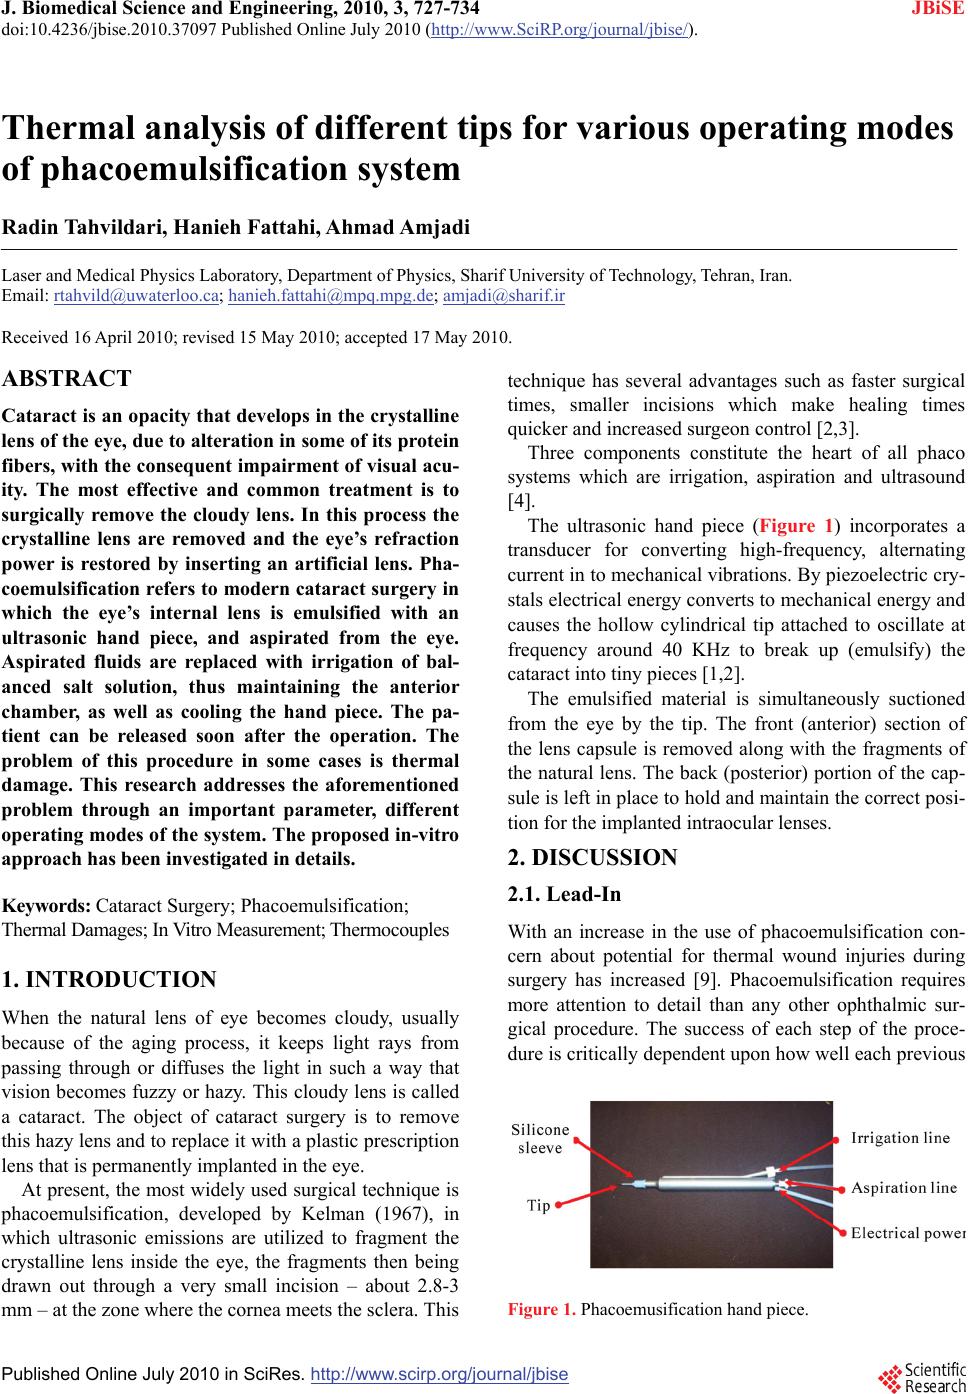 J. Biomedical Science and Engineering, 2010, 3, 727-734 JBiSE doi:10.4236/jbise.2010.37097 Published Online July 2010 (http://www.SciRP.org/journal/jbise/). Published Online July 2010 in SciRes. http://www.scirp.org/journal/jbise Thermal analysis of different tips for various operating modes of phacoemulsification system Radin Tahvildari, Hanieh Fattahi, Ahmad Amjadi Laser and Medical Physics Laboratory, Department of Physics, Sharif University of Technology, Tehran, Iran. Email: rtahvild@uwaterloo.ca; hanieh.fattahi@mpq.mpg.de; amjadi@sharif.ir Received 16 April 2010; revised 15 May 2010; accepted 17 May 2010. ABSTRACT Cataract is an opacity that develops in the crystalline lens of the eye, due to alteration in some of its protein fibers, with the consequent impairment of visual acu- ity. The most effective and common treatment is to surgically remove the cloudy lens. In this process the crystalline lens are removed and the eye’s refraction power is restored by inserting an artificial lens. Pha- coemulsification refers to modern cataract surgery in which the eye’s internal lens is emulsified with an ultrasonic hand piece, and aspirated from the eye. Aspirated fluids are replaced with irrigation of bal- anced salt solution, thus maintaining the anterior chamber, as well as cooling the hand piece. The pa- tient can be released soon after the operation. The problem of this procedure in some cases is thermal damage. This research addresses the aforementioned problem through an important parameter, different operating modes of the system. The proposed in-vitro approach has been investigated in details. Keywords: Cataract Surgery; Phacoemulsification; Thermal Damages; In Vitro Measurement; Thermocouples 1. INTRODUCTION When the natural lens of eye becomes cloudy, usually because of the aging process, it keeps light rays from passing through or diffuses the light in such a way that vision becomes fuzzy or hazy. This cloudy lens is called a cataract. The object of cataract surgery is to remove this hazy lens and to replace it with a plastic prescription lens that is permanently implanted in the eye. At present, the most widely used surgical technique is phacoemulsification, developed by Kelman (1967), in which ultrasonic emissions are utilized to fragment the crystalline lens inside the eye, the fragments then being drawn out through a very small incision – about 2.8-3 mm – at the zone where the cornea meets the sclera. This technique has several advantages such as faster surgical times, smaller incisions which make healing times quicker and increased surgeon control [2,3]. Three components constitute the heart of all phaco systems which are irrigation, aspiration and ultrasound [4]. The ultrasonic hand piece (Figure 1) incorporates a transducer for converting high-frequency, alternating current in to mechanical vibrations. By piezoelectric cry- stals electrical energy converts to mechanical energy and causes the hollow cylindrical tip attached to oscillate at frequency around 40 KHz to break up (emulsify) the cataract into tiny pieces [1,2]. The emulsified material is simultaneously suctioned from the eye by the tip. The front (anterior) section of the lens capsule is removed along with the fragments of the natural lens. The back (posterior) portion of the cap- sule is left in place to hold and maintain the correct posi- tion for the implanted intraocular lenses. 2. DISCUSSION 2.1. Lead-In With an increase in the use of phacoemulsification con- cern about potential for thermal wound injuries during surgery has increased [9]. Phacoemulsification requires more attention to detail than any other ophthalmic sur- gical procedure. The success of each step of the proce- dure is critically dependent upon how well each previous Figure 1. Phacoemusification hand piece. 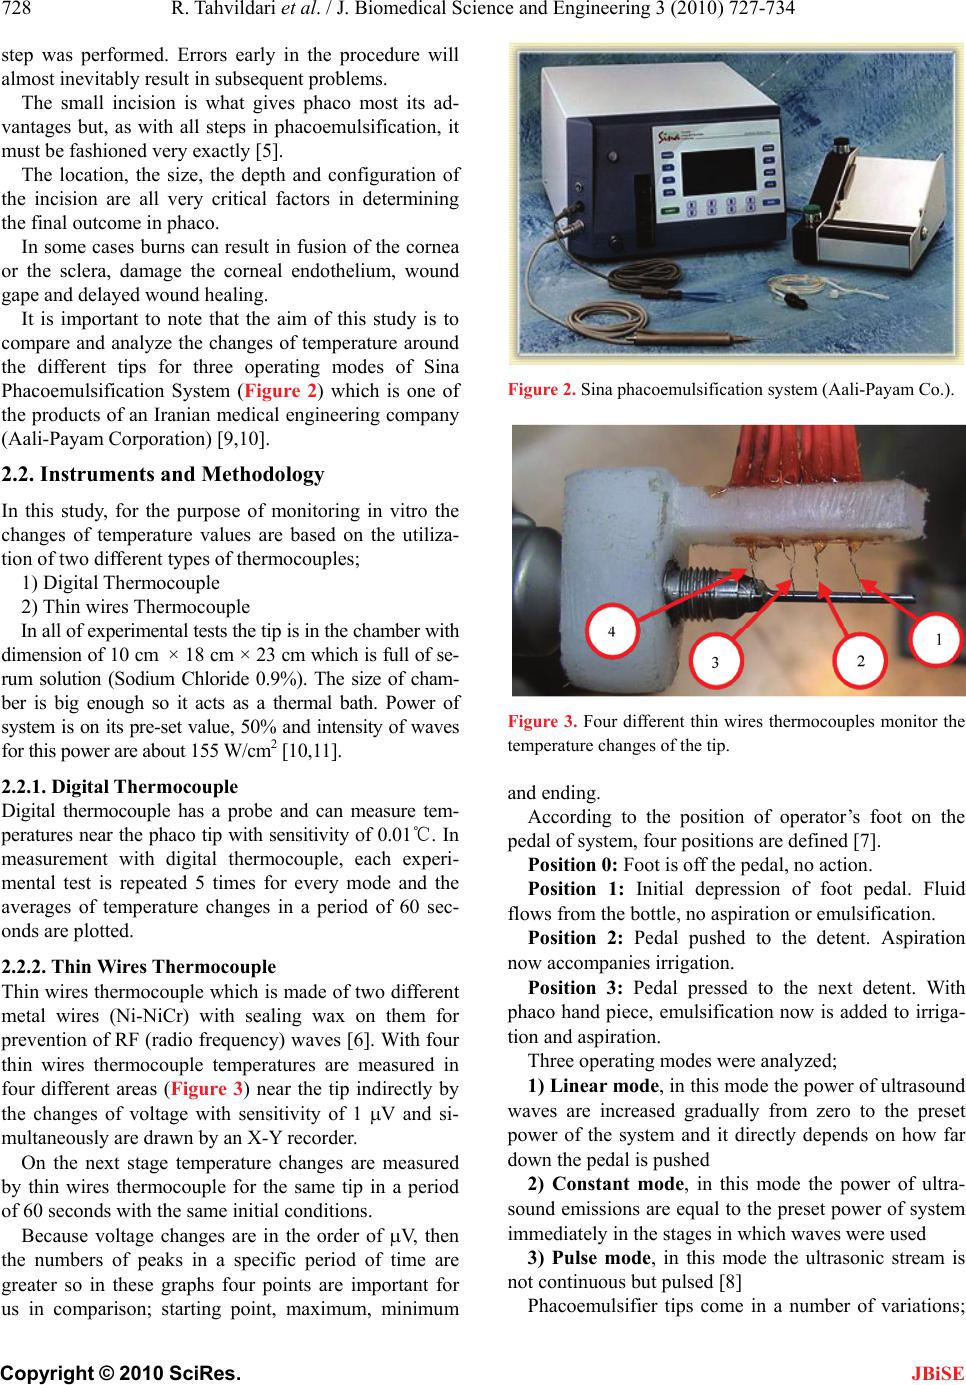 R. Tahvildari et al. / J. Biomedical Science and Engineering 3 (2010) 727-734 Copyright © 2010 SciRes. JBiSE 728 step was performed. Errors early in the procedure will almost inevitably result in subsequent problems. The small incision is what gives phaco most its ad- vantages but, as with all steps in phacoemulsification, it must be fashioned very exactly [5]. The location, the size, the depth and configuration of the incision are all very critical factors in determining the final outcome in phaco. In some cases burns can result in fusion of the cornea or the sclera, damage the corneal endothelium, wound gape and delayed wound healing. It is important to note that the aim of this study is to compare and analyze the changes of temperature around the different tips for three operating modes of Sina Phacoemulsification System (Figure 2) which is one of the products of an Iranian medical engineering company (Aali-Payam Corporation) [9,10]. 2.2. Instruments and Methodology In this study, for the purpose of monitoring in vitro the changes of temperature values are based on the utiliza- tion of two different types of thermocouples; 1) Digital Thermocouple 2) Thin wires Thermocouple In all of experimental tests the tip is in the chamber with dimension of 10 cm × 18 cm × 23 cm which is full of se- rum solution (Sodium Chloride 0.9%). The size of cham- ber is big enough so it acts as a thermal bath. Power of system is on its pre-set value, 50% and intensity of waves for this power are about 155 W/cm2 [10,11]. 2.2.1. Digital Thermocouple Digital thermocouple has a probe and can measure tem- peratures near the phaco tip with sensitivity of 0.01℃. In measurement with digital thermocouple, each experi- mental test is repeated 5 times for every mode and the averages of temperature changes in a period of 60 sec- onds are plotted. 2.2.2. Thin Wires Thermocouple Thin wires thermocouple which is made of two different metal wires (Ni-NiCr) with sealing wax on them for prevention of RF (radio frequency) waves [6]. With four thin wires thermocouple temperatures are measured in four different areas (Figure 3) near the tip indirectly by the changes of voltage with sensitivity of 1 V and si- multaneously are drawn by an X-Y recorder. On the next stage temperature changes are measured by thin wires thermocouple for the same tip in a period of 60 seconds with the same initial conditions. Because voltage changes are in the order of V, then the numbers of peaks in a specific period of time are greater so in these graphs four points are important for us in comparison; starting point, maximum, minimum Figure 2. Sina phacoemulsification system (Aali-Payam Co.). Figure 3. Four different thin wires thermocouples monitor the temperature changes of the tip. and ending. According to the position of operator’s foot on the pedal of system, four positions are defined [7]. Position 0: Foot is off the pedal, no action. Position 1: Initial depression of foot pedal. Fluid flows from the bottle, no aspiration or emulsification. Position 2: Pedal pushed to the detent. Aspiration now accompanies irrigation. Position 3: Pedal pressed to the next detent. With phaco hand piece, emulsification now is added to irriga- tion and aspiration. Three operating modes were analyzed; 1) Linear mode, in this mode the power of ultrasound waves are increased gradually from zero to the preset power of the system and it directly depends on how far down the pedal is pushed 2) Constant mode, in this mode the power of ultra- sound emissions are equal to the preset power of system immediately in the stages in which waves were used 3) Pulse mode, in this mode the ultrasonic stream is not continuous but pulsed [8] Phacoemulsifier tips come in a number of variations; 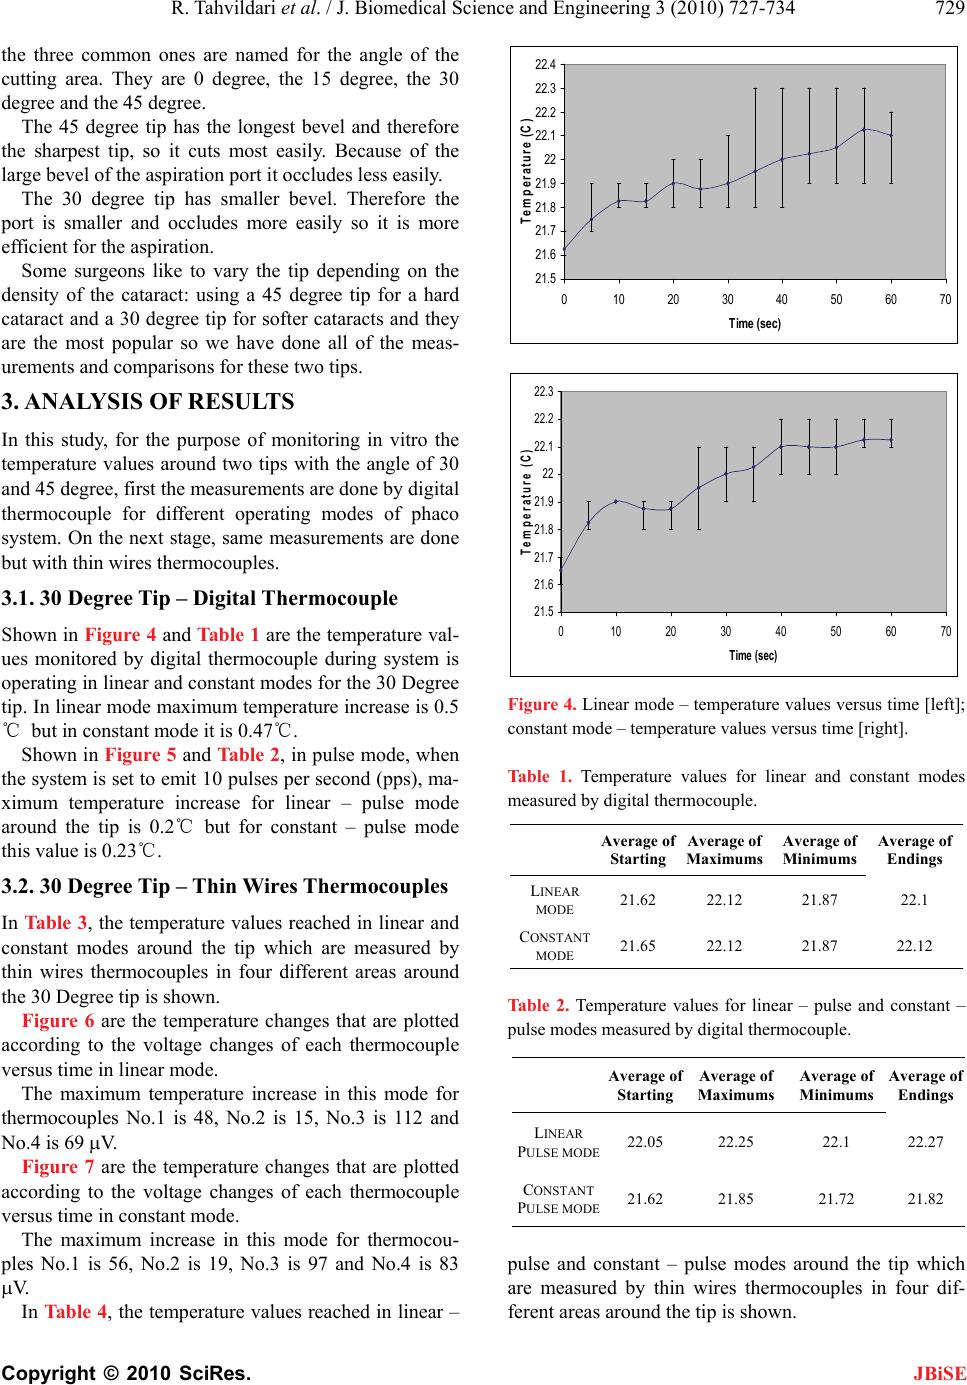 R. Tahvildari et al. / J. Biomedical Science and Engineering 3 (2010) 727-734 Copyright © 2010 SciRes. JBiSE 729 the three common ones are named for the angle of the cutting area. They are 0 degree, the 15 degree, the 30 degree and the 45 degree. The 45 degree tip has the longest bevel and therefore the sharpest tip, so it cuts most easily. Because of the large bevel of the aspiration port it occludes less easily. The 30 degree tip has smaller bevel. Therefore the port is smaller and occludes more easily so it is more efficient for the aspiration. Some surgeons like to vary the tip depending on the density of the cataract: using a 45 degree tip for a hard cataract and a 30 degree tip for softer cataracts and they are the most popular so we have done all of the meas- urements and comparisons for these two tips. 3. ANALYSIS OF RESULTS In this study, for the purpose of monitoring in vitro the temperature values around two tips with the angle of 30 and 45 degree, first the measurements are done by digital thermocouple for different operating modes of phaco system. On the next stage, same measurements are done but with thin wires thermocouples. 3.1. 30 Degree Tip – Digital Thermocouple Shown in Figure 4 and Table 1 are the temperature val- ues monitored by digital thermocouple during system is operating in linear and constant modes for the 30 Degree tip. In linear mode maximum temperature increase is 0.5 ℃ but in constant mode it is 0.47℃. Shown in Figure 5 and Table 2, in pulse mode, when the system is set to emit 10 pulses per second (pps), ma- ximum temperature increase for linear – pulse mode around the tip is 0.2℃ but for constant – pulse mode this value is 0.23℃. 3.2. 30 Degree Tip – Thin Wires Thermocouples In Table 3, the temperature values reached in linear and constant modes around the tip which are measured by thin wires thermocouples in four different areas around the 30 Degree tip is shown. Figure 6 are the temperature changes that are plotted according to the voltage changes of each thermocouple versus time in linear mode. The maximum temperature increase in this mode for thermocouples No.1 is 48, No.2 is 15, No.3 is 112 and No.4 is 69 V. Figure 7 are the temperature changes that are plotted according to the voltage changes of each thermocouple versus time in constant mode. The maximum increase in this mode for thermocou- ples No.1 is 56, No.2 is 19, No.3 is 97 and No.4 is 83 V. In Table 4, the temperature values reached in linear – 21.5 21.6 21.7 21.8 21.9 22 22.1 22.2 22.3 22.4 0 10203040506070 Time (sec) Temperature (C) 21.5 21.6 21.7 21.8 21.9 22 22.1 22.2 22.3 0 10203040506070 Time (sec) Tem p erature ( C ) Figure 4. Linear mode – temperature values versus time [left]; constant mode – temperature values versus time [right]. Table 1. Temperature values for linear and constant modes measured by digital thermocouple. Average of Endings Average of Minimums Average of Maximums Average o f Starting 22.1 21.87 22.12 21.62 LINEAR MODE 22.12 21.87 22.12 21.65 CONSTANT MODE Table 2. Temperature values for linear – pulse and constant – pulse modes measured by digital thermocouple. Average of Endings Average of Minimums Average of Maximums Average of Starting 22.27 22.1 22.25 22.05 LINEAR PULSE MODE 21.82 21.72 21.85 21.62 CONSTANT PULSE MODE pulse and constant – pulse modes around the tip which are measured by thin wires thermocouples in four dif- ferent areas around the tip is shown. 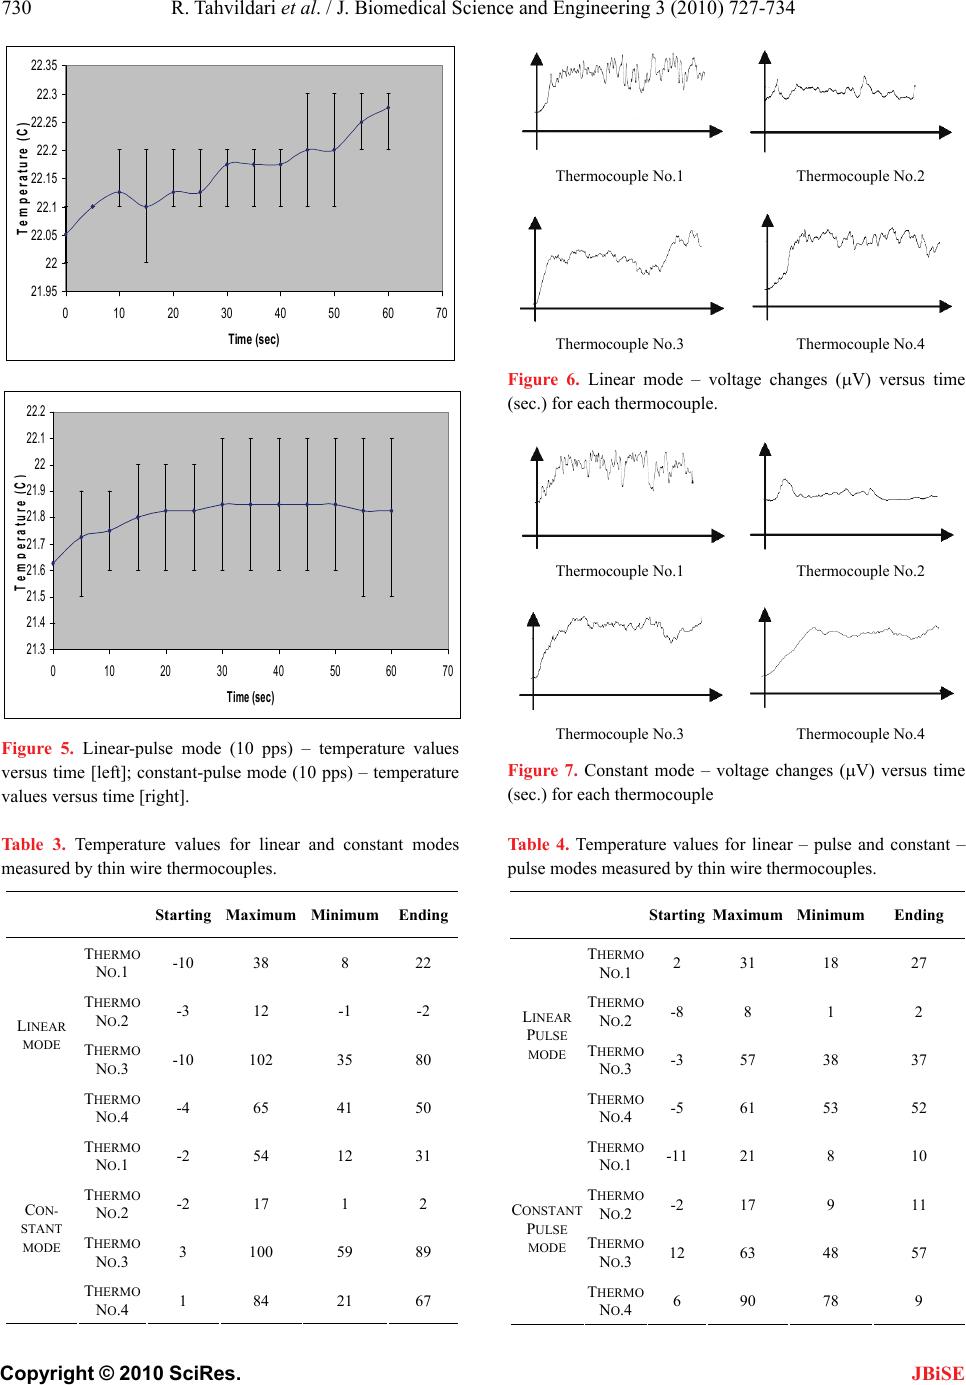 R. Tahvildari et al. / J. Biomedical Science and Engineering 3 (2010) 727-734 Copyright © 2010 SciRes. JBiSE 730 21.95 22 22.05 22.1 22.15 22.2 22.25 22.3 22.35 0 10203040506070 Time (sec) Tem p erature ( C ) 21.3 21.4 21.5 21.6 21.7 21.8 21.9 22 22.1 22.2 0 10203040506070 Time (sec) Tem perature(C) Figure 5. Linear-pulse mode (10 pps) – temperature values versus time [left]; constant-pulse mode (10 pps) – temperature values versus time [right]. Table 3. Temperature values for linear and constant modes measured by thin wire thermocouples. Starting Maximum Minimum Ending THERMO NO.1 -10 38 8 22 THERMO NO.2 -3 12 -1 -2 THERMO NO.3 -10 102 35 80 LINEAR MODE THERMO NO.4 -4 65 41 50 THERMO NO.1 -2 54 12 31 THERMO NO.2 -2 17 1 2 THERMO NO.3 3 100 59 89 CON- STANT MODE THERMO NO.4 1 84 21 67 Thermocouple No.1 Thermocouple No.2 Thermocouple No.3 Thermocouple No.4 Figure 6. Linear mode – voltage changes (V) versus time (sec.) for each thermocouple. Thermocouple No.1 Thermocouple No.2 Thermocouple No.3 Thermocouple No.4 Figure 7. Constant mode – voltage changes (V) versus time (sec.) for each thermocouple Table 4. Temperature values for linear – pulse and constant – pulse modes measured by thin wire thermocouples. StartingMaximum Minimum Ending THERMO NO.1 2 31 18 27 THERMO NO.2 -8 8 1 2 THERMO NO.3 -3 57 38 37 LINEAR PULSE MODE THERMO NO.4 -5 61 53 52 THERMO NO.1 -11 21 8 10 THERMO NO.2 -2 17 9 11 THERMO NO.3 12 63 48 57 CONSTANT PULSE MODE THERMO NO.4 6 90 78 9 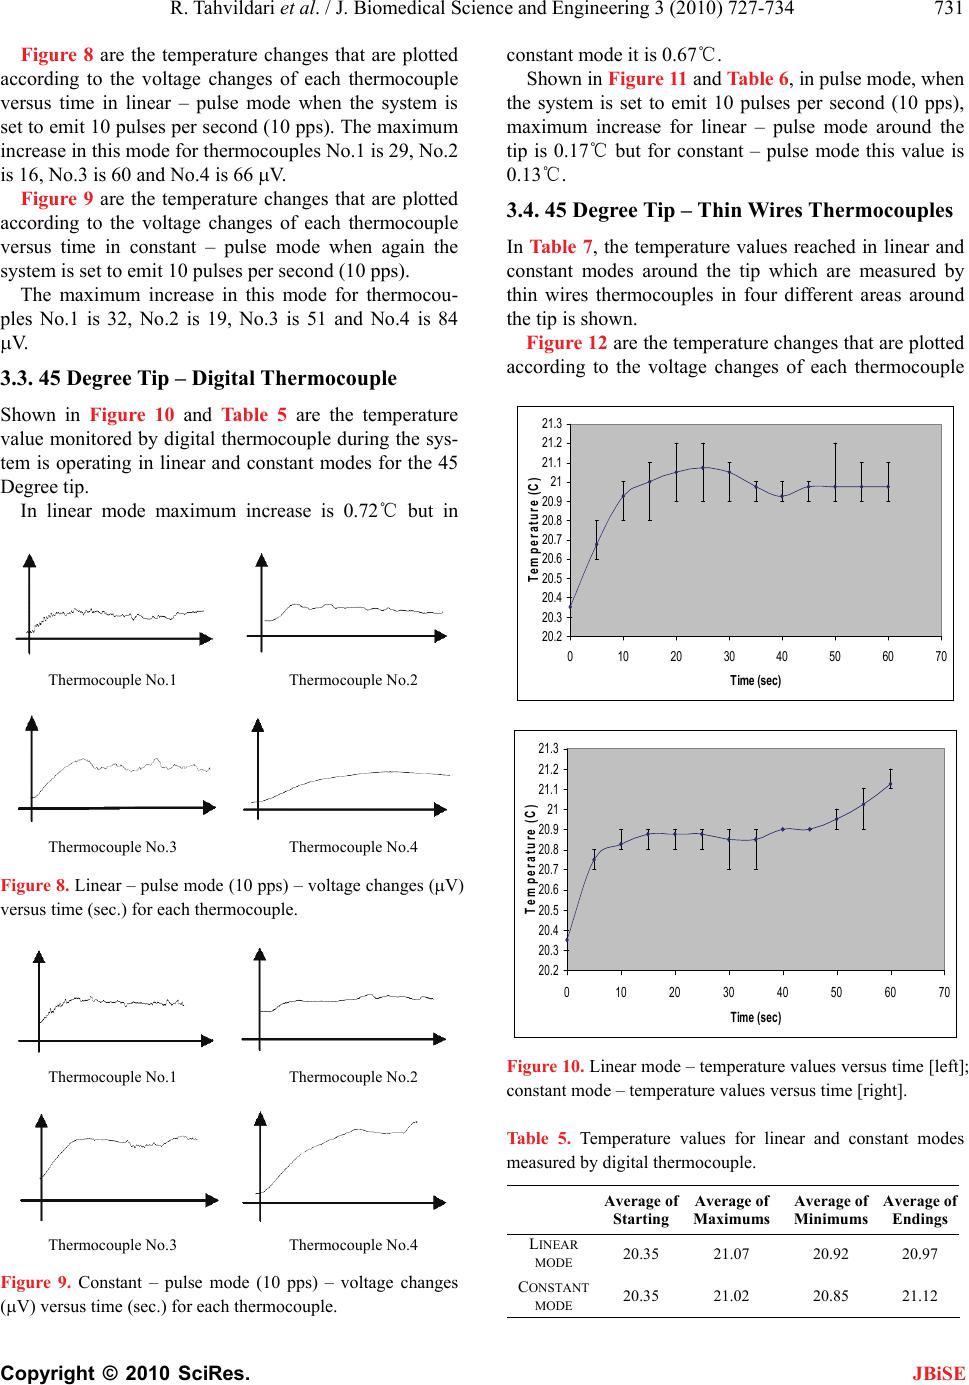 R. Tahvildari et al. / J. Biomedical Science and Engineering 3 (2010) 727-734 Copyright © 2010 SciRes. JBiSE 731 Figure 8 are the temperature changes that are plotted according to the voltage changes of each thermocouple versus time in linear – pulse mode when the system is set to emit 10 pulses per second (10 pps). The maximum increase in this mode for thermocouples No.1 is 29, No.2 is 16, No.3 is 60 and No.4 is 66 V. Figure 9 are the temperature changes that are plotted according to the voltage changes of each thermocouple versus time in constant – pulse mode when again the system is set to emit 10 pulses per second (10 pps). The maximum increase in this mode for thermocou- ples No.1 is 32, No.2 is 19, No.3 is 51 and No.4 is 84 V. 3.3. 45 Degree Tip – Digital Thermocouple Shown in Figure 10 and Table 5 are the temperature value monitored by digital thermocouple during the sys- tem is operating in linear and constant modes for the 45 Degree tip. In linear mode maximum increase is 0.72℃ but in Thermocouple No.1 Thermocouple No.2 Thermocouple No.3 Thermocouple No.4 Figure 8. Linear – pulse mode (10 pps) – voltage changes (V) versus time (sec.) for each thermocouple. Thermocouple No.1 Thermocouple No.2 Thermocouple No.3 Thermocouple No.4 Figure 9. Constant – pulse mode (10 pps) – voltage changes (V) versus time (sec.) for each thermocouple. constant mode it is 0.67℃. Shown in Figure 11 and Table 6, in pulse mode, when the system is set to emit 10 pulses per second (10 pps), maximum increase for linear – pulse mode around the tip is 0.17℃ but for constant – pulse mode this value is 0.13℃. 3.4. 45 Degree Tip – Thin Wires Thermocouples In Table 7, the temperature values reached in linear and constant modes around the tip which are measured by thin wires thermocouples in four different areas around the tip is shown. Figure 12 are the temperature changes that are plotted according to the voltage changes of each thermocouple 20.2 20.3 20.4 20.5 20.6 20.7 20.8 20.9 21 21.1 21.2 21.3 0 10203040506070 Time (sec) Temperature ( C ) 20.2 20.3 20.4 20.5 20.6 20.7 20.8 20.9 21 21.1 21.2 21.3 0 10203040506070 Time (sec) Tem p erature ( C ) Figure 10. Linear mode – temperature values versus time [left]; constant mode – temperature values versus time [right]. Table 5. Temperature values for linear and constant modes measured by digital thermocouple. Average of Endings Average of Minimums Average of Maximums Average of Starting 20.97 20.92 21.07 20.35 LINEAR MODE 21.12 20.85 21.02 20.35 CONSTANT MODE 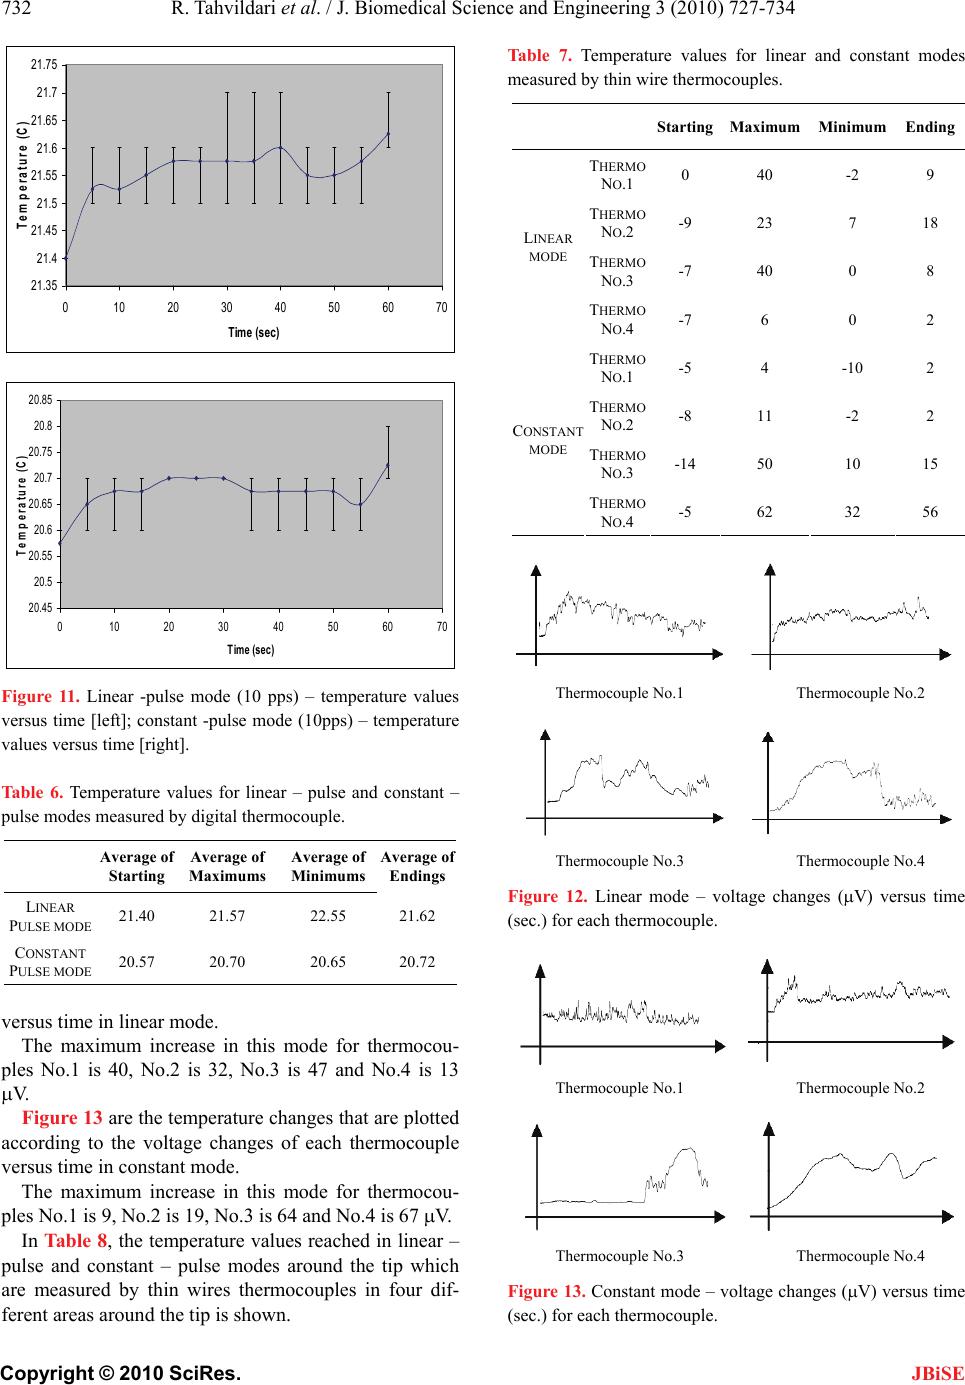 R. Tahvildari et al. / J. Biomedical Science and Engineering 3 (2010) 727-734 Copyright © 2010 SciRes. JBiSE 732 21.35 21.4 21.45 21.5 21.55 21.6 21.65 21.7 21.75 0 10203040506070 Time (sec) Tem p erature ( C ) 20.45 20.5 20.55 20.6 20.65 20.7 20.75 20.8 20.85 0 10203040506070 Time (sec) Tem p erature ( C ) Figure 11. Linear -pulse mode (10 pps) – temperature values versus time [left]; constant -pulse mode (10pps) – temperature values versus time [right]. Table 6. Temperature values for linear – pulse and constant – pulse modes measured by digital thermocouple. Average of Endings Average of Minimums Average of Maximums Average of Starting 21.62 22.55 21.57 21.40 LINEAR PULSE MODE 20.72 20.65 20.70 20.57 CONSTANT PULSE MODE versus time in linear mode. The maximum increase in this mode for thermocou- ples No.1 is 40, No.2 is 32, No.3 is 47 and No.4 is 13 V. Figure 13 are the temperature changes that are plotted according to the voltage changes of each thermocouple versus time in constant mode. The maximum increase in this mode for thermocou- ples No.1 is 9, No.2 is 19, No.3 is 64 and No.4 is 67 V. In Table 8, the temperature values reached in linear – pulse and constant – pulse modes around the tip which are measured by thin wires thermocouples in four dif- ferent areas around the tip is shown. Table 7. Temperature values for linear and constant modes measured by thin wire thermocouples. StartingMaximum MinimumEnding THERMO NO.1 0 40 -2 9 THERMO NO.2 -9 23 7 18 THERMO NO.3 -7 40 0 8 LINEAR MODE THERMO NO.4 -7 6 0 2 THERMO NO.1 -5 4 -10 2 THERMO NO.2 -8 11 -2 2 THERMO NO.3 -14 50 10 15 CONSTANT MODE THERMO NO.4 -5 62 32 56 Thermocouple No.1 Thermocouple No.2 Thermocouple No.3 Thermocouple No.4 Figure 12. Linear mode – voltage changes (V) versus time (sec.) for each thermocouple. Thermocouple No.1 Thermocouple No.2 Thermocouple No.3 Thermocouple No.4 Figure 13. Constant mode – voltage changes (V) versus time (sec.) for each thermocouple. 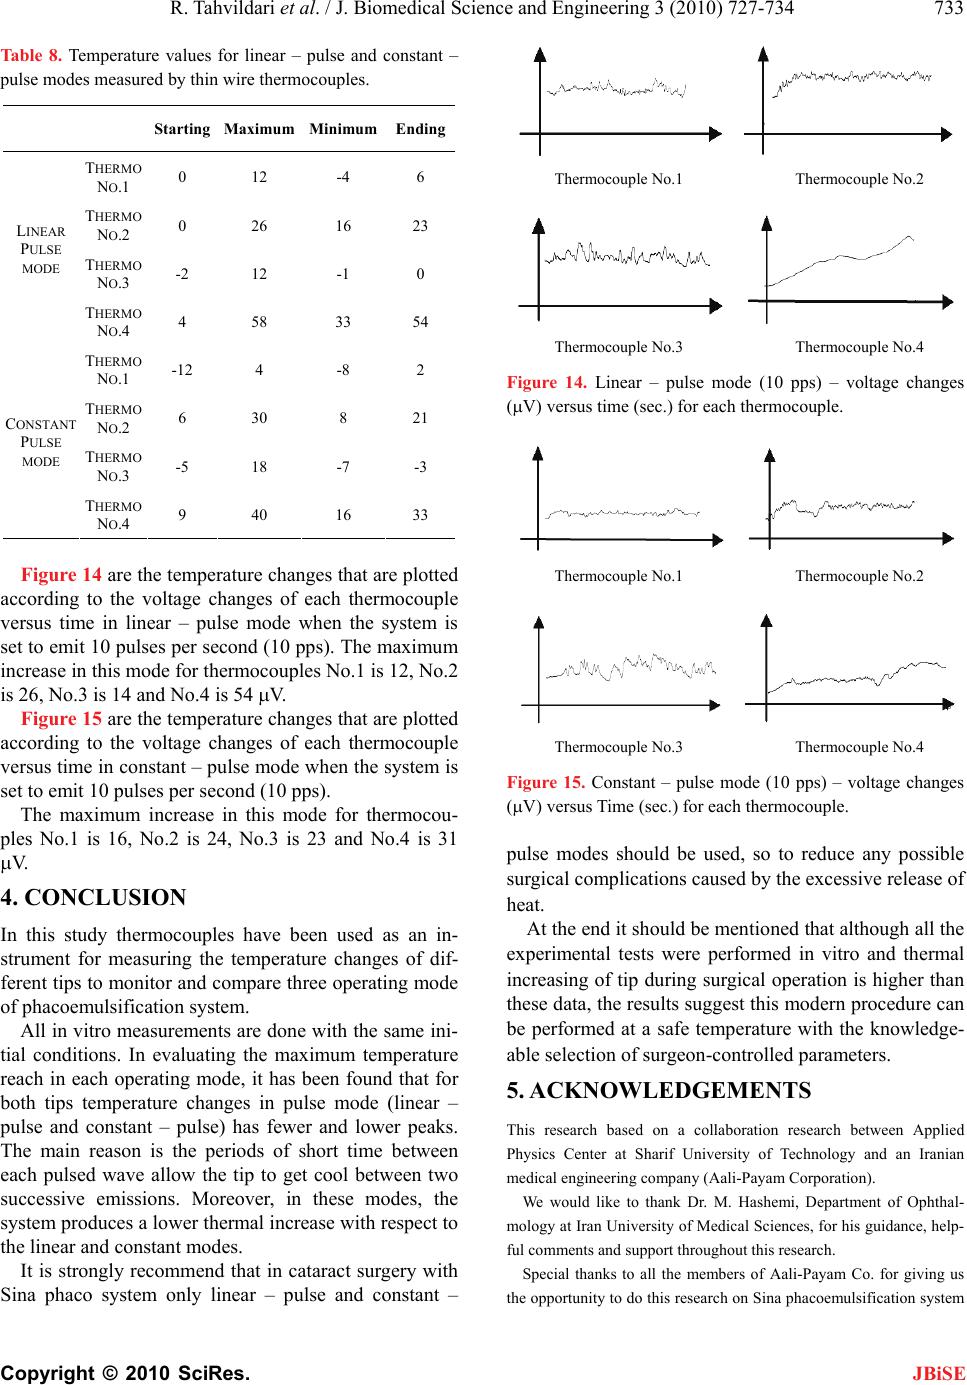 R. Tahvildari et al. / J. Biomedical Science and Engineering 3 (2010) 727-734 Copyright © 2010 SciRes. JBiSE 733 Table 8. Temperature values for linear – pulse and constant – pulse modes measured by thin wire thermocouples. Starting Maximum Minimum Ending THERMO NO.1 0 12 -4 6 THERMO NO.2 0 26 16 23 THERMO NO.3 -2 12 -1 0 LINEAR PULSE MODE THERMO NO.4 4 58 33 54 THERMO NO.1 -12 4 -8 2 THERMO NO.2 6 30 8 21 THERMO NO.3 -5 18 -7 -3 CONSTANT PULSE MODE THERMO NO.4 9 40 16 33 Figure 14 are the temperature changes that are plotted according to the voltage changes of each thermocouple versus time in linear – pulse mode when the system is set to emit 10 pulses per second (10 pps). The maximum increase in this mode for thermocouples No.1 is 12, No.2 is 26, No.3 is 14 and No.4 is 54 V. Figure 15 are the temperature changes that are plotted according to the voltage changes of each thermocouple versus time in constant – pulse mode when the system is set to emit 10 pulses per second (10 pps). The maximum increase in this mode for thermocou- ples No.1 is 16, No.2 is 24, No.3 is 23 and No.4 is 31 V. 4. CONCLUSION In this study thermocouples have been used as an in- strument for measuring the temperature changes of dif- ferent tips to monitor and compare three operating mode of phacoemulsification system. All in vitro measurements are done with the same ini- tial conditions. In evaluating the maximum temperature reach in each operating mode, it has been found that for both tips temperature changes in pulse mode (linear – pulse and constant – pulse) has fewer and lower peaks. The main reason is the periods of short time between each pulsed wave allow the tip to get cool between two successive emissions. Moreover, in these modes, the system produces a lower thermal increase with respect to the linear and constant modes. It is strongly recommend that in cataract surgery with Sina phaco system only linear – pulse and constant – Thermocouple No.1 Thermocouple No.2 Thermocouple No.3 Thermocouple No.4 Figure 14. Linear – pulse mode (10 pps) – voltage changes (V) versus time (sec.) for each thermocouple. Thermocouple No.1 Thermocouple No.2 Thermocouple No.3 Thermocouple No.4 Figure 15. Constant – pulse mode (10 pps) – voltage changes (V) versus Time (sec.) for each thermocouple. pulse modes should be used, so to reduce any possible surgical complications caused by the excessive release of heat. At the end it should be mentioned that although all the experimental tests were performed in vitro and thermal increasing of tip during surgical operation is higher than these data, the results suggest this modern procedure can be performed at a safe temperature with the knowledge- able selection of surgeon-controlled parameters. 5. ACKNOWLEDGEMENTS This research based on a collaboration research between Applied Physics Center at Sharif University of Technology and an Iranian medical engineering company (Aali-Payam Corporation). We would like to thank Dr. M. Hashemi, Department of Ophthal- mology at Iran University of Medical Sciences, for his guidance, help- ful comments and support throughout this research. Special thanks to all the members of Aali-Payam Co. for giving us the opportunity to do this research on Sina phacoemulsification system 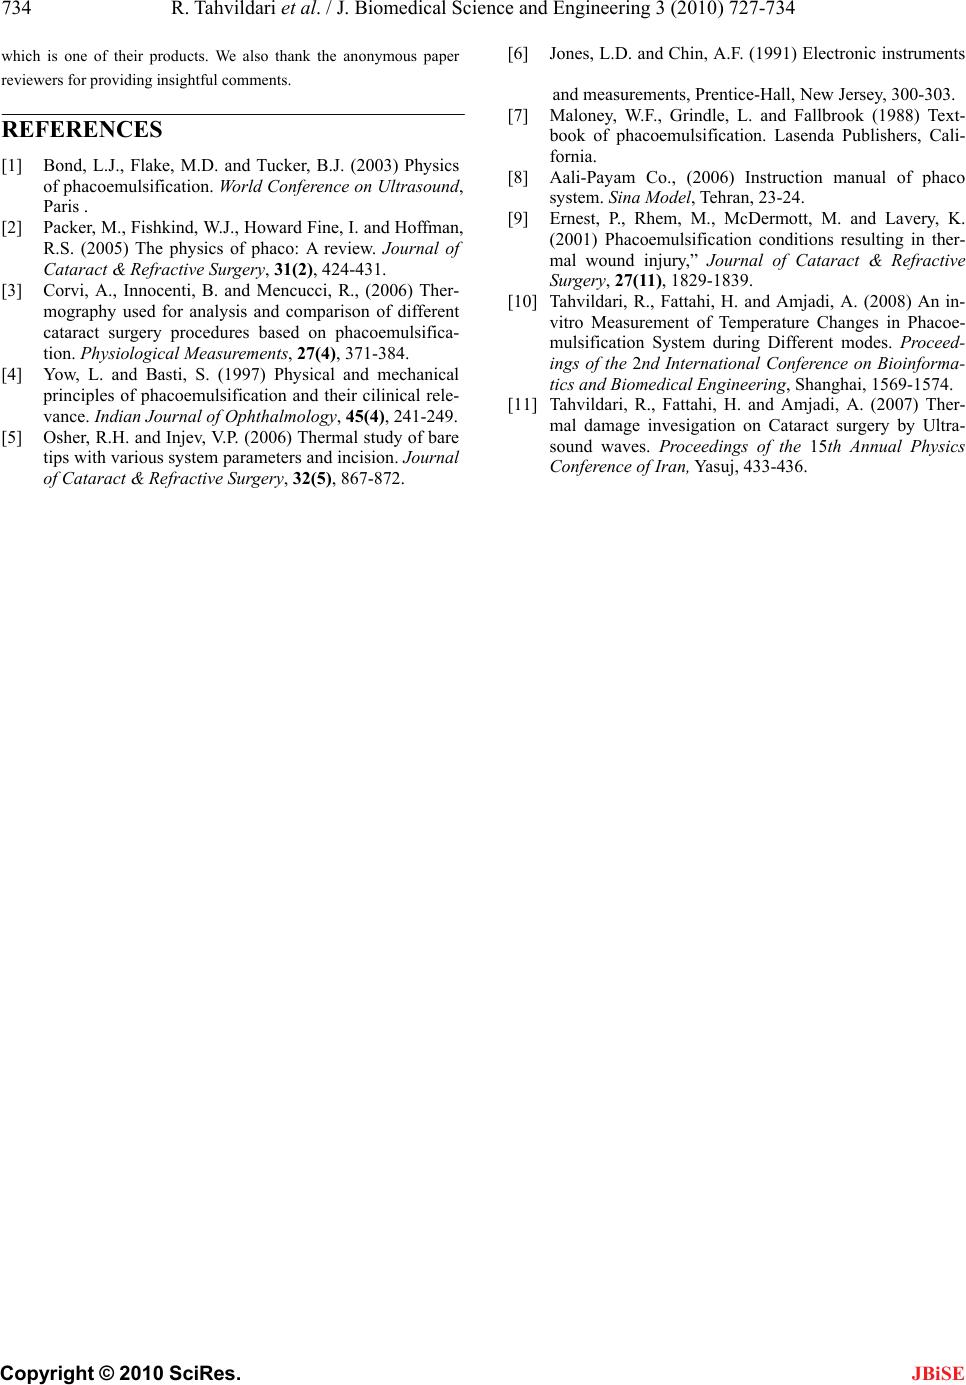 R. Tahvildari et al. / J. Biomedical Science and Engineering 3 (2010) 727-734 Copyright © 2010 SciRes. JBiSE 734 which is one of their products. We also thank the anonymous paper reviewers for providing insightful comments. REFERENCES [1] Bond, L.J., Flake, M.D. and Tucker, B.J. (2003) Physics of phacoemulsification. World Conference on Ultrasound, Paris . [2] Packer, M., Fishkind, W.J., Howard Fine, I. and Hoffman, R.S. (2005) The physics of phaco: A review. Journal of Cataract & Refractive Surgery, 31(2), 424-431. [3] Corvi, A., Innocenti, B. and Mencucci, R., (2006) Ther- mography used for analysis and comparison of different cataract surgery procedures based on phacoemulsifica- tion. Physiological Measurements, 27(4), 371-384. [4] Yow, L. and Basti, S. (1997) Physical and mechanical principles of phacoemulsification and their cilinical rele- vance. Indian Journal of Ophthalmology, 45(4), 241-249. [5] Osher, R.H. and Injev, V.P. (2006) Thermal study of bare tips with various system parameters and incision. Journal of Cataract & Refractive Surgery, 32(5), 867-872. [6] Jones, L.D. and Chin, A.F. (1991) Electronic instruments and measurements, Prentice-Hall, New Jersey, 300-303. [7] Maloney, W.F., Grindle, L. and Fallbrook (1988) Text- book of phacoemulsification. Lasenda Publishers, Cali- fornia. [8] Aali-Payam Co., (2006) Instruction manual of phaco system. Sina Model, Tehran, 23-24. [9] Ernest, P., Rhem, M., McDermott, M. and Lavery, K. (2001) Phacoemulsification conditions resulting in ther- mal wound injury,” Journal of Cataract & Refractive Surgery, 27(11), 1829-1839. [10] Tahvildari, R., Fattahi, H. and Amjadi, A. (2008) An in- vitro Measurement of Temperature Changes in Phacoe- mulsification System during Different modes. Proceed- ings of the 2nd International Conference on Bioinforma- tics and Biomedical Engineering, Shanghai, 1569-1574. [11] Tahvildari, R., Fattahi, H. and Amjadi, A. (2007) Ther- mal damage invesigation on Cataract surgery by Ultra- sound waves. Proceedings of the 15th Annual Physics Conference of Iran, Yasuj, 433-436. |