 Journal of Water Resource and Protection, 2012, 4, 674-685 http://dx.doi.org/10.4236/jwarp.2012.48078 Published Online August 2012 (http://www.SciRP.org/journal/jwarp) Aquifer Vulnerability Assessment and Wellhead Pr otection Areas to Prevent Groundwater Contamination in Agricultural Areas: An Integrated Approach Stefano Lo Russo*, Glenda Taddia Department of Environment, Land and Infrastructure Engineering (DIATI), Polytechnic of Turin, Turin, Italy Email: *stefano.lorusso@polito.it Received June 22, 2012; revised July 25, 2012; accepted August 3, 2012 ABSTRACT To implement successful policies for the protection of groundwater and curtail the possibility of water supply contami- nation, an early evaluation of aquifer vulnerability is needed. Rather than implementing broad restrictions to land use and effluent discharge, it is more cost-effective and economically favourable to approach protection in a stepwise man- ner by first assessing the in trinsic vulnerability of the aq uifer when defining the level of land use con trol that is needed to protect groundwater quality. Following aqu ifer vulnerability evaluation , specific land uses and restrictions sh ould be defined locally for each water supply with in the wellhead protection areas (WHPAs), which are identified by means of the groundwater time of travel (TOT). The WHPA should be established for each individual situation, considering the level of vulnerability of the exploited aquifer. We applied our findings to a specific test site in the Piemonte region of NW Italy, following the current local procedure for individuating the WHPAs. Using data gathered from this site-spe- cific exercise, we identified that the procedure allows methods that consider only aquifer parameters to evaluate vul- nerability and discourages the use of techniques that already compartmentalize soil parameters in the vulnerability as- sessment. Keywords: Groundwater Protection Zones; WHPA; Vulnerability; FEFLOW; Piemonte; Italy 1. Introduction Groundwater quality in many parts of the world has ex- perienced significant degradation due to agricultural, industrial and/or commercial activities. Historically, damage to groundwater supplies has often occurr ed when contaminants reach aquifers via the vertical pathway in- troduced by surface wells. Because of the importance of groundwater, and the difficulty and expense in remediat- ing groundwater supplies, steps are now often taken to prevent initial pollution. Those steps can include pro- tecting the whole aquifer, as well as the area sur rounding the surface wellhead, from inadvertent contamination [1-6]. Use of the term “aquifer pollution vulnerability” began in the 1970s in France [7] and more widely in the 1980s [8-10], when it became increasingly clear through re- search that many aquifers were suffering from significant anthropogenic contamination resulting in degradation which compromised usability of the resource. Several studies have targeted the development of vulnerability mapping techniques; results of these investigations have led to new definitions applicable to groundwater protec- tion issues [11-20]. “Vulnerability” is generally defined as the (intrinsic) sensitivity of an aquifer to being ad- versely affected by a contaminant; “groundwater pollu- tion hazard” relates to the probability that groundwater in an aquifer will be contaminated at concentrations that pose a risk to human health or the environment that is hydraulically connected to the groundwater [4]. An ab- solute (numeric) index of aquifer pollution vulnerability is far more useful than relative indicators for all practical applications in land-use planning and effluent discharge control. With this goal in mind, several methods pro- posed in the literature are focused on vulnerability as- sessment. They vary by the parameters and mathematical expressions considered. GOD [10] and modified GOD [4], DRASTIC [9], EPIK for karst settings [21] and SINTACS [22] are acronimous of the most widely util- ized processes. Each method can provide a numerical index which is generally correlated to a vulnerability class definition that is qualitatively described at the end of the evaluation process (usually high, moderate, low and negligible). The selection of the appropriate meth- odology depends on the hydrogeological setting and *Corresponding a uthor. C opyright © 2012 SciRes. JWARP 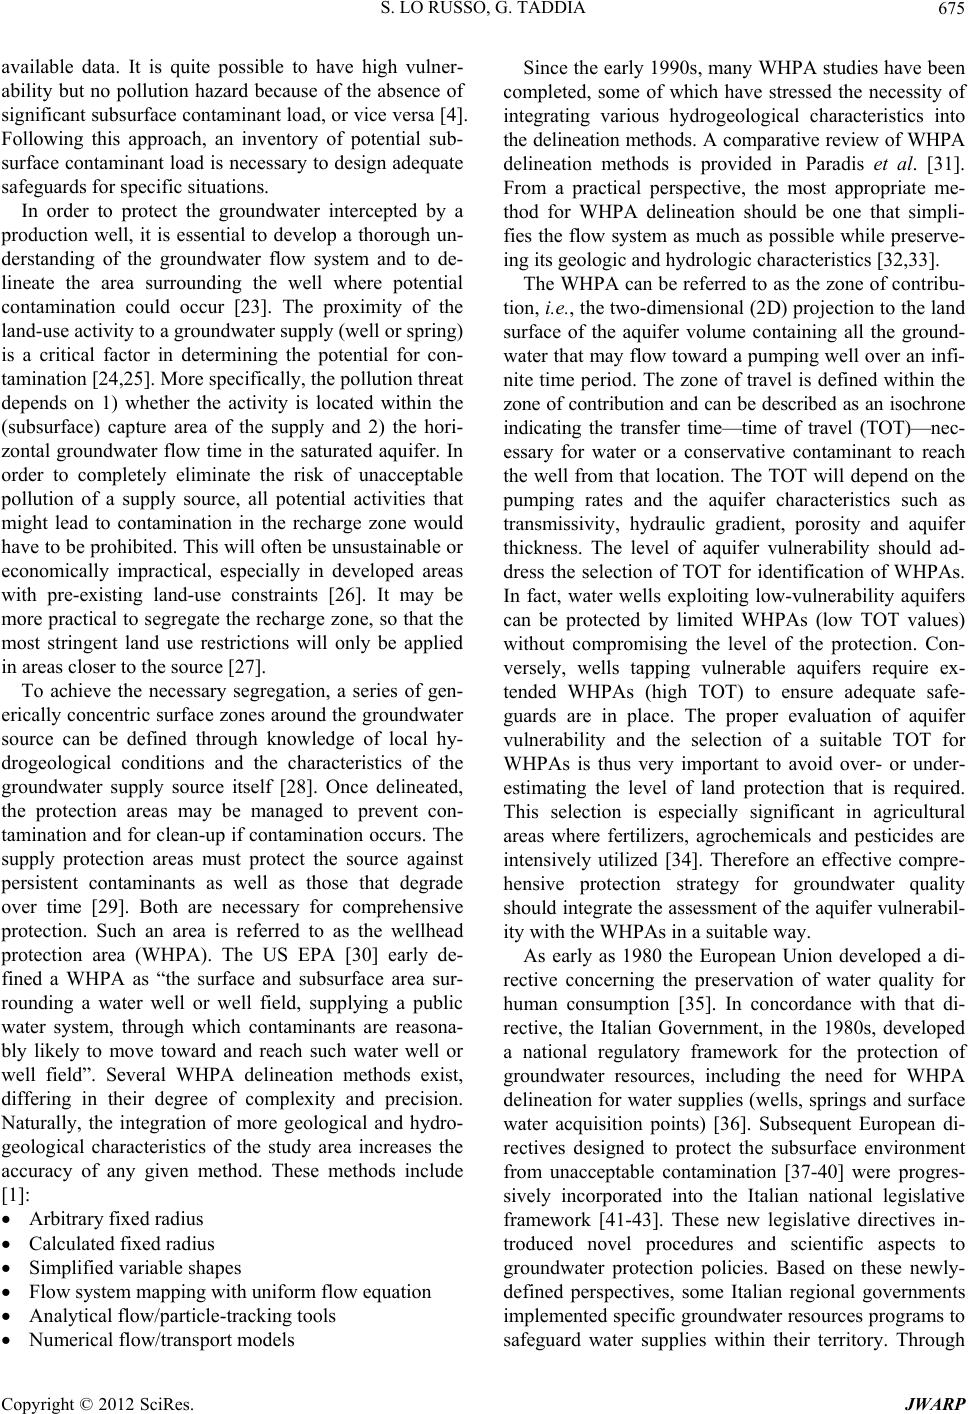 S. LO RUSSO, G. TADDIA 675 available data. It is quite possible to have high vulner- ability but no pollution hazard because of the absence of significant subsurface contaminant load, or vice versa [4]. Following this approach, an inventory of potential sub- surface contaminant load is necessary to design adequate safeguards for specific situations. In order to protect the groundwater intercepted by a production well, it is essential to develop a thorough un- derstanding of the groundwater flow system and to de- lineate the area surrounding the well where potential contamination could occur [23]. The proximity of the land-use activity to a gro undw ater sup p ly (well or sp r ing) is a critical factor in determining the potential for con- tamination [24,25]. More specifically, the pollution threat depends on 1) whether the activity is located within the (subsurface) capture area of the supply and 2) the hori- zontal groundwater flow time in the saturated aquifer. In order to completely eliminate the risk of unacceptable pollution of a supply source, all potential activities that might lead to contamination in the recharge zone would have to be prohibited. Th is will often be unsustainable or economically impractical, especially in developed areas with pre-existing land-use constraints [26]. It may be more practical to segregate the recharge zone, so that the most stringent land use restrictions will only be applied in areas closer to the source [27]. To achieve the necessary segregation, a series of gen- erically concentric surface zones around the groundwater source can be defined through knowledge of local hy- drogeological conditions and the characteristics of the groundwater supply source itself [28]. Once delineated, the protection areas may be managed to prevent con- tamination and for clean-up if contamination occurs. The supply protection areas must protect the source against persistent contaminants as well as those that degrade over time [29]. Both are necessary for comprehensive protection. Such an area is referred to as the wellhead protection area (WHPA). The US EPA [30] early de- fined a WHPA as “the surface and subsurface area sur- rounding a water well or well field, supplying a public water system, through which contaminants are reasona- bly likely to move toward and reach such water well or well field”. Several WHPA delineation methods exist, differing in their degree of complexity and precision. Naturally, the integration of more geological and hydro- geological characteristics of the study area increases the accuracy of any given method. These methods include [1]: Arbitrary fixed ra dius Calculated fixed radius Simplified variable shapes Flow system mapping with uniform flow equation Analytical flow/particle-tracking tools Numerical flow/transport models Since the early 1990s, many WHPA studies have been completed, some of which have stressed the necessity of integrating various hydrogeological characteristics into the delineation methods. A comparative review of WHPA delineation methods is provided in Paradis et al. [31]. From a practical perspective, the most appropriate me- thod for WHPA delineation should be one that simpli- fies the flow system as much as possible while preserve- ing its geologic and hydrologic characteristics [32,33]. The WHPA can be referred to as the zone of contribu- tion, i.e., the two-dimensional (2D) projectio n to the land surface of the aquifer volume containing all the ground- water that may flow toward a pumping well over an infi- nite time period. The zone of travel is defined within the zone of contribution and can be described as an isochrone indicating the transfer time—time of travel (TOT)—nec- essary for water or a conservative contaminant to reach the well from that location. The TOT will depend on the pumping rates and the aquifer characteristics such as transmissivity, hydraulic gradient, porosity and aquifer thickness. The level of aquifer vulnerability should ad- dress the selection of TOT for identification of WHPAs. In fact, water wells exploiting low-vulnerability aquifers can be protected by limited WHPAs (low TOT values) without compromising the level of the protection. Con- versely, wells tapping vulnerable aquifers require ex- tended WHPAs (high TOT) to ensure adequate safe- guards are in place. The proper evaluation of aquifer vulnerability and the selection of a suitable TOT for WHPAs is thus very important to avoid over- or under- estimating the level of land protection that is required. This selection is especially significant in agricultural areas where fertilizers, agrochemicals and pesticides are intensively utilized [34]. Therefore an effective compre- hensive protection strategy for groundwater quality should integrate the assessment of the aquifer vu lnerabil- ity with the WHPAs in a suitable way. As early as 1980 the European Union developed a di- rective concerning the preservation of water quality for human consumption [35]. In concordance with that di- rective, the Italian Government, in the 1980s, developed a national regulatory framework for the protection of groundwater resources, including the need for WHPA delineation for water supplies (wells, springs and surface water acquisition points) [36]. Subsequent European di- rectives designed to protect the subsurface environment from unacceptable contamination [37-40] were progres- sively incorporated into the Italian national legislative framework [41-43]. These new legislative directives in- troduced novel procedures and scientific aspects to groundwater protection policies. Based on these newly- defined perspectives, some Italian regional governments implemented specific groundwater resources programs to safeguard water supplies within their territory. Through Copyright © 2012 SciRes. JWARP  S. LO RUSSO, G. TADDIA Copyright © 2012 SciRes. JWARP 676 specific regulations [44] the Piemonte region environ- mental authority (NW Italy) tried to ensure proper align- ment between aquifer vulnerability and the WHPAs de- lineation. Actions taken to preserve and protect groundwater re- sources within a WHPA, particularly those encompassing limitations on certain agriculture practices, must be ap- proached in a collaborative fash ion with local agriculture stakeholders, and must take into account available best practices and supporting scientific data. In this paper we tested 1) the current comprehensive technical framework for individual WHPAs in the Piemonte region on a representative case study. We highlighted some critical and 2) we proposed a limited review of the adopted methodology. 2. Methods 2.1. Identifying WHPAs in the Piemonte Region (NW Italy): Techniques and Regulations As implemented in the Piemonte region [44], a WHPA consists of three different decreasing protection levels situated at increasing distances, respectively, from the well (Table 1). The WHPA has to be defined through a procedure based on existing information and specific surveys. The regulations procedure individuating the WHPA requires an initial geological and hydrogeological general invest- tigation of the area. It is followed by evaluation of aqui- fer vulnerability, assessment of the aquifer hydrodynamic parameters by means of appropriate pumping tests, cal- culation of the isochrones through analytical or numeri- cal models and, finally, an inventory of activities that have the potential for causing contamination within the WHPAs. These data allow for delineation of the WHPA and definition of the land use management plan within the area. Once defined, land use restrictions are con- trolled by the water supply company managing the well in cooperation with the regional environmental authority. The WHPA is usually divided into two sub-areas, namely the inner protection zone (IPZ) and the outer protection zone (OPZ). The IPZ is always individuated by the 60-d isochrone, while the TOT that identifies the OPZ depends on the vulnerability of the exploited aqui- fer. There are four generally accepted vulnerability cate- gories: Very High, High, Medium and Low. For low aq- uifer vulnerability the OPZ must be calculated using the 180-d isochrone; the remaining vulnerability categories are determined by utilizing the 365-d isochrone. It should be noted that regulations do not provide any specifica- tions about the methodology for assessing aquifer vul- nerability. The suitable method must be decided on a case by case basis. For WHPAs overlaying agricultural areas, a specific fertilizer and phytosanitary management plan must be developed which integrates the general land use management plan. It should ensure the safe applica- tion of fertilizers, agrochemicals and pesticides, taking into account the attenuation capacity of the soil cover with respect to groundwater pollution. Determination of this protection capacity must consider at least the fol- lowing soil parameters: texture, skeleton, soil depth and cracks. These soil data are generally available for the general region. Soil protection capacity has been evalu- ated by IPLA [45] and is currently available digitally via the internet. In areas for which historical data are not available, a specific site evaluation should be developed (minimum 1 soil profile/2 ha of WHPA). Four soil pro- tection capacity categories have been established: very high, high, medium and low. By combining the aquifer vulnerability and the soil protection capacity within the WHPA in a suitable manner (Table 2), four levels of land use restrictions are identified and the corresponding agricultural land use limitations have been specifically defined (Table 3). 2.2. Test Site: The Castagnole Well The procedure for developing a specific WHPA, as de- scribed in Section 2.1, was tested on a water well supply ing the Castagnole municipality, located 20 km south of the Turin urban area (see Figure 1), which is the capital of the Piemonte region (well geographical coordinates are 45˚54'01.93''N, 7˚33'23.55''E). The elevation of the site is 244 m asl. The tested well is 88 m deep. The di- Table 1. WHPA differentiation and permitted land use s ac c ording to the Italian water regulations (modified after [42]). WHPA zone Individuating criteria Land uses Total protection zone (TPZ) Fixed radius (10 m minimum) None. This zone should be fully preserved, imp ermeabilized, enclosed, and with limited access for authorized personnel only. Inner protection zone (IPZ) Time of tra vel (60-d isochrone) Strongly limited. No excavation and subsurface work is allowed. Hazardous activities should be re-located if they are present. New buildings construction is prohibited. Outer protection zone (OPZ) Time of travel (180-d and 365-d isoch rones for low vulnerability aquifers or medium, high and very high vulnerability aquifers, respectively) Limited. Only minor anthropogenic activities are allowed, and safeguard measures against groundwater pollution are necessary for existing and new buildings. 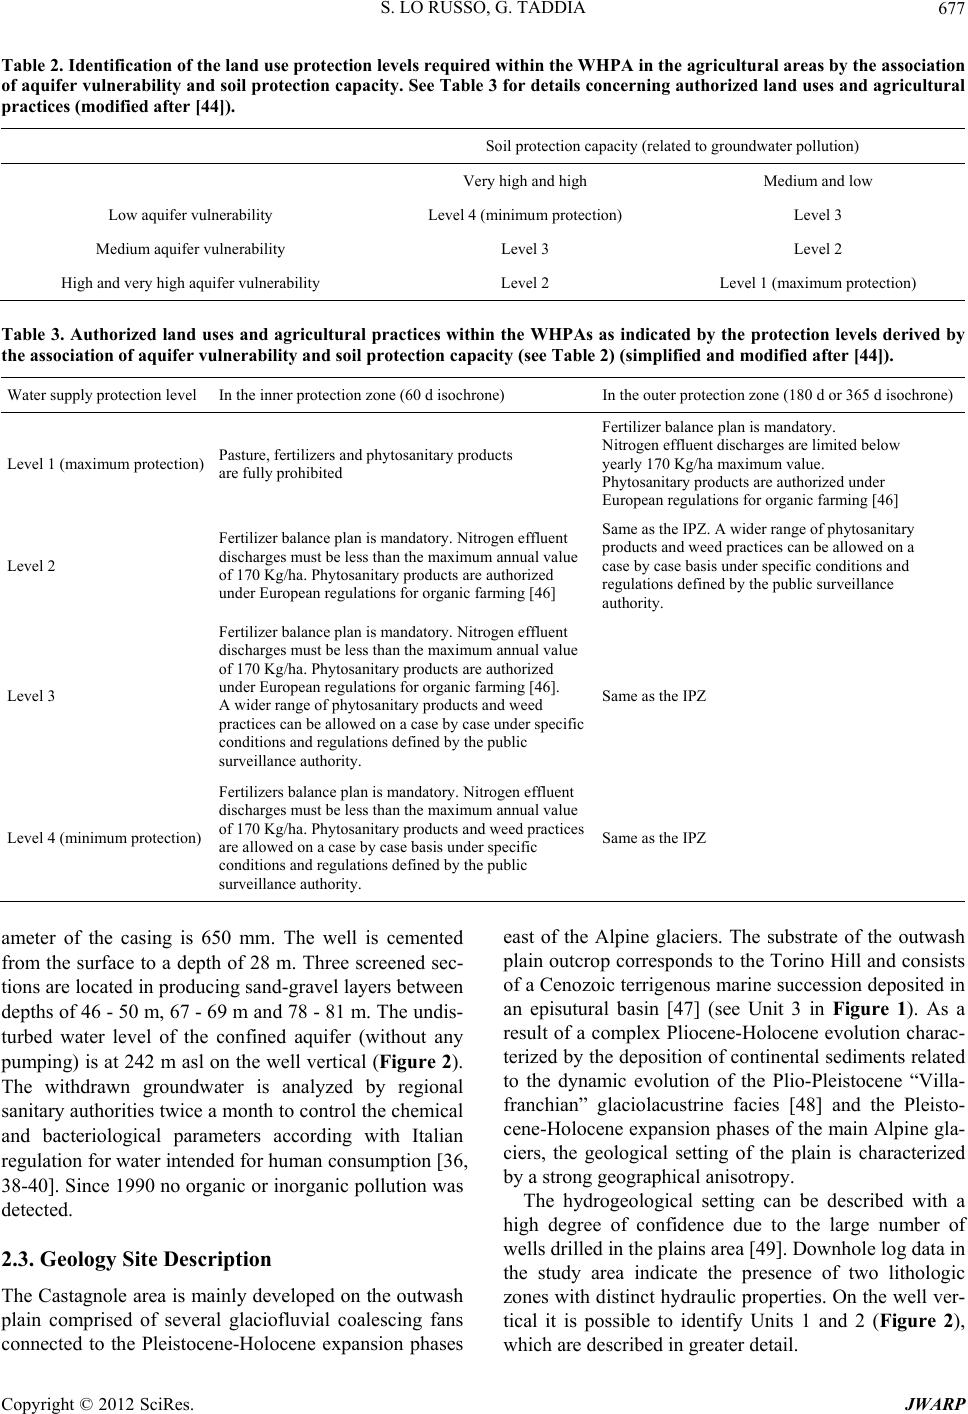 S. LO RUSSO, G. TADDIA 677 Table 2. Identification of the land use protection levels required within the WHPA in the agricultural areas by the association of aquifer vulnerability and soil protection capacity. See Table 3 for details concerning authorized land uses and agricultural practices (modified after [44]). Soil protection capacity (related to groundwater pollution) Very high and high Medium and low Low aquifer vulnerability Level 4 (minimum protection) Level 3 Medium aquifer vulnerability Level 3 Level 2 High and very high aquifer vulnerability Level 2 Level 1 (maximum protection) Table 3. Authorized land uses and agricultural practices within the WHPAs as indicated by the protection levels derived by the association of aquifer vulnerability and soil protection capacity (see Table 2) (simplified and modified after [44]). Water supply protection lev el In the inner protection zone (60 d isochrone) In the outer p rotection zone (180 d or 365 d isochrone) Level 1 (maximum protection) Pasture, fertilizers and phytosanitary products are fully prohibited Fertilizer balance plan is mandatory. Nitrogen effluent discharges are limited below yearly 170 K g / ha maximum value. Phytosanitary products are authorized under European regulations for organic farming [46] Level 2 Fertilizer balance plan is mandatory. Nitrogen effluent discharges must be less than the maximum annual value of 170 Kg/ha. Phytosanitary products are authorized under European regulations for o rganic farming [46] Same as the IPZ. A wider range of ph ytosanitary products and weed practices can be allowed on a case by case basis under specific conditions and regulations defined by the public surveillance authority. Level 3 Fertilizer balance plan is mandatory. Nitrogen effluent discharges must be less than the maximum annual value of 170 Kg/ha. Phytosanitary products are authorized under European regulations for organic farming [46]. A wider range of phytosanitary products and weed practices can be allowed on a case by case under specific conditions and regulations defined by the public surveillance authority. Same as the IPZ Level 4 (minimum protection) Fertilizers balance plan is mandatory. Nitrogen effluent discharges must be less than the maximum annual value of 170 Kg/ha. Phytosanitary products and weed practices are allowed on a case by case basis under specific conditions and regulations defined by the public surveillance authority. Same as the IPZ ameter of the casing is 650 mm. The well is cemented from the surface to a depth of 28 m. Three screened sec- tions are located in producing sand-gravel layers between depths of 46 - 50 m, 67 - 69 m and 78 - 81 m. The undis- turbed water level of the confined aquifer (without any pumping) is at 242 m asl on the well vertical (Figure 2). The withdrawn groundwater is analyzed by regional sanitary authorities twice a month to control the chemical and bacteriological parameters according with Italian regulation for water intended for human consumption [36, 38-40]. Since 1990 no organic or inorganic pollution was detected. 2.3. Geology Site Description The Castagnole area is mainly developed on the outwash plain comprised of several glaciofluvial coalescing fans connected to the Pleistocene-Holocene expansion phases east of the Alpine glaciers. The substrate of the outwash plain outcrop corresponds to the Torino Hill and consists of a Cenozoic ter rigenous marine su ccession deposited in an episutural basin [47] (see Unit 3 in Figure 1). As a result of a complex Pliocene-Holocene evolution charac- terized by the deposition of continen tal sediments related to the dynamic evolution of the Plio-Pleistocene “Villa- franchian” glaciolacustrine facies [48] and the Pleisto- cene-Holocene expansion phases of the main Alpine gla- ciers, the geological setting of the plain is characterized by a strong geographical anisotropy. The hydrogeological setting can be described with a high degree of confidence due to the large number of wells drilled in the plains area [49]. Dow nhole log data in the study area indicate the presence of two lithologic zones with distinct hydraulic properties. On the well ver- tical it is possible to identify Units 1 and 2 (Figure 2), which are described in greater detail. Copyright © 2012 SciRes. JWARP  S. LO RUSSO, G. TADDIA 678 Figure 1. Hydrogeological map of the southern Turin area and location of the study site (modified after [50]). Figure 2. Schematic hydrogeological cross section of the study site (see Figure 3 for location). i: gradient of confined aquifer potentiometric surface. Copyright © 2012 SciRes. JWARP 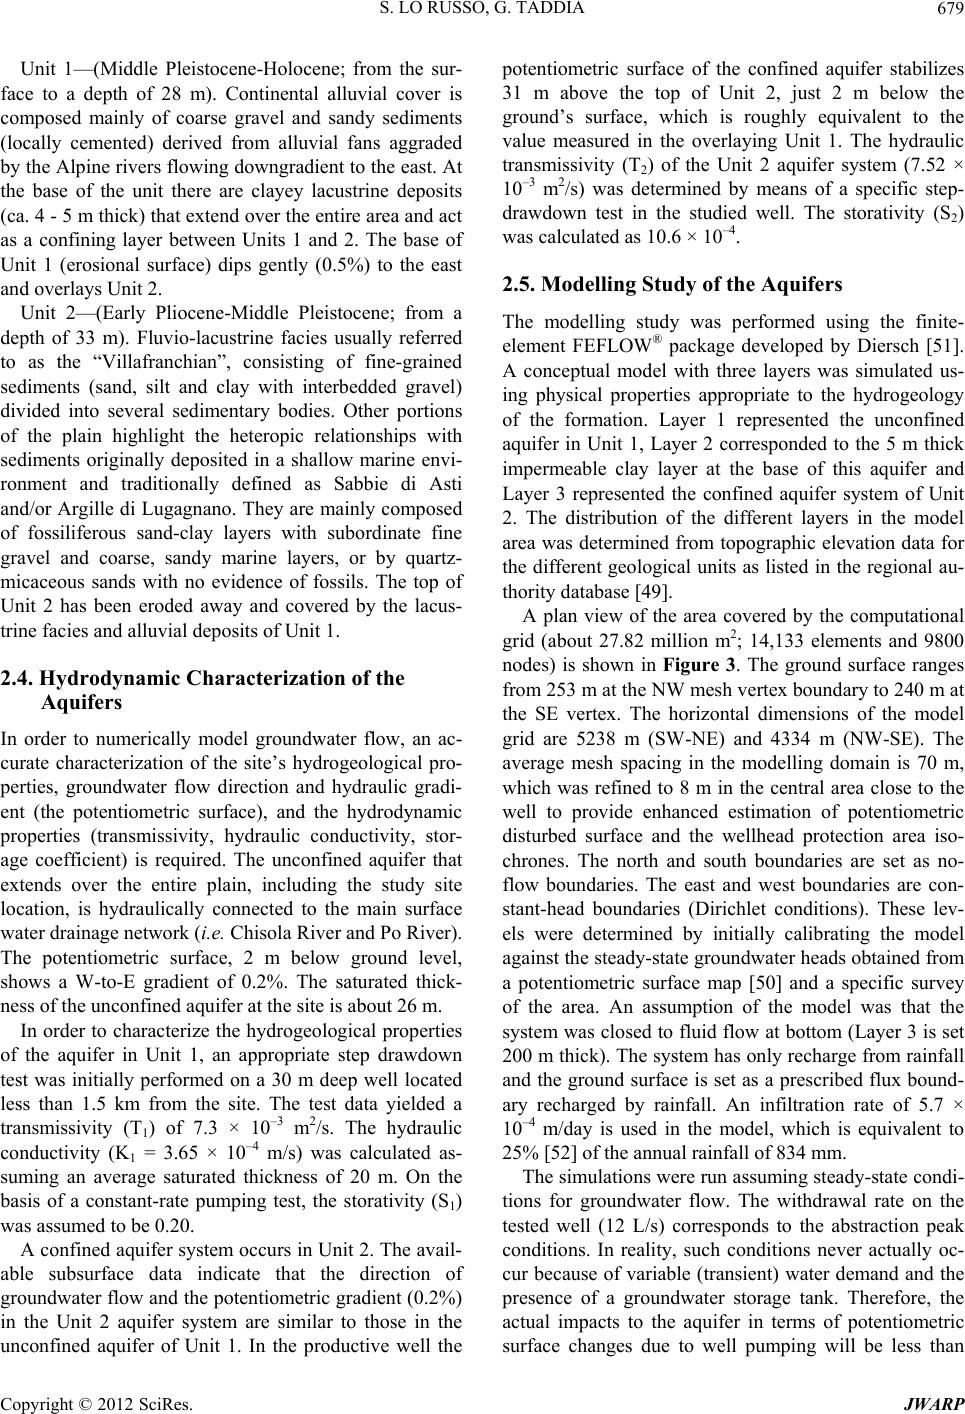 S. LO RUSSO, G. TADDIA 679 Unit 1—(Middle Pleistocene-Holocene; from the sur- face to a depth of 28 m). Continental alluvial cover is composed mainly of coarse gravel and sandy sediments (locally cemented) derived from alluvial fans aggraded by the Alpine rivers flowing downgradient to the east. At the base of the unit there are clayey lacustrine deposits (ca. 4 - 5 m thick) that extend over the entire area and act as a confining layer between Units 1 and 2. The base of Unit 1 (erosional surface) dips gently (0.5%) to the east and overlays Unit 2 . Unit 2—(Early Pliocene-Middle Pleistocene; from a depth of 33 m). Fluvio-lacustrine facies usually referred to as the “Villafranchian”, consisting of fine-grained sediments (sand, silt and clay with interbedded gravel) divided into several sedimentary bodies. Other portions of the plain highlight the heteropic relationships with sediments originally deposited in a shallow marine envi- ronment and traditionally defined as Sabbie di Asti and/or Argille di Lugagnan o. They are mainly composed of fossiliferous sand-clay layers with subordinate fine gravel and coarse, sandy marine layers, or by quartz- micaceous sands with no evidence of fossils. The top of Unit 2 has been eroded away and covered by the lacus- trine facies and alluvial deposits of Unit 1. 2.4. Hydrodynamic Characterization of the Aquifers In order to numerically model groundwater flow, an ac- curate characterization of the site’s hydrogeological pro- perties, groundwater flow direction and hydraulic gradi- ent (the potentiometric surface), and the hydrodynamic properties (transmissivity, hydraulic conductivity, stor- age coefficient) is required. The unconfined aquifer that extends over the entire plain, including the study site location, is hydraulically connected to the main surface water drainage network (i.e. Chis ola River and Po River). The potentiometric surface, 2 m below ground level, shows a W-to-E gradient of 0.2%. The saturated thick- ness of the unconfined aquifer at the site is about 26 m. In order to characterize the hydrogeological properties of the aquifer in Unit 1, an appropriate step drawdown test was initially performed on a 30 m deep well located less than 1.5 km from the site. The test data yielded a transmissivity (T1) of 7.3 × 10⁻³ m 2/s. The hydraulic conductivity (K1 = 3.65 × 10⁻⁴ m/s) was calculated as- suming an average saturated thickness of 20 m. On the basis of a constant-rate pumping test, the storativity (S1) was assumed to be 0.20. A confined aquifer system occurs in Unit 2. The avail- able subsurface data indicate that the direction of groundwater flow and the po tentiometric gradient (0.2%) in the Unit 2 aquifer system are similar to those in the unconfined aquifer of Unit 1. In the productive well the potentiometric surface of the confined aquifer stabilizes 31 m above the top of Unit 2, just 2 m below the ground’s surface, which is roughly equivalent to the value measured in the overlaying Unit 1. The hydraulic transmissivity (T2) of the Unit 2 aquifer system (7.52 × 10⁻³ m2/s) was determined by means of a specific step- drawdown test in the studied well. The storativity (S2) was calculated as 10.6 × 10⁻⁴. 2.5. Modelling Study of the Aquifers The modelling study was performed using the finite- element FEFLOW® package developed by Diersch [51]. A conceptual model with three layers was simulated us- ing physical properties appropriate to the hydrogeology of the formation. Layer 1 represented the unconfined aquifer in Unit 1, Layer 2 corresponded to the 5 m thick impermeable clay layer at the base of this aquifer and Layer 3 represented the confined aquifer system of Unit 2. The distribution of the different layers in the model area was determined from topographic elevation data for the different geological units as listed in the regional au- thority database [49]. A plan view of the area covered by the computational grid (about 27.82 million m2; 14,133 elements and 9800 nodes) is shown in Figure 3. The ground surface ranges from 253 m at the NW mesh vertex boundary to 240 m at the SE vertex. The horizontal dimensions of the model grid are 5238 m (SW-NE) and 4334 m (NW-SE). The average mesh spacing in the modelling domain is 70 m, which was refined to 8 m in the central area close to the well to provide enhanced estimation of potentiometric disturbed surface and the wellhead protection area iso- chrones. The north and south boundaries are set as no- flow boundaries. The east and west boundaries are con- stant-head boundaries (Dirichlet conditions). These lev- els were determined by initially calibrating the model against the steady-state groundwater heads obtained from a potentiometric surface map [50] and a specific survey of the area. An assumption of the model was that the system was closed to fluid flow at bottom (Layer 3 is set 200 m thick). The system has only recharge from rainfall and the ground surface is set as a prescribed flux bound- ary recharged by rainfall. An infiltration rate of 5.7 × 10⁻⁴ m/day is used in the model, which is equivalent to 25% [52] of the annual rainfall of 834 mm. The simulations were run assuming steady-state condi- tions for groundwater flow. The withdrawal rate on the tested well (12 L/s) corresponds to the abstraction peak conditions. In reality, such conditions never actually oc- cur because of variable (transient) water demand and the presence of a groundwater storage tank. Therefore, the actual impacts to the aquifer in terms of potentiometric surface changes due to well pumping will be less than Copyright © 2012 SciRes. JWARP 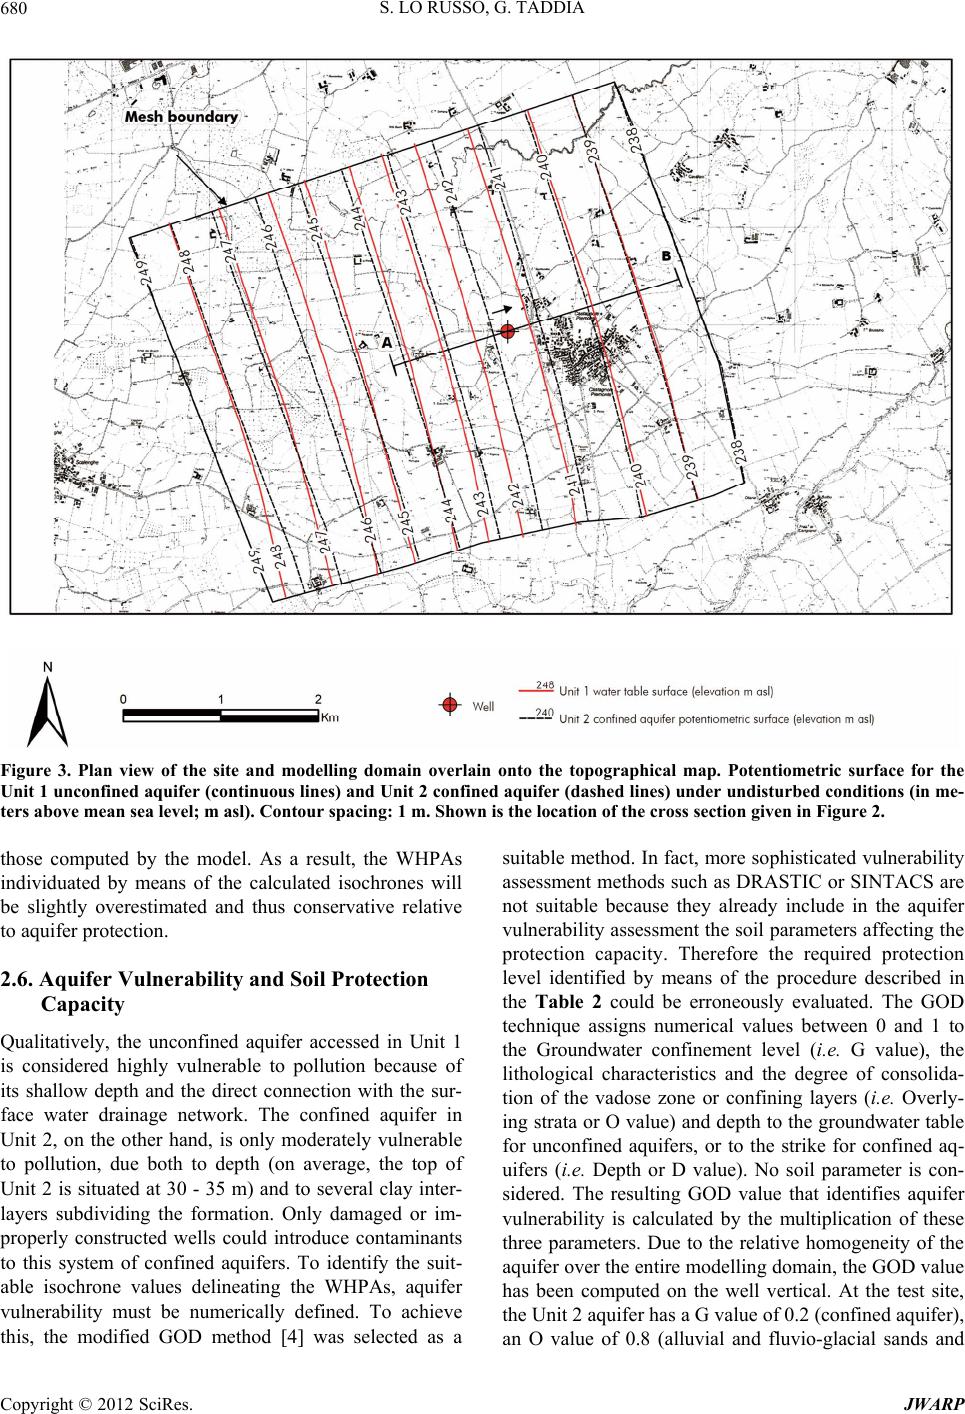 S. LO RUSSO, G. TADDIA 680 Figure 3. Plan view of the site and modelling domain overlain onto the topographical map. Potentiometric surface for the Unit 1 unconfined aquifer (continuous line s) and Unit 2 confined aquifer (dashed line s) under undisturbed conditions (in me- ters above mean sea level; m asl). Contour spacing: 1 m. Shown is the location of the cross section given in Figure 2. those computed by the model. As a result, the WHPAs individuated by means of the calculated isochrones will be slightly overestimated and thus conservative relative to aquifer protection. 2.6. Aquifer Vulnerability and Soil Protection Capacity Qualitatively, the unconfined aquifer accessed in Unit 1 is considered highly vulnerable to pollution because of its shallow depth and the direct connection with the sur- face water drainage network. The confined aquifer in Unit 2, on the other hand, is only moderately vulnerable to pollution, due both to depth (on average, the top of Unit 2 is situated at 30 - 35 m) and to several clay inter- layers subdividing the formation. Only damaged or im- properly constructed wells could introduce contaminants to this system of confined aquifers. To identify the suit- able isochrone values delineating the WHPAs, aquifer vulnerability must be numerically defined. To achieve this, the modified GOD method [4] was selected as a suitable method. In fact, more sophisticated vulnerability assessment methods such as DRASTIC or SINTACS are not suitable because they already include in the aquifer vulnerability assessment the soil parameters affecting the protection capacity. Therefore the required protection level identified by means of the procedure described in the Table 2 could be erroneously evaluated. The GOD technique assigns numerical values between 0 and 1 to the Groundwater confinement level (i.e. G value), the lithological characteristics and the degree of consolida- tion of the vadose zone or confining layers (i.e. Overly- ing strata or O value) and depth to the groundwater table for unconfined aquifers, or to the strike for confined aq- uifers (i.e. Depth or D value). No soil parameter is con- sidered. The resulting GOD value that identifies aquifer vulnerability is calculated by the multiplication of these three parameters. Due to the relative homogeneity of the aquifer over the entire modelling domain, the GOD value has been computed on the well vertical. At the test site, the Unit 2 aquifer has a G value of 0.2 (confined aquifer), an O value of 0.8 (alluvial and fluvio-glacial sands and Copyright © 2012 SciRes. JWARP 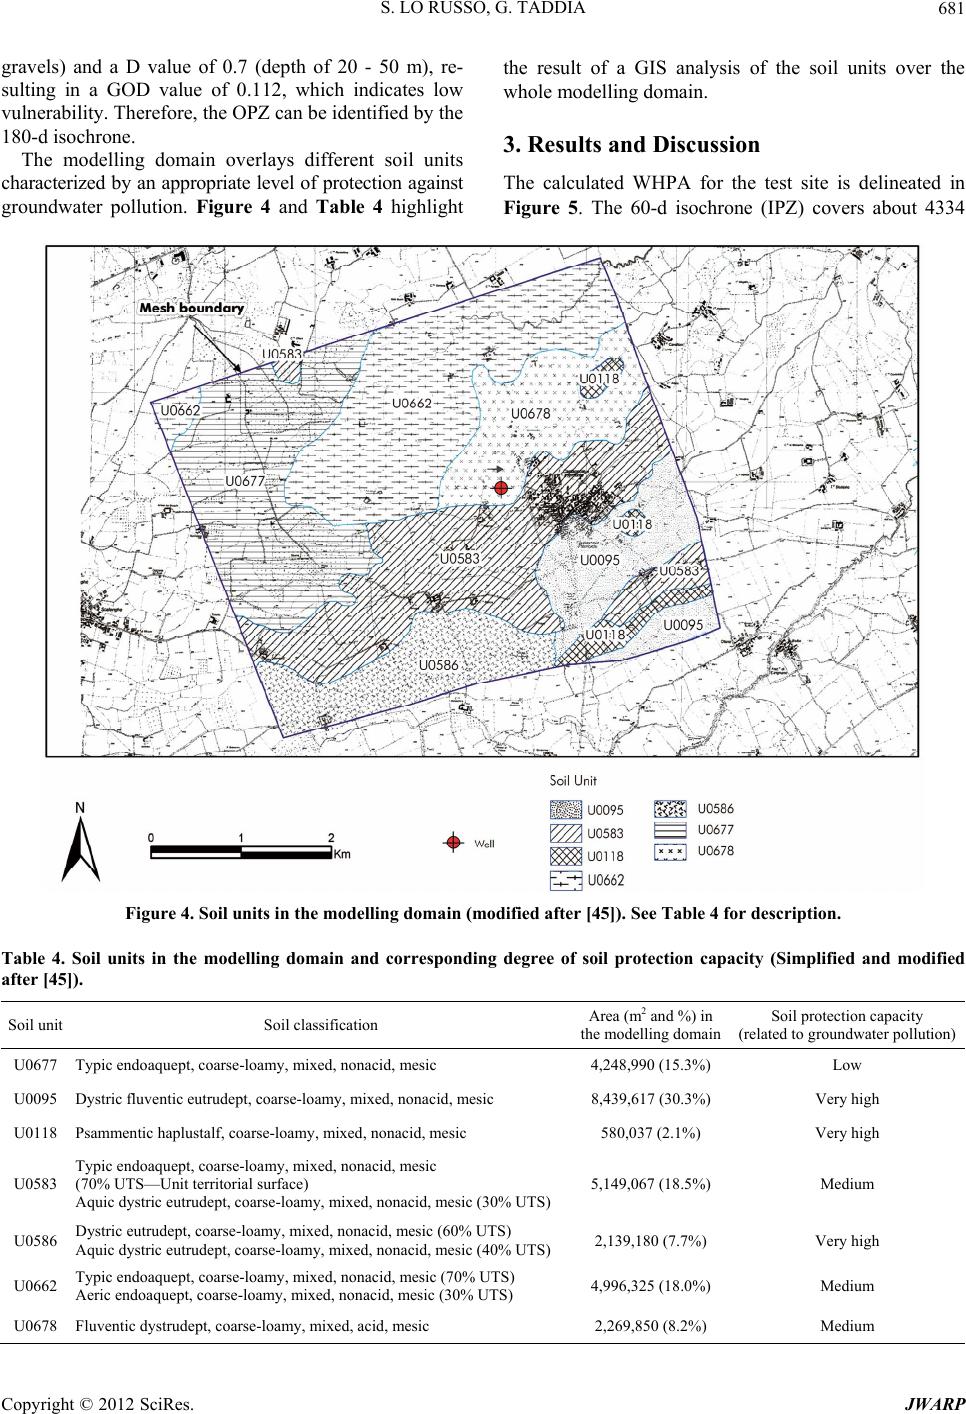 S. LO RUSSO, G. TADDIA 681 gravels) and a D value of 0.7 (depth of 20 - 50 m), re- sulting in a GOD value of 0.112, which indicates low vulnerability. Therefor e, th e OPZ can be identified by the 180-d isochrone. The modelling domain overlays different soil units characterized by an appropriate level of protection against groundwater pollution. Figure 4 and Table 4 highlight the result of a GIS analysis of the soil units over the whole modelling domain. 3. Results and Discussion The calculated WHPA for the test site is delineated in Figure 5. The 60-d isochrone (IPZ) covers about 4334 Figure 4. Soil units in the modelling domain (modified after [45]). See Table 4 for description. Table 4. Soil units in the modelling domain and corresponding degree of soil protection capacity (Simplified and modified after [45]). Soil unit Soil classification Area (m2 and %) in the modelling domainSoil protection capacity (related to gro undwater pollution) U0677 Typic endoaquept, coarse-loamy, mixed, nonacid, mesic 4,248,990 (15.3% ) Low U0095 Dystric fluventic eutrudept, coarse-loamy, mixed, nonacid, mesic 8,439,617 (30.3%) Very high U0118 Psammentic haplustalf, coarse-loamy, mixed, nonacid, mesic 580,037 (2.1%) Very high U0583 Typic endoaquept, coarse-loamy, mixed, nonacid, mesic (70% UTS—Unit territorial surface) Aquic dystric eutrudept, coarse-loamy, mixed, nonacid, mesic (30% UTS) 5,149,067 (18. 5%) Medium U0586 Dystric eutru d e p t , coarse-loam y, m ixed, nonacid, mesic (60% UTS) Aquic dystric eutrudept, coarse-loamy, mixed, nonacid, mesic (40% UTS) 2,139,180 (7.7%) Very high U0662 Typic endoaquept, coarse-loamy, mixed, nonacid, mesic (70% UTS) Aeric endoaquept, coarse-loamy, mixed, nonacid, mesic (30% UTS) 4,996,325 (18. 0%) Medium U0678 Fluventic dystrudept, coars e-loamy, mixed, acid, mesic 2,269,850 (8.2%) Medium Copyright © 2012 SciRes. JWARP  S. LO RUSSO, G. TADDIA 682 Figure 5. Wellhead protection areas identified by means of isochrones. m2, while the 180-d isochrone (OPZ) covers 11,734 m2. Considering both the aquifer vulnerability (low) and the medium soil protection capacity of the soil unit overlaid by the WHPA (U0678), the corresponding level of pro- tection was calculated as Level 3 (Table 2). Given this level of protection, certain restrictions on agricultural practices must be observed (Table 3). The calculated WHPA includes a minor road and therefore additional precautionary measures should be developed in order to prevent co ntaminant migratio n from the surface due both to accidental spills and infiltration of dust and water run- ning off the road surface that might carry contaminants (e.g., petroleum hydrocarbons, metals). Safety measures applied along the motorway would include: a) Using catchments and channelling to collect rain water that contacts the road surface, or any other fluid that is accidentally released; b) Transport of collected fluids to monitoring basins and, after verifying the absence of contamination, send- ing those liquids for final disposal (water drains or streams). If contaminants are found to be present at con- centrations exceeding established criteria, standards or benchmarks, the fluids will be sent to treatment plants; c) The final destination of clean water should be out- side, and downgradient, of the WHPA. The specific measures that are instituted to safeguard the WHPA should be managed by the regional environ- mental authority in cooperation with the farmers, the water well managing company and the road maintenance company. 4. Conclusions An effective and economically-sustainable land man- agement strategy to protect subsurface water resources from anthropogenic po llution must combine gen eral saf e- guards applied to the whole aquifer recharge area with specific local land use restrictio ns in the proximity of the abstraction point (i.e. WHPAs). The first component, i.e. general protection strategies, can be derived through an extensive, broad-scale investigation, taking into account aquifer vulnerability, while data for the second compo- nent can be obtained using site-specific investigations within a narrowly-defined area proximal to the abstract- tion point. The importance of considering these two components in an integrated fashion cannot be under- stated. In particular, the selection of TOT for WHPA delineation is critically linked to the anticipated vulner- ability of the aquifer in question. This study has highlighted a technical approach de- veloped in the Piemonte region, and designed to protect drinking water wells. An important aspect of this ap- proach was the integration of broad-scale aquifer vul- nerability assessment with localized WHPA delineation. Copyright © 2012 SciRes. JWARP  S. LO RUSSO, G. TADDIA 683 The method has been successfully tested on a community drinking water well and is both affordable and effective. However, for this method to be accepted for broad ap- plication, additio nal refinement is needed in certain areas. In particular, improved specifications should be provided to allow the user to more confidently select an appropri- ate aquifer vulnerability assessment method. The present version provides little guidance, leaving the selection to professional subjectivity and experience. However, cur- rent regulations combine the vulnerability level with soil protection capacity, thus discouraging the use of tech- niques that already compartmentalize soil parameters in the vulnerability assessment (e.g. DRASTIC and SIN- TACS). Given this constraint, only methods that consider aquifer parameters (i.e. GOD) seem suitable to evaluate vulnerability. Future iterations should simplify the pro- cedure to individuate the necessary level of protection within the WHPA if soil protection capacity is directly included in the aquifer vuln erability assessment. 5. Acknowledgements The authors thank the environmental authority of the Piemonte region for their assistance during the field sur- vey, the modelling, and for allowing publication of the data. This study was partially su pported by the Piemonte regional Government and by SMAT S.p.a. integrated water services company. REFERENCES [1] A. A. Fadlelmawla and M. A. Dawoud, “An Approach for Delineating Drinking Water Wellhead Protection Areas at the Nile Delta, Egypt,” Journal of Environmental Mana- gement, Vol. 79, No. 2, 2006, pp. 140-149. doi:10.1016/j.jenvman.2005.06.001 [2] S. Y. Feng, Z. L. Huo, S. Z. Kang, Z. J. Tang and F. X. Wang, “Groundwater Simulation Using a Numerical Mo- del under Different Water Resources Management Sce- narios in an Arid Region of China,” Environmental Earth Sciences, Vol. 62, No. 5, 2011, pp. 961-971. [3] S. Foster, J. Chilton, M. Moench, F. Cardy and M. Schiffler, “Groundwater in Rural Development: Facing the Challenges of Supply and Resource Sustainability,” World Bank Technical Paper 463, Washington DC, 2000. [4] S. Foster, R. Hirata, D. Gomes, M. D’Elia and M. Paris, “Groundwater Quality Protection,” World Bank, Washing- ton DC, 2002, 103 p. doi:10.1596/0-8213-4951-1 [5] X. H. Wang, “Conceptual Design of a System for Select- ing Appropriate Groundwater Models in Ground-water Protection Programs,” Environmental Management, Vol. 21, No. 4, 1997, pp. 607-615. doi:10.1007/s002679900053 [6] W. Zhou, B. F. Beck, A. J. Pettit and B. J. Stephenson, “A Groundwater Tracing Investigation as an Aid of Lo- cating Groundwater Monitoring Stations on the Mitchell Plain of Southern Indiana,” Environmental Geology, Vol. 41, No. 7, 2002, pp. 842-851. [7] M. Albinet and J. Margat, “Cartographie de la Vulnerabilitè a la Pollution des Nappes d’eau Souterraine,” Bulletin BRGM 2nd Series, Vol. 3, No. 4, 1970, pp. 13-22. [8] A. Haertle, “Method of Working and Employment of EDP during the Preparation of Groundwater Vulnearbility Maps,” International Association of Hydrogeological Sci- ences, 142, 1983, pp. 1073-1085. [9] L. Aller, T. Bennett, J. H. Lehr, R. J. Petty and G. Hackett, “DRASTIC: A Standardized System for Evaluating Ground- water Pollution Potential Using Hydrogeologic Settings,” Environmental Protection Agency Report 600/2-87-035, Washington DC, 1987. [10] S. Foster and R. Hirata, “Groundwater Pollution Risk As- sessment: A Methodology Using Available Data,” WHO- PAHO/HPE-CEPIS Technical Manual, Lima, 1988. [11] NRC (National Research Council), “Groundwater Vulner- ability Assessment: Contamination Potential under Con- ditions of Uncertainty,” National Academy Press, Wash- ington DC, 1993. [12] J. Vrba and A. Zaporozec, “Guidebook on Mapping Groundwater Vulnerability,” H. Heise, Hannover, 1994. [13] M. Civita, “Le carte della vulnerabilità degli acquiferi all’inquinamento,” Teoria & Pratica, Bologna, 1994. [14] S. Foster and C. Skinner, “Groundwater Protection: The Science and Practice of Land Surface Zoning,” Interna- tional Ass oc ia tio n of Hy dro ge olo gi cal Sci en ces , Vol. 225, 1995, pp. 471-482. [15] T. G. Fritch, C. L. McKnight and J. C. Yelderman, “An Aquifer Vulnerability Assessment of the Paluxy Aquifer, Central Texas, USA, Using GIS and a Modified DRAS- TIC Approach,” Environmental Management, Vol. 25, No. 3, 2000, pp. 337-345. doi:10.1007/s002679910026 [16] J. P. Dash, A. Sarangi and D. K. Singh, “Spatial Variabil- ity of Groundwater Depth and Quality Parameters in the National Capital Territory of Delhi,” Environmental Man- agement, Vol. 45, No. 3, 2010, pp. 640-650. doi:10.1007/s00267-010-9436-z [17] M. V. Civita, “The Combined Approach When Assessing and Mapping Groundwater Vulnerability to Contamina- tion,” Journal of Water Resource and Protection, Vol. 2, No. 1, 2010, pp. 14-28. doi:10.4236/jwarp.2010.21003 [18] D. Ducci, “Aquifer Vulnerability Assessment Methods: The Non-Independence of Parameters Problem,” Journal of Water Resource and Protection, Vol. 2, No. 4, 2010, pp. 298-308. doi:10.4236/jwarp.2010.24034 [19] M. Lourdes Lima, K. Zelaya, H. Massone, “Groundwater Vulnerability Assessment Combining the Drastic and Dyna-Clue Model in the Argentine Pampas,” Environ- mental Management, Vol. 47, No. 5, 2011, pp. 828-839. doi:10.1007/s00267-011-9652-1 [20] M. Alraggad, S. Al-Saleh, H. Al-Amoush, A. Jasem and D. Isied, “Vulnerability of Groundwater System in Cen- tral Jordan Valley/Pollution Indicators and Decontamina- tion Process,” Journal of Water Resource and Protection, Vol. 4, No. 3, 2012, pp. 133-139. doi:10.4236/jwarp.2012.43016 [21] N. Doerfliger and F. Zwahlen, “EPIK: A New Method for Copyright © 2012 SciRes. JWARP  S. LO RUSSO, G. TADDIA 684 Outlining of Protection Areas: A Water Vulnerability As- sessment in Karst Environment,” Proceedings of 5th In- ternational Symposium on Karst Waters and Environ- mental Impacts, Antalya, 10-20 September 1995, pp. 117- 123. [22] M. Civita and M. De Maio, “SINTACS R5 a New Para- metric System for the Assessment and Automatic Map- ping of Groundwater Vulnerability to Contamination,” Pitagora Editrice, Bologna, 2000. [23] F. Barry, D. Ophori, J. Hoffman and R. Canace, “Ground- water Flow and Capture Zone Analysis of the Central Passaic River Basin,” Environmental Geology, Vol. 56, No. 8, 2009, pp. 1593-1603. [24] J. Y. S. Hodgson, J. R. Stoll and R. C. Stoll, “Evaluating the Effectiveness of a Fixed Wellhead Protection Area De- lineation: Regional Case Study,” Journal of the American Water Resources Association, Vol. 42, No. 2, 2006, pp. 409-423. doi:10.1111/j.1752-1688.2006.tb03847.x [25] L. Galleani, B. Vigna, C. Banzato and S. Lo Russo, “Validation of a Vulnerability Estimator for Spring Pro- tection Areas: The VESPA index,” Journal of Hydrology, Vol. 396, No. 3-4, 2011, pp. 233-245. doi:10.1016/j.jhydrol.2010.11.012 [26] S. Lo Russo and G. Taddia, “Groundwater in the Urban Environment: Management Needs and Planning Strate- gies,” American Journal of Environmental Sciences, Vol. 5, No. 4, 2009, pp. 494-500. doi:10.3844/ajessp.2009.494.500 [27] W. A. Harman, C. J. Allan and R. D. Forsythe, “Assess- ment of Potential Groundwater Contamination Sources in a Wellhead Protection Area,” Journal of Environmental Management, Vol. 62, No. 3, 2001, pp. 271-282. doi:10.1006/jema.2001.0436 [28] M. S. Miller, P. Chudek and S. Babcock, “A Comparison of Wellhead Protection Area Delineation Methods for Public Drinking Water Systems in Whatcom County, Washington,” Journal of Environmental Health, Vol. 66, No. 2, 2003, pp. 17-24. [29] T. W. Raynes, K. R. Bradbury and M. A. Muldoon, “De- lineation of Capture Zones for Municipal Wells in Frac- tured Dolomite, Sturgeon Bay, Wisconsin, USA,” Hydro- geology Journal, Vol. 9, No. 5, 2001, pp. 432-450. doi:10.1007/s100400100154 [30] U. S. EPA, “Delineation of Wellhead Protection Areas in Fractured Rocks,” US Environmental Protection Agency, Office of Water, Washington DC, 1991. [31] D. Paradis, R. Martel, G. Karanta, R. Lefebvre, Y. Michaud, R. Therrien and M. Nastev, “Comparative Study of Me- thods for WHPA Delineation,” Ground Water, Vol. 45, No. 2, 2007, pp. 158-167. doi:10.1111/j.1745-6584.2006.00271.x [32] S. P. Esling, J. E. Keller and K. J. Miller, “Reducing Capture Zone Uncertainty with a Systematic Sensitivity Analysis,” Ground Water, Vol. 46, No. 4, 2008, pp. 570- 578. doi:10.1111/j.1745-6584.2008.00438.x [33] Y. Mogheir and G. Tarazi, “Comparative Identification of Wellhead Protection Areas for Municipal Supply Wells in Gaza,” Journal of Water Resource and Protection, Vol. 2, No. 2, 2010, pp. 105-114. doi:10.4236/jwarp.2010.22012 [34] S. Lo Russo, A. Fiorucci and B. Vigna, “Groundwater Dynamics and Quality Assessment in an Agricultural Area,” American Journal of Environmental Sciences, Vol. 7, No. 4, 2011, pp. 354-361. doi:10.3844/ajessp.2011.354.361 [35] EU, “Council Directive 80/778/EEC of 15 July 1980 Relating to the Quality of Water Intended for Human Consumption,” 1980. http://eur-lex.europa.eu/LexUriServ/site/en/consleg/1980/ L/01980L0778-19950101-en.pdf [36] Repubblica Italiana, “Attuazione Della Direttiva No. 80/ 778/CEE Concernente la Qualità Delle Acque Destinate al Consumo Umano ai Sensi Dell’Art. 15 Della Legge 16 Aprile 1987, No. 183. Gazzetta Ufficiale No. 152 del 30 Giugno 1988—Supplemento Ordinario,” 1988. http://www.atobrenta.it/pdf/DPR_236_88.pdf [37] EU, “Council Directive 91/271/EEC of 21 May 1991 Concerning Urban Waste-Water Treatment,” 1991. http://eur-lex.europa.eu/LexUriServ/LexUriServ.do?uri= CELEX:31991L0271:EN:HTML [38] EU, “Council Directive 91/676/EEC of 12 December 1991 Concerning the Protection of Waters against Pollu- tion Caused by Nitrates from Agricultural Sources,” 1991. [39] EU, “Directive 2000/60/EC of the European Parliament and of the Council of 23 October 2000 Establishing a Framework for Community Action in the Field of Water Policy,” 2000. http://eur-lex.europa.eu/LexUriServ/LexUriServ.do?uri= OJ:L:2000:327:0001:0072:EN:PDF [40] EU, “Directive 2006/118/EC of the European Parliament and of the Council of 12 December 2006 on the Protec- tion of Groundwater against Pollution and Deterioration,” 2006. http://eur-lex.europa.eu/LexUriServ/LexUriServ.do?uri= OJ:L:2006:372:0019:0031:EN:PDF [41] Repubblica Italiana, “Disposizioni Sulla Tutela Delle Acque Dall’Inquinamento e Recepimento Della Direttiva 91/271/CEE Concernente il Trattamento Delle Acque Reflue Urbane e Della Direttiva 91/676/ CEE Relativa Alla Protezione Delle Acque Dall’Inquinamento Provocato dai Nitrati Provenienti da Fonti Agricole,” 1999. http://www.camera.it/parlam/leggi/deleghe/99152dl.htm [42] Repubblica Italiana, “Norme in Materia Ambientale,” 2006. http://www.parlamento.it/leggi/deleghe/06152dl.htm [43] Repubblica Italiana, “Attuazione Della Direttiva 2006/ 118/CE, Relativa Alla Protezione Elle Acque Sotterranee Dall’Inquinamento e dal Deterioramento,” 2009. http://www.camera.it/parlam/leggi/deleghe/testi/09030dl. htm. (in Italian). [44] Regione Piemonte, “Disciplina Delle Aree di Salvaguardia Delle Acque Destinate al Consumo Umano,” 2006. http://www.regione.piemonte.it/acqua/cons_umano.htm [45] IPLA (Istituto per le Piante da Legno e l’ambiente), “Soil map of Piemonte region,” 2006. http://www.regione.piemonte.it/agri/suoli_terreni/suoli1_ 50/carta_suoli/gedeone.do [46] EU, “Council Regulation (EEC) 2092/91 of 24 June 1991 on Organic Production of Agricultural Products and Indi- Copyright © 2012 SciRes. JWARP  S. LO RUSSO, G. TADDIA Copyright © 2012 SciRes. JWARP 685 cations Referring thereto on Agricultural Products and Foodstuffs,” 1991. http://eur-lex.europa.eu/LexUriServ/LexUriServ.do?uri= CELEX:31991L0676:EN:HTML [47] A. W. Bally and S. Snelson, “Realms and subsidence,” In: A. A. Miall, Ed., Facts and Princ iples of World Petroleum Occurrence, Canadian Society of Petroleum Geologists Memoir 6, Calgary, 1980, pp. 9-94. [48] F. Carraro and A. Moscariello, “Tefrocronologia,” In: F. Carraro, Ed., Revisione del Villafranchiano nell’area-tipo di Villafranca d’Asti, AIQUA-CNR, Rome, 1994, pp. 126-127. [49] Regione Piemonte, “Water Protection Plan. D. C. R. No. 117-10731,” Turin, 2007. http://www.regione.piemonte.it/acqua/pianoditutela/piano ditutela.htm [50] M. Civita, S. Lo Russo and B. Vigna, “Hydrogeological Sketch Map of Piemonte (NW Italy) 1:250.000,” Map Presented at the 32nd International Geological Congress (32IGC), Florence, 21-28 August 2004. [51] H. J. G. Diersch, “Reference Manual for FEFLOW®,” WASY GmbH, Berlin, 2005. http://www.feflow.info/ [52] S. Lo Russo, L. Zavattaro, M. Acutis and G. M. Zuppi, “Chloride Profile Technique to Estimate Water Move- ment through Unsaturated Zone in a Cropped Area in Subhumid Climate (Po Valley-NW Italy),” Journal of Hydrology, Vol. 270, No. 1-2, 2003, pp. 65-74. doi:10.1016/S0022-1694(02)00278-0
|