 Journal of Water Resource and Protection, 2012, 4, 576-589 http://dx.doi.org/10.4236/jwarp.2012.48067 Published Online August 2012 (http://www.SciRP.org/journal/jwarp) Impact of Land Use and Aquatic Plants on the Water Quality of the Sub-Tropical Alpine Wetlands in India: A Case Study Using Neuro-Genetic Models Malabika Biswas Roy1, Pankaj K. Roy2, Asis Mazumdar2, Mrinmoy Majumder2, Nihar R. Samal3 1Gandhi Centenary B. T. College, Habra, West Bengal State University, West Bengal, India 2School of Water Resources Engineering, Jadavpur University, Kolkata, India 3Department of Civil Engineering, National Institute of Technology, Durgapur, India Email: malabikabiswasroy@gmail.com, pk1roy@yahoo.co.in Received April 30, 2012; revised June 1, 2012; accepted June 12, 2012 ABSTRACT The suspended and dissolved waste in the incoming storm water of wetlands largely depends on the adjacent land use which can influence the quality of the water body. The micro- and macro-floral population of a wetland can absorb, convert, transform and release different organic or inorganic elements, which can also change or impact the overall quality of the wetland water. The present study investigates the influence of the land use and the plant species in the waterbed on the water quality of a high-altitude, sub-tropical wetland in India. The estimation capabilities of neuro-genetic models were utilized to identify the inherent relationships between the Biochemical Oxygen Demand (BOD), Dissolved Oxygen (DO), chlorine (Cl) and Chemical Oxygen Demand (COD) with the land use and wetland zoology. A thematic map of the quality parameters was also generated based on the identified relationship to observe the influence that the morphological and biological diversity in and around the study area has on the quality parameters of the wetland. According to the results, the BOD, COD and Cl were found to vary with differences in land use and the presence of different plant species, whereas the DO was found to be largely invariant with changes in these parameters. The reasons may be contributed to the impact of uncontrolled eco-tourism activities around the wetland. Keywords: Wetland; Neural Network; Water Quality; Land Use; Aquatic Plants 1. Introduction Nowadays, maintaining the water quality of freshwater wetlands has become a significant issue because, for this kind of wetland, municipal and industrial wastewater discharge constitutes a constant polluting source, whereas surface run-off is a seasonal phenomenon [1]. For this reason, the water environment quality issue is a subject of ongoing concerned for the development of an econ- omy in any country [2]. Naturally, a well-designed wa- ter-quality monitoring plan should preserve scarce re- sources by minimizing the redundancy of nearby moni- toring stations and the plethora of possible variables monitored, while at the same time maximizing the in- formation content of the collected data [3]. However, it is also true that to construct a well-designed water-quality monitoring plan, detailed testing of the water quality is essential for any freshwater wetland. In this paper, a multivariate statistical characterization of water quality of a tropical, freshwater lake in eastern India is dis- cussed. Some studies are available that deal with multiple pur- poses, including water quality monitoring. The useful- ness of multivariate statistical techniques demonstrated [4] for the evaluation and interpretation of large complex water-quality data sets and the apportionment of pollu- tion sources/factors with the intention of obtaining better information about the water quality and the design of the monitoring network for the effective management of wa- ter resources. A data set of 10 years analyzed [5] surface water quality data pertaining to a polluted river using partial least squares (PLS) regression models. In their study, both the unfold-PLS and N-PLS (tri-PLS and quadri-PLS) models were applied to the multivariate, multi-way data array with the intention of assessing and comparing their predictive capabilities for the biochemi- cal oxygen demand (BOD) of a river water in terms of their relative mean squared errors of cross-validation, prediction and variance captured. However, the principal component analysis applied [6] 16 water-quality pa- rameters that had been collected monthly over a 6-year period in an effort to describe the spatial dependence and inherent variations of water quality patterns in the Flor- C opyright © 2012 SciRes. JWARP  M. B. ROY ET AL. 577 ida Bay-Whitewater Bay area. Moreover, Researcher [7] tried to establish how the last years of artificial manage- ment have affected the ecosystem of the Tablas de Daimiel National Park, a Spanish continental wetland. To carry out this study he analyzed the water physico- chemical characteristics over the period 1995-1997, and using different statistical techniques, these data were compared with those obtained from a survey conducted from 1974-1975, which represented the original situation. However, geochemical characteristics and the apparent ages of sampled groundwater were used [8] to determine which of the two regionally extensive bedrock aquifers, the lower bedrock aquifer or the upper bedrock aquifer, is a more likely source of water discharging into the springs in the Nine Springs watershed, which is located in south-central Dane County, WI. Even, the potential of systematic and formalized interdisciplinary research concepts and methods for sustainable water and wetland policy and management were reviewed and examined [9], as advocated by the recently adopted European Water Framework Directive. However, the multivariate data analysis applied [10] large water quality data sets on the Buyuk Menderes River Basin to analyze the surface wa- ter contamination and establish correlations between wa- ter quality parameters. Later, the water quality was ex- amined [11] of the Tahtali River Basin in Turkey. In this study, multivariate statistical methods, including factor, principal component and cluster analyses, were applied to surface water quality data sets obtained from the Tahtali River Basin. The factor and principal components analyses results revealed that the surface water quality was mainly controlled by agricultural uses and domestic discharges. The cluster analysis generated two clusters. Moreover, a strategy was presented [3] to reduce the measured parameters, locations, and frequency without compromising the quality of the monitoring program. Even so, the surface water quality data sets were ana- lyzed [2] to obtain from the Xiangjiang watershed, which were generated over 7 years (1994-2000) and monitored 12 parameters at 34 different profiles with the help of multivariate statistical methods, including factor, princi- pal component and cluster analysis. The multivariate statistical methods, i.e., cluster analysis (CA) and dis- criminate analysis (DA) were used [12] to assess tempo- ral and spatial variations in the water quality of the wa- tercourses in the Northwestern New Territories of Hong Kong over a period of five years (2000-2004) using 23 parameters at 23 different sites. The principal component analysis (PCA) was used [13] to reduce the data dimen- sionality from the 18 original physico-chemical and microbiological parameters which determined in drinking water samples to six principal components that explained about 83% of the data variability to analyze 126 drink- ing water samples taken from a city water network in North Moravia, the Czech Republic, over the course of six months, according to a monitoring plan. In addition, some samples were collected [14] to analyze the pa- rameters such as Temperature, pH, DO, Conductivity, Turbidity, Total Suspended Solids (TSS), Nitrate, Phos- phate, COD and BOD from ten sampling locations dis- tributed along the Juru Estuary in the Penang state of Malaysia to analyze the water quality data with help of CA and descriptive statistics. However, the environ- mental economics for wetland construction, restoration and preservation, and the net ecosystem services values of constructed, human-interfered and natural wetlands explored [15] as a comparative study for the case of a typical human-interfered wetland in Wenzhou, China. Nonetheless, Turner [16] emphasized an integrated wet- land research framework, which suggests that a combina- tion of economic valuation, integrated modeling, stake- holder analysis, and multi-criteria evolution can provide complementary insights into sustainable and welfare- optimizing wetland management and policy. Furthermore, Ouyan [17] applied principal component analysis (PCA) and principal factor analysis (PFA) techniques to evalu- ate the effectiveness of the surface water quality-moni- toring network in a river, where the variables are evalu- ated at the monitoring stations. The objective of his study was to identify the monitoring stations that are important in assessing the annual variations of river water quality. Detenbeck [18] even developed a method that evaluated the cumulative effect of wetland mosaics on the water quality, which was applied to 33 lake watersheds in the seven-county region surrounding Minneapolis-St. Paul, Minnesota. Wayland [19] compared biogeochemical data from three synoptic sampling events, which represents the temporal variability of base flow chemistry and land use, using R-mode factor analysis. At the same time, a meta-analysis was described [20] to estimate relation- ships between the non-use components of willingness to pay (WTP) for surface water quality improvements and a combination of resource, context, and study design at- tributes, where these attributes include estimated use values for identical improvements. The relationships between water quality and six different land uses were investigated [21] to offer practical guidance in the plan- ning of future urban developments. In terms of safe- guarding the water quality, high-density residential de- velopment, which results in a smaller footprint than sparse development; should be the preferred option ac- cording to his study. The R-mode factor analysis and Q-mode cluster analysis were applied [22] to a set of 1349 groundwater analyses to determine the factors con- trolling the groundwater composition and the main re- sulting water types. The PCA was used [23] to assess the degree of contamination and spatial distribution of heavy metals, such as Ag, As, Cd, Co, Cr, Cu, Hg, Ni, Pb, Sr, Copyright © 2012 SciRes. JWARP 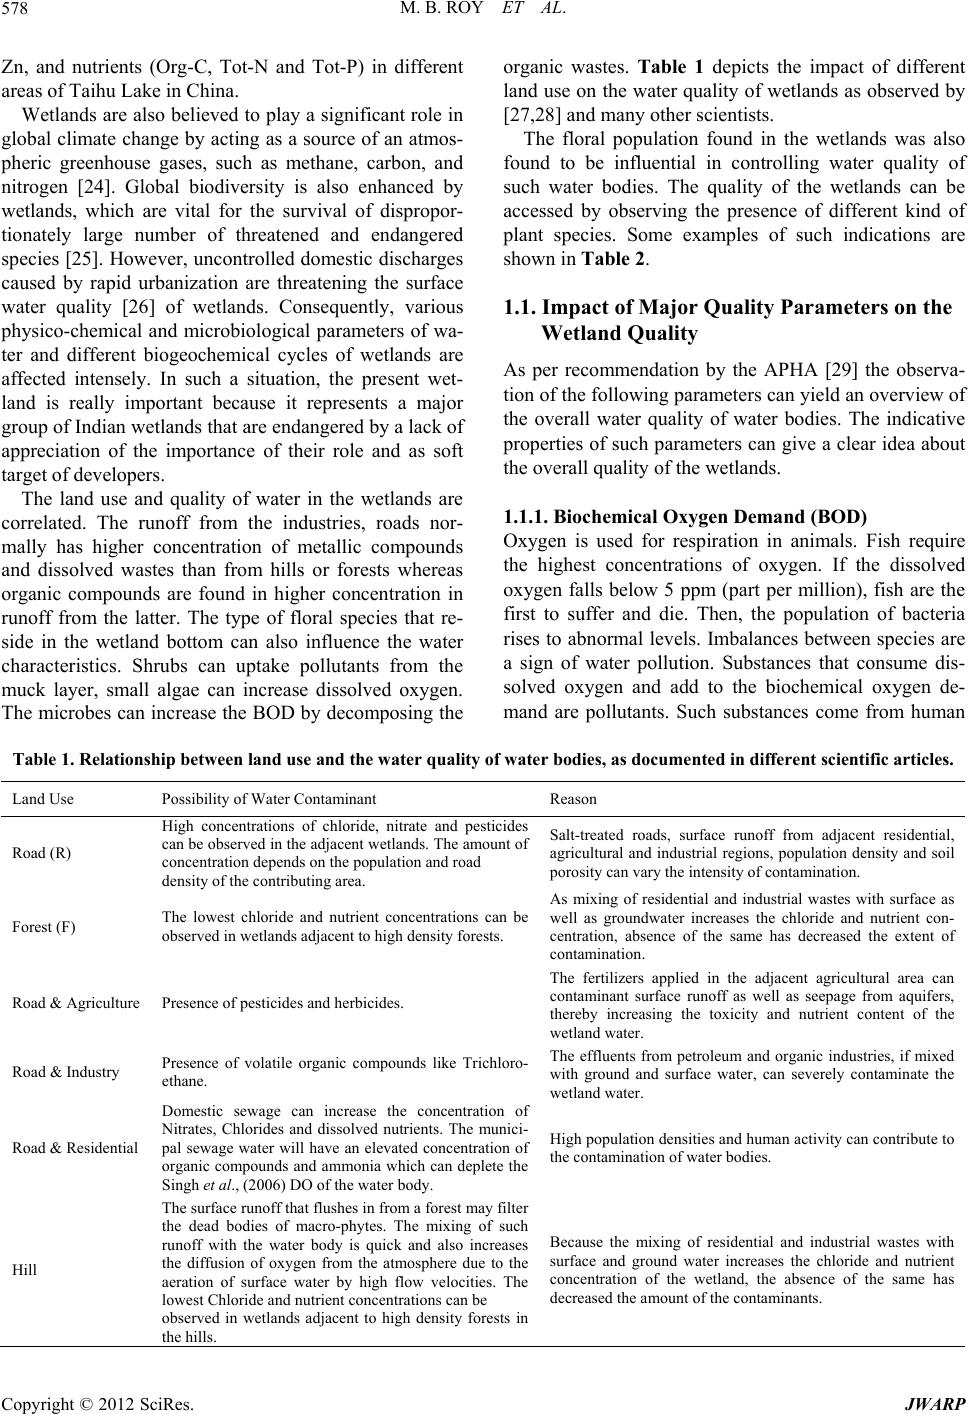 M. B. ROY ET AL. Copyright © 2012 SciRes. JWARP 578 Zn, and nutrients (Org-C, Tot-N and Tot-P) in different areas of Taihu Lake in China. Wetlands are also believed to play a significant role in global climate change by acting as a source of an atmos- pheric greenhouse gases, such as methane, carbon, and nitrogen [24]. Global biodiversity is also enhanced by wetlands, which are vital for the survival of dispropor- tionately large number of threatened and endangered species [25]. However, uncontrolled domestic discharges caused by rapid urbanization are threatening the surface water quality [26] of wetlands. Consequently, various physico-chemical and microbiological parameters of wa- ter and different biogeochemical cycles of wetlands are affected intensely. In such a situation, the present wet- land is really important because it represents a major group of Indian wetlands that are endangered by a lack of appreciation of the importance of their role and as soft target of developers. The land use and quality of water in the wetlands are correlated. The runoff from the industries, roads nor- mally has higher concentration of metallic compounds and dissolved wastes than from hills or forests whereas organic compounds are found in higher concentration in runoff from the latter. The type of floral species that re- side in the wetland bottom can also influence the water characteristics. Shrubs can uptake pollutants from the muck layer, small algae can increase dissolved oxygen. The microbes can increase the BOD by decomposing the organic wastes. Table 1 depicts the impact of different land use on the water quality of wetlands as observed by [27,28] and many other scientists. The floral population found in the wetlands was also found to be influential in controlling water quality of such water bodies. The quality of the wetlands can be accessed by observing the presence of different kind of plant species. Some examples of such indications are shown in Table 2. 1.1. Impact of Major Quality Parameters on the Wetland Quality As per recommendation by the APHA [29] the observa- tion of the following parameters can yield an overview of the overall water quality of water bodies. The indicative properties of such parameters can give a clear idea about the overall quality of the wetlands. 1.1.1. Biochemical Oxygen Demand (BOD) Oxygen is used for respiration in animals. Fish require the highest concentrations of oxygen. If the dissolved oxygen falls below 5 ppm (part per million), fish are the first to suffer and die. Then, the population of bacteria rises to abnormal levels. Imbalances between species are a sign of water pollution. Substances that consume dis- solved oxygen and add to the biochemical oxygen de- mand are pollutants. Such substances come from human Table 1. Relationship betw ee n land use and the water quality of w a te r bodies, as documented in diffe re nt sc ientific ar ticles. Land Use Possibility of Water Contaminant Reason Road (R) High concentrations of chloride, nitrate and pesticides can be observed in the adjacent wetlands. The amount of concentration depends on the population and road density of the contributing area. Salt-treated roads, surface runoff from adjacent residential, agricultural and industrial regions, population density and soil porosity can vary the intensity of contamination. Forest (F) The lowest chloride and nutrient concentrations can be observed in wetlands adjacent to high density forests. As mixing of residential and industrial wastes with surface as well as groundwater increases the chloride and nutrient con- centration, absence of the same has decreased the extent of contamination. Road & Agriculture Presence of pesticides and herbicides. The fertilizers applied in the adjacent agricultural area can contaminant surface runoff as well as seepage from aquifers, thereby increasing the toxicity and nutrient content of the wetland water. Road & Industry Presence of volatile organic compounds like Trichloro- ethane. The effluents from petroleum and organic industries, if mixed with ground and surface water, can severely contaminate the wetland water. Road & Residential Domestic sewage can increase the concentration of Nitrates, Chlorides and dissolved nutrients. The munici- pal sewage water will have an elevated concentration of organic compounds and ammonia which can deplete the Singh et al., (2006) DO of the water body. High population densities and human activity can contribute to the contamination of water bodies. Hill The surface runoff that flushes in from a forest may filter the dead bodies of macro-phytes. The mixing of such runoff with the water body is quick and also increases the diffusion of oxygen from the atmosphere due to the aeration of surface water by high flow velocities. The lowest Chloride and nutrient concentrations can be observed in wetlands adjacent to high density forests in the hills. Because the mixing of residential and industrial wastes with surface and ground water increases the chloride and nutrient concentration of the wetland, the absence of the same has decreased the amount of the contaminants. 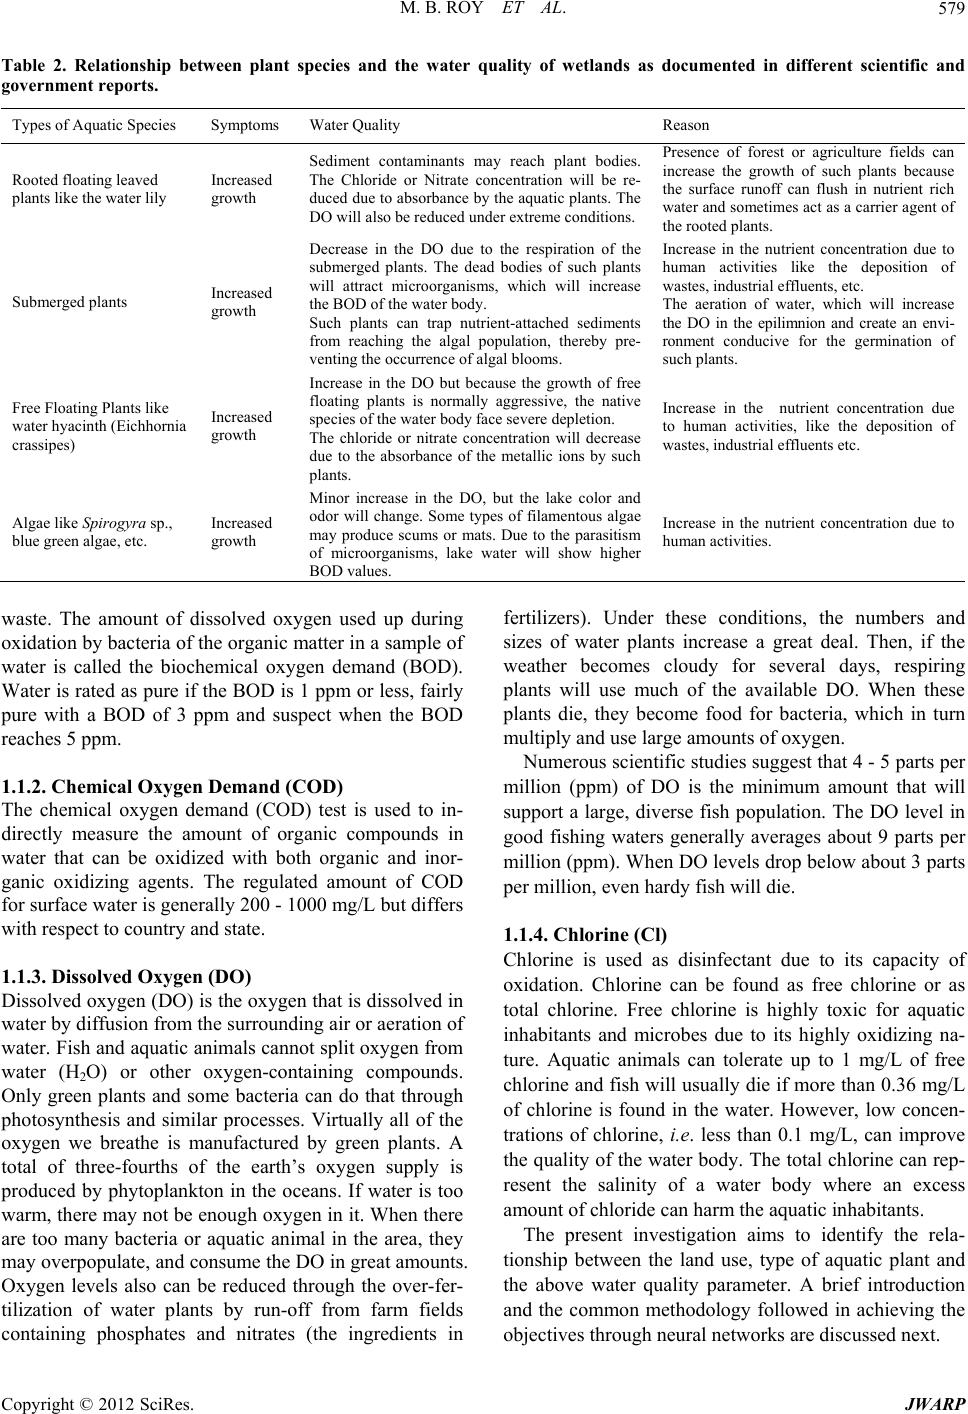 M. B. ROY ET AL. 579 Table 2. Relationship between plant species and the water quality of wetlands as documented in different scientific and government reports. Types of Aquatic Species Symptoms Water Quality Reason Rooted floating leaved plants like the water lily Increased growth Sediment contaminants may reach plant bodies. The Chloride or Nitrate concentration will be re- duced due to absorbance by the aquatic plants. The DO will also be reduced under extreme conditions. Presence of forest or agriculture fields can increase the growth of such plants because the surface runoff can flush in nutrient rich water and sometimes act as a carrier agent of the rooted plants. Submerged plants Increased growth Decrease in the DO due to the respiration of the submerged plants. The dead bodies of such plants will attract microorganisms, which will increase the BOD of the water body. Such plants can trap nutrient-attached sediments from reaching the algal population, thereby pre- venting the occurrence of algal blooms. Increase in the nutrient concentration due to human activities like the deposition of wastes, industrial effluents, etc. The aeration of water, which will increase the DO in the epilimnion and create an envi- ronment conducive for the germination of such plants. Free Floating Plants like water hyacinth (Eichhornia crassipes) Increased growth Increase in the DO but because the growth of free floating plants is normally aggressive, the native species of the water body face severe depletion. The chloride or nitrate concentration will decrease due to the absorbance of the metallic ions by such plants. Increase in the nutrient concentration due to human activities, like the deposition of wastes, industrial effluents etc. Algae like Spirogyra sp., blue green algae, etc. Increased growth Minor increase in the DO, but the lake color and odor will change. Some types of filamentous algae may produce scums or mats. Due to the parasitism of microorganisms, lake water will show higher BOD values. Increase in the nutrient concentration due to human activities. waste. The amount of dissolved oxygen used up during oxidation by bacteria of the organic matter in a sample of water is called the biochemical oxygen demand (BOD). Water is rated as pure if the BOD is 1 ppm or less, fairly pure with a BOD of 3 ppm and suspect when the BOD reaches 5 ppm. 1.1.2. Chemical Oxygen Demand (COD) The chemical oxygen demand (COD) test is used to in- directly measure the amount of organic compounds in water that can be oxidized with both organic and inor- ganic oxidizing agents. The regulated amount of COD for surface water is generally 200 - 1000 mg/L but differs with respect to country and state. 1.1.3. Dissolved Oxygen (DO) Dissolved oxygen (DO) is the oxygen that is dissolved in water by diffusion from the surrounding air or aeration of water. Fish and aquatic animals cannot split oxygen from water (H2O) or other oxygen-containing compounds. Only green plants and some bacteria can do that through photosynthesis and similar processes. Virtually all of the oxygen we breathe is manufactured by green plants. A total of three-fourths of the earth’s oxygen supply is produced by phytoplankton in the oceans. If water is too warm, there may not be enough oxygen in it. When there are too many bacteria or aquatic animal in the area, they may overpopulate, and consume the DO in great amounts. Oxygen levels also can be reduced through the over-fer- tilization of water plants by run-off from farm fields containing phosphates and nitrates (the ingredients in fertilizers). Under these conditions, the numbers and sizes of water plants increase a great deal. Then, if the weather becomes cloudy for several days, respiring plants will use much of the available DO. When these plants die, they become food for bacteria, which in turn multiply and use large amounts of oxygen. Numerous scientific studies suggest that 4 - 5 parts per million (ppm) of DO is the minimum amount that will support a large, diverse fish population. The DO level in good fishing waters generally averages about 9 parts per million (ppm). When DO levels drop below about 3 parts per million, even hardy fish will die. 1.1.4. Chlori n e (Cl) Chlorine is used as disinfectant due to its capacity of oxidation. Chlorine can be found as free chlorine or as total chlorine. Free chlorine is highly toxic for aquatic inhabitants and microbes due to its highly oxidizing na- ture. Aquatic animals can tolerate up to 1 mg/L of free chlorine and fish will usually die if more than 0.36 mg/L of chlorine is found in the water. However, low concen- trations of chlorine, i.e. less than 0.1 mg/L, can improve the quality of the water body. The total chlorine can rep- resent the salinity of a water body where an excess amount of chloride can harm the aquatic inhabitants. The present investigation aims to identify the rela- tionship between the land use, type of aquatic plant and the above water quality parameter. A brief introduction and the common methodology followed in achieving the objectives through neural networks are discussed next. Copyright © 2012 SciRes. JWARP  M. B. ROY ET AL. 580 1.2. Artificial Neural Network (ANN) An (ANN) is a flexible mathematical structure that is capable of identifying complex nonlinear relationships between input and output data sets. Artificial Neural Networks (ANNs) offer a relatively quick and flexible means of modeling, and as a result, the application of ANN modeling has been widely reported in various hy- drological studies [30-32]. In the context of hydrological forecasting, recent papers have reported that ANNs may offer a promising alternative for rainfall-runoff modeling [33-36], stream flow prediction [37-40], reservoir inflow forecasting [41,42] and the prediction of water quality parameters [43]. All the papers reported a high degree of satisfaction with the neural network estimations. Artificial neural networks are viable computational models for a wide variety of problems. These include pattern classifications, speech synthesis and recognition, adaptive interfaces between humans and complex physic- cal systems, function approximation, image compression, associative memory, clustering, forecasting and predict- tion, combinatorial, combinatorial optimization, nonlin- ear system modeling, and control. These networks are “neural” in the sense that they may have been inspired by neuroscience but not necessarily because they are faithful models of neurobiological or cognitive phenomena. In fact, the majority of the networks covered in this book are more closely related to traditional mathematical and statistical models, such as non-parametric pattern classi- fiers, clustering algorithms, nonlinear filters, and statis- ticcal regression models than they are to neurobiology- cal models. 1.2.1. Mathematical Representation of Ar t i fi ci al Neural Network An (ANN) (see Figure 1) is a flexible mathematical Figure 1. A schematic diagram of an artificial neural net- work. structure that is capable of identifying complex nonlinear relationships between input and output data sets. The ANN model of a physical system can be considered as n input neurons , 12 n xx, h hidden neurons ,zz z , 12 n and m output neurons 12 n yy. Let tj be the bias for neuron zj and fk for neuron yk. Let wij be the weight of the connection from neuron xi to zj and beta is the weight of the connection zj to yk. The function that ANN calculates is: 1 kA jjkk ygzb fjh (1) In which, 1 jA jijj zf xwt i h (2) where gA and fA are the activation functions [44]. The development of an artificial neural network, as pre- scribed by ASCE [45] follows the following basic rules: 1) Information must be processed at many single ele- ments called nodes. 2) Signals are passed between nodes through connec- tion links, and each link has an associated weight that represents its connection strength. 3) Each of the nodes applies a non-linear transforma- tion called an activation function to its net input to de- termine its output signal. The numbers of neurons contained in the input and output layers are determined by the number of input and output variables of a given system. The size or number of neurons of a hidden layer is an important consideration when solving problems using multilayer feed-forward networks. If there are fewer neurons within a hidden layer, there may not be enough opportunity for the neural network to capture the intricate relationships between indicator parameters and the computed output parameters. A network with too many hidden layer neurons not only requires a large computational time for accurate training but may also result in overtraining. A neural network is said to be “over-trained” when the network focuses on the characteristics of individual data points rather than just capturing the general patterns present in the entire training set. The network building procedure is divided into three phases, which are described next in a broad way. 1.3. Study Area Mirik Lake (26˚54'N to 26.9˚N—latitude and 88˚10'E to 88.17˚E—longitude) is situated in a valley encircled by hill ridges with an extensive natural drainage network. This lake is located at an altitude of 1767 meters above the sea level. It is 49 km from Darjeeling and falls in the state of West Bengal in India. On the western side close to Mirik Lake flows the Mechi River, which demarcates the Indo-Nepal border. The climate is pleasant all year Copyright © 2012 SciRes. JWARP  M. B. ROY ET AL. JWARP 581 round with temperatures of a maximum 30˚C in the sum- mer and a minimum of 2˚C in winter. Mirik Lake is sur- rounded by the Mirik bazaar, Thana-line, Krishnanagar, Pratapgaon, and Mahendragaon (wards nos. 2, 3, 5, 7 and 8 respectively). Its rich biodiversity, location on a mi- gratory bird route, and vast areas of suitable habitats for multiple bird species make the lake important center for wildlife [46]. Mirik Lake as a whole contains multi- farious features for boating, recreation, jogging, fairs, picnics and many other activities. The total of pollution load is drained from the surface runoff carrying the do- mestic and municipal sewage for the entire Mirik Lake. Some other sources of pollution, such as the outflow from hotels carrying waste, human excreta from poor sanitation, washing clothes, bathing, etc., are drained into the Lake. Figures 2 and 3 show the location of sampling points on Mirik Lake and the land use map of Mirik Lake, respectively. and the characteristics of the wetland bottom, on the wa- ter quality of wetlands. A neuro-genetic model was de- veloped to estimate the interrelation between the former with the latter. The study can reveal the answers to ques- tion such as: 1) How does the quality parameter vary from the pe- ripheral region to the central region of the wetlands? The 1.4. Objective The present study investigates the influence of land use Figure 2. Location of sampling points in mirik lake. Figure 3. Land use map of mirik lake. Copyright © 2012 SciRes.  M. B. ROY ET AL. 582 quality of the water in the peripheral region will be sig- nificantly influenced by the adjacent land use, but the water quality in the central region will be impacted by the floral population of the wetland. 2) What are the relationship between land use and the quality of stored water and why do these relationships exist? 3) What are the relationships that exists between aquatic plants and the quality parameters of the water and why do these relationships exist? 2. Methodology 2.1. Sample Collection and Analysis During study period, the water-spread area of Mirik Lake was about 162,256 m2, the width was 163 m, the depth was 1.65 m and the total volume of the water was about 2,677,224 m3. The point sources of pollution of this lake are the four main drains for the domestic and municipal sewage. The non-point sources of pollutions include the outflow of hotels, clothes washing, bathing and surface run off from the surrounding areas. Samples (Figure 2) were collected from all the sam- pling points on the same day at different times. The DO, pH, temperature and turbidity were measured on spot in the field with Rugged Field Kit HQ Series Portable Me- ters (HQd/IntelliCALTM-8505300-HACH). Samples were brought to Kolkata for further physico-chemical (BOD, COD and chloride) and bacteriological analysis at the School of Water Resources Engineering, Jadavpur Uni- versity as per the standard method [30]. 2.2. Selection of the Land Use Class A land use map (Figure 3) of the study area was devel- oped with the help of satellite imagery and a ground tooth sample survey. The major land uses within the 500 m diameter around the lake were identified as: Hill (H), Forest (F), Pond (P) and Road (R) as can be observed from Figure 2, which also showed the collection points for surface water. 2.3. Identification of Major Aquatic Species of the Lake The aquatic species of the lake were identified from both the ground tooth survey and microscopic tests of the col- lected samples. The three major types of planktons iden- tified were divided into the following classes: Rooted Floating Leaves or Shrubs (S), Submerged Plants or Shrubs (SS) (Table 2), and Clear Water (C), which represents water with no noticeable floral population. The identified land use and plant classes along with the value of BOD, COD, DO and Cl parameters from the collected samples, a neural network model was devel- oped with each quality parameter as output and land use, plant classes, distance from the wetland periphery and other 3 quality parameter as input. The other parameters were included as input to educate the model about the interrelationship if any in-between the parameters which also help to validate the model output. 2.4. Development of the Neuro-Genetic Models 2.4.1. Network Building Procedure Selection of Network Topology Neural networks can be of different types, like feed for- ward, radial basis function, time lag delay etc. The type of network is selected with respect to the knowledge of input and output parameters and their relationships. Once the type of network is selected, selecting the network topology is the next concern. A trial and error method is generally used for this purpose, but many studies now prefer the application of a genetic algorithm [47]. Ge- netic algorithms are search algorithms based on the me- chanics of natural genetics and natural selection. The basic elements of natural genetics—reproduction, cross- over, and mutation—are used in the genetic search pro- cedure. A GA can be considered to consist of the fol- lowing steps [48]: 1) Select an initial population of strings. 2) Evaluate the fitness of each string. 3) Select strings from the current population to mate. 4) Perform crossover (mating) for the selected strings. 5) Perform mutation for selected string elements. 6) Repeat steps 2) - 5) for the required number of gen- erations. The genetic algorithm is a robust method of searching for the optimum solution to complex problems, such as the selection of an optimal network topology, where it is difficult or impossible to test for optimality. The basics of GAs have already been discussed by many authors [47,49,50]. Hence the details of the basic procedures of GAs are not discussed in the present literature. 2.4.2. Training Phase To encapsulate the desired input output relationship, the weights are adjusted and applied to the network until the desired error is achieved. This is called as “training the network”. 2.4.3. Testing Phase After training is completed, some portion of the available historical dataset is fed to the trained network and a known output is estimated out of them. The estimated values are compared with the target output to compute the MSE. If the value of MSE is less than 1%, then the network is said to be sufficiently trained and ready for estimation (see Figure 4). The dataset is also used for Copyright © 2012 SciRes. JWARP  M. B. ROY ET AL. 583 Data Preprocessing I N P U T L A Y E R(x i ) H I D D E N L A Y E R (z j ) O U T P U T L A Y E R w ij y k f A (x i ) b jk z j t j f k g A (x i ) If, (y k -d k )<desired MSE NO NO Training Algorithm like QP, CGD and BBP to update Weight Training Algorithm like QP, CGD and BBP to update Weight YES MODEL DEVELOPMENT SUCCESS FUL Figure 4. The basic methodology followed for the develop- ment of a Neural Network [40]. cross-validation to prevent over-training during the train- ing phase [44]. 3. Result & Discussion In total four neuro-genetic models were prepared with one of four quality parameters as the output. The models were trained with the Quick Propagation and Conjugate Gradient Descent training algorithms, and the perform- ance analysis of the results from the models revealed QP trained models for BOD and DO and CGD trained mod- els for COD and Cl as the best trained neuro-genetic model (see Table 3). The estimation work was carried out with the help of the model trained with the selected algorithm. 3.1. Discussion According to the Table s 1, 2 and 4 following observation and discussions are made to analyze the impact of land use and aquatic plants on the quality of wetland water. According to the results (Figure 5), eight combina- tions of land use and types of wetland bottoms were identified. The results showed that the BOD is worst (i.e., highest concentration) for the combination of road and submerged floral species and the combination of clear water and forest yielded the best concentration of the BOD (i.e., lowest concentration). The combination of S and R showed a moderate concentration of BOD in the lake water. BOD concentrations of a lake are known to increase in the presence of organic content, which invites micro-bacteria. The bacteria, with the help of dissolved oxygen, decay the organic matter. The presence of or- ganic content can thus reduce the DO of a lake. Lowering the DO concentration can severely impact the fish popu- lation and other floral and faunal colonies of the lake because these species depend on the lake DO for food production and respiratory activities. In the present in- vestigation, the presence of submerged species in the water may increase the organic content of the water. The dead bodies of such species can increase the BOD con- centration. The road adjacent to the lake will indicate heavy depositions of organic wastes in the pond from the incoming population, and because the lake is famous for eco-tourism, the influx of temporary population is very high. However, the absence of any biological species in the lake water and forest in the adjacent areas has re- duced the deposition of organic wastes in the water. The forest had acted as a filter for removing organic matter, such as the dead bodies of animals and large trees from Table 3. The specification used and results achieved from the neuro-genetic models developed for the present study. Network Input Hidden Layer Output Training Algorithm Training MSE Testing MSE MSE r SD BOD 6.00 7.00 1.00 QP 0.05 0.08 0.06 0.870.96 BOD 6.00 3.00 1.00 CGD 1.21 1.56 1.02 0.760.87 COD 6.00 6 1.00 QP 7.87 7.68 5.67 0.760.88 COD 6.00 3.00 1.00 CGD 5.45 5.88 4.95 0.880.90 DO 6.00 3 1.00 QP 0.05 0.045 0.05 0.980.89 DO 6.00 3.00 1.00 CGD 0.07 0.08 0.08 0.761.20 Cl 6.00 4 1.00 QP 0.02 0.04 0.06 0.890.95 Cl 6.00 16.00 1.00 CGD 0.01 0.03 0.01 0.980.96 Copyright © 2012 SciRes. JWARP  M. B. ROY ET AL. 584 Table 4. The impact of characteristics of adjacent land use and wetland bed on the four quality parameters considered for the present investigation. Combination LUB LUA COD Cl BODDO 1 S R 26.27 9.55 8.685.67 1 S R 95.85 7.87 5.045.96 1 S R 37.56 5.50 9.655.54 1 S R 63.90 4.06 9.245.62 2 N H 45.72 5.23 9.535.82 3 SS H 18.83 19.53 11.055.22 3 SS H 143.91 12.74 2.524.42 3 SS H 55.11 8.51 12.024.52 3 SS H 42.82 21.62 14.805.62 2 C R 368.87 29.54 5.555.79 4 C F 30.55 20.20 0.244.97 2 C R 84.43 26.41 9.84 4.91 5 C P 16.10 28.13 23.294.63 2 C R 207.98 21.93 10.32 4.66 2 C H 32.58 15.07 8.92 4.84 6 S H 41.42 21.16 8.31 5.16 7 SS H 30.24 22.54 8.52 4.93 7 SS H 16.29 15.54 24.534.97 7 SS R 56.94 26.65 21.744.59 8 SS R 30.51 26.23 20.594.56 the surface runoff coming through the forest. Hence, the BOD of such areas were found to be lower than those of other areas that are widely visited by the tourist and lo- cals who are economically dependent on the former for their sustainability, but the locals and tourists had also converted the lake into a basket for their waste materials. The presence of non-biodegradable wastes can in- crease the COD concentration of the lake. According to the results (see Figure 6), the combination of clean water and road yielded the higher values of COD, and a com- bination of SS and H yielded the lower values of the pa- rameter. The absence of shrubs or submerged species can reduce the BOD of a water body, but the presence of non-biodegradable wastes can increase the COD of the same. The presence of roads has only smoothed the path of such wastes with the surface runoff coming into the lake unhindered. That may be the reason for high con- centrations of COD when the road is present within the 500 m of the lake. The results from the model also showed that the COD (mg/L) is lower (≤75 mg/L) whenever shrubs or submerged shrubs are present in the wetland bed, but the biochemical oxygen demands (BODs) of such areas are found to be more than 5 mg/L. The reason can be attributed to the presence of abiotic bacteria present in the plankton population of the lake. These bacteria produce their food with the help of oxy- gen bonded to metallic ions. That is why the CODs in such areas are lower because the chemical oxygen is not used for decaying inorganic wastes, but BOD is more than 5 mg/L because the decomposition of organic waste is done by the abiotic bacterial population. In case of the DO (see Figure 7), the identified com- binations yielded no noticeable differences, but the DO is found to be more for shrubs and road combination and less for submerged shrubs and hill combinations. The probable reason can be attributed to ecotourism events, such as boating and fishing, which are rampant in the lake and may aerate the lake water. Again, presence of shrubs can also maintain the oxygen content of the lake due to the ribosomal bacteria present in the roots, which release oxygen during nutrient uptake. The relative in crease of the DO in presence of shrubs may be the results of such nutrification procedures. From the prediction of chlorine (see Figure 8) it can be observed that the concentration is higher for SS and R combinations, whereas the same is lower for S and R combination with respect to the other combinations iden- tified. The presence of a road within 500 m of the lake can contribute to the increase in chlorine concentration. The lake, in case of the present investigation, is a popular place for eco-tourism and the generated organic as well as inorganic waste are deposited in the lake. The surface runoff from the adjacent high altitude land also brings dissolved chlorine due to the uncontrolled use of fertiliz- ers in the adjacent floriculture. The unhindered surface (due to the road area) from these areas along with depo- sition of wastes by the tourists can cumulatively influ- ence the increase in chlorine concentration of the lake. However, because water plants are popular for their chlorine uptake, the presence of shrubs has reduced the chlorine concentration and absence of the same has al- lowed the concentration to rise. The toxic byproducts generated from a submerged algal population can in- crease chlorine content, so the presence of submerged planktons and the absence of shrubs may have allowed the chlorine concentration to rise. From Table 4 and the discussions above, it can be ob- served that SS is an influential factor, which may impact the quality of water, because most of the cases the pres- ence of submerged shrubs had caused the differences in the concentration of water quality parameters of the lake. The road and hills, present in the area within 500 m of Copyright © 2012 SciRes. JWARP  M. B. ROY ET AL. 585 3 to 6 to 16 t 27 t 37 t 47 t 5 15 o 26 o 36 o 46 o 50 50 and ab BOD Color +WWC-4 WWC-3 +WWC-5 +WWC-6 +WWC-8 +WWC-9 +WWC-10 +WWC-11 +WWC-12 +WWC-13 +WWC-14 +WWC-15 +WWC-16 +WWC-17 +WWC-18 WWC-19 WWC-20 WWC-21 WWC-2 WWC-1 WWC-30 WWC-26 WWC-27 +WWC-28 Figure 5. Thematic map of the BOD concentration generated from the identified relationships between the land use, wetland bed and the quality par a me ter. 3 to 50 51 to 151 to 201 to 301 to 351 to 401 and 150 200 300 350 400 ab COD Color WWC-06 WWC-08 WWC-09 WWC-10 WWC-11 WWC-12 WWC-13 WWC-14 WWC-15 WWC-16 WWC-17 WWC-18 WWC-19 WWC-20 WWC-21 WWC-04 WWC-03 WWC-02 WWC-01 WWC-36 WWC-38 WWC-34 WWC-30 WWC-26 WWC-27 WWC-28 Figure 6. Thematic map of the COD concentration generated from the identified relationships between the land use, wetland bed and the quality par a me ter. Copyright © 2012 SciRes. JWARP  M. B. ROY ET AL. 586 53 to 10 3 to 4 2 to 3 1 to 2 0.5 to 1 0 to 0.5400 0 DO Color WWC-06 WWC-08 WWC-09 WWC-10 WWC-11 WWC-12 WWC-13 WWC-14 WWC-15 WWC-16 WWC-17 WWC-18 WWC-19 WWC-20 WWC-21 WWC-04 WWC-03 WWC-02 WWC-01 WWC-36 WWC-38 WWC-34 WWC-30 WWC-26 WWC-28 WWC-27 Figure 7. Thematic map of the DO concentration generated from the identified relationships between the land use, wetland bed and the quality par a me ter. 3 to 5 6 to 15 16 to 26 27 to 36 37 to 46 47 to 50 50 and ab Chlorine Color WWC-06 WWC-08 WWC-09 WWC-10 WWC-11 WWC-12 WWC-13 WWC-14 WWC-15 WWC-16 WWC-17 WWC-18 WWC-19 WWC-20 WWC-21 WWC-04 WWC-03 WWC-02 WWC-01 WWC-36 WWC-38 WWC-34 WWC-30 WWC-26 WWC-27 WWC-28 Figure 8. Thematic map of the Cl concentration generated from the identified relationships between the land use, wetland ed and the quality par a me ter. b Copyright © 2012 SciRes. JWARP  M. B. ROY ET AL. Copyright © 2012 SciRes. JWARP 587 the lake are also identified as an influencing factor on the quality of wetland water. 4. Conclusion The present study investigates the relationship between water quality parameters and adjacent land use and the aquatic plants of the wetland with the help of neuro-ge- netic models. The model results showed that the sub- merged shrubs along with road and hills within the 500 m of the lake have a quantifiable relationship with the water quality of the lake. The DO was found to be least source of problems, and the BOD was found to be a highly correlated parameter with the inputs among the considered four parameters, which the study has assumed to be representative of overall quality of the wetland. The ecotourism activities, which are common in and around the lake due to the geo-morphology and biodiversity of the region was also found to be affecting the quality of the lake water. That is why the anthropogenic impacts coming from both tourist and local population on the quality of water may be considered as the next objective for the overall economic and environmental sustainabil- ity of the wetlands, which is treated as the major source of income of the local population. The identification of the correlation can be performed for other lakes also to obtain a better conclusion and generalization of the ob- servations. The neuro-genetic models were found to be suitable for the identification of relationships, which is eminent from the low MSE achieved by all the models trained with different training algorithms. REFERENCES [1] U. C. Panda, S. K. Sundaray, P. Rath, B. B. Nayak and D. Bhatta, “Application of Factor and Cluster Analysis for Characterization of River and Estuarine Water Systems— A Case Study: Mahanadi River (India),” Journal of Hy- drology, Vol. 331, No. 3-4, 2006, pp. 434-445. [2] Q. Zhang, Z. Li, G. Zeng, J. Li, Y. Fang, Q. Yuan, Y. Wang and F. Ye, “Assessment of Surface Water Quality Using Multivariate Statistical Techniques in Red Soil Hilly Region: A Case Study of Xiangjiang Watershed, China,” Environmental Monitoring and Assessment, Vol. 152, No. 1-4, 2009, 2008, pp. 123-131. [3] X. Zeng and T. C. Rasmussen, “Multivariate Statistical Characterization of Water Quality in Lake Lanier, Geor- gia, USA,” Journal of Environmental Quality, Vol. 34, No. 6, 2005, pp. 1980-1991. [4] K. P. Singh, A. Malik and S. Sinha, “Water Quality As- sessment and Apportionment of Pollution Sources of Gomti River (India) Using Multivariate Statistical Tech- niques—A Cases Study,” Analytica Chimica Acta, Vol. 538, No. 1-2, 2005, pp. 355-374. [5] K. P. Singh, A. Malik, N. Basant and P. Saxena, “Multi- Way Partial Least Squares Modeling of Water Quality Data,” Analytica Chimica Acta, Vol. 584, No. 2, 2007, pp. 385-396. [6] N. J. Boyer, J. W. Fourqurean and R. D. Jones, “Spatial Characterization of Water Quality in Florida Bay and Whitewater Bay by Multivariate Analyses: Zones of Similar Influence,” Estuaries and Coasts, Vol. 20, No. 4, 1997, pp. 743-758. doi:10.2307/1352248 [7] J. J. Berzas, L. F. Garciâa, R. C. Rodriâguez and P. J. Martiân-Alvare, “Evolution of the Water Quality of a Managed Natural Wetland: Tablas Dé Daimiel National Park (Spain),” Pergamon, Vol. 34, No. 12, 2000, pp. 3161-3170. [8] S. K. Swanson, J. M. Bahr, M. T. Schwar and K. W. Pot- ter, “Two-Way Cluster Analysis of Geochemical Data to Constrain Spring Source Waters,” Chemical Geology, Vol. 179, No. 1-4, 2001, pp. 73-91. doi:10.1016/S0009-2541(01)00316-3 [9] R. Brouwer, S. Georgiou and R. K. Turner, “Integrated Assessment and Sustainable Water and Wetland Manage- ment. A Review of Concepts and Methods,” Integrated Assessment, Vol. 4, No. 3, 2003, pp. 172-184. [10] H. Boyacioglu and O. Gunduz, “Application of Factor Analysis in the Assessment of Surface Water Quality in Buyuk Menderes River Basin,” European Water, Vol. 9- 10, 2005, pp. 43-49. [11] H. Boyacioglu, “Water Pollution Sources Assessment by Multivariate Statistical Methods in the Tahtali Basin, Turkey,” Environmental Geology, Vol. 54, No. 2, 2008, pp. 275-282. [12] F. Zhou, Y. Liu and H. C. Guo, “Application of Multi- variate Statistical Methods to the Water Quality Assess- ment of the Watercourses in the Northwestern New Ter- ritories, Hong Kong,” Environmental Monitoring and Assessment, Vol. 132, No. 1-3, 2007, pp. 1-13. doi:10.1007/s10661-006-9497-x [13] P. Praus, “Urban Water Quality Evaluation Using Multi- variate Analysis,” Acta Montanistica Slovaca, Vol. 12, No. 2, 2007, pp. 150-158. [14] A. F. M. Al-karkhi, M. A. Hossain and I. Norli, “Applica- tion of Cluster Analysis for Water Quality Parameters-Juru Estuary (Malaysia),” International Conference on Envi- ronmental Research and Technology, 2008. [15] Z. M. Chen, G. Q. Chen, B. Chen, J. B. Zhou, Z. F. Yang and Y. Zhou, “Net Ecosystem Services Value of Wetland: Environmental Economic Account,” Communications in Nonlinear Science and Numerical Simulation, Vol. 14, No. 6, 2009, pp. 2837-2843. [16] R. K. Turner, “Valuation of Wetlands in a Landscape and Institutional Perspective,” Ecological Economics, Vol. 35, 2000, pp. 1-6. [17] Y. Ouyang, “Evaluation of River Water Quality Monitor- ing Stations by Principal Component Analysis,” Water Research, Vol. 39, No. 12, 2005, pp. 2621-2635. doi:10.1016/j.watres.2005.04.024 [18] N. E. Detenbeck, C. A. Johnston and G. J. Niemi, “Wet- land Effects on Lake Water Quality in the Minneapolis/St. Paul Metropolitan Area, Netherlands,” Landscape Ecol- ogy, Vol. 8, No. 1, 1993, pp. 39-61.  M. B. ROY ET AL. 588 doi:10.1007/BF00129866 [19] K. G. Wayland, D. T. Long, D. W. Hyndman, B. C. Pija- nowski, S. M. Woodhams and S. K. Haack, “Identifying Relationships between Basesflow Geochemistry and Land Use with Synoptic Sampling and R-Mode Factor Analy- sis,” Journal of Environmental Quality, Vol. 32, No. 1, 2003, pp. 180-190. doi:10.2134/jeq2003.0180 [20] R. J. Johnston, E. Y. Besedin and R. F. Wardwell, “Mod- eling Relationships between Use and Nonuse Values for Surface Water Quality: A Meta-Analysis,” Water Re- sources Research, Vol. 39, No. 12, 2003, p. 1363. doi:10.1029/2003WR002649 [21] A. Goonetillekea, E. Thomas, S. Ginn and D. Gilbert, “Understanding the Role of Land Use in Urban Storm Water Quality Management,” Journal of Environmental Management, Vol. 74, No. 1, 2005, pp. 31-42. [22] P. P. Sehot and J. V. D. Wal, “Human Impact on Re- gional Groundwater Composition through Intervention in Natural Flow Patterns and Changes in Land Use,” Jour- nal of Hydrology, Vol. 134, No. 1-4, 1992, pp. 297-313. [23] Q. Wenchuan, M. Dickman and W. Sumin, “Multivariate Analysis of Heavy Metal and Nutrient Concentrations in Sediments of Taihu Lake, China,” Hydrobiologia, Vol. 450, No. 1-3, 2001, pp. 83-89. [24] M. Jansson, R. Anderson, H. Berggren and L. Leonardson, “Wetlands and Lakes as Nitrogen Traps,” JSTOR: Ambio, Vol. 23, No. 6, 1994, pp. 320-325. [25] W. J. Mitsh and J. G. Gossolink, “Wetlands,” 2nd Edition, Van Nostrand Reinhold, New York, 1993. [26] H. Boyacioglu, “Development of Universal Water Quality Index and Environmetric Analysis in Surface Water Qual- ity Assessment with Field Implementation and Valida- tion,” M.Sc. Thesis, Karlsruhe University, Karlsruhe, 2006. [27] M. V. Croft and P. Chow-Fraser, “Use and Development of the Wetland Macrophyte Index to Detect Water Qual- ity Impairment in Fish Habitat of Great Lakes Coastal Marshes,” Journal of Great Lakes Research, Vol. 33, No. sp3, 2007, pp. 172-197. doi:10.3394/0380-1330(2007)33[172:UADOTW]2.0.CO; 2 [28] D. Eckhardt, “Land Use and Water Quality,” 2003. http://www.waterencyclopedia.com/La-Mi/Land-Use-and -Water-Quality.html [29] American Public Health Association (APHA), “Standard Methods for the Examination of Water and Wastewater,” 19th Edition, APHA, Washington, 1995. [30] Q. Zhang and S. J. Stanley, “Realtime Water Treatment Process Control with Artificial Neural Networks,” Jour- nal of Environmental Engineering, Vol. 125, No. 2, 1999, pp. 153-160. doi:10.1061/(ASCE)0733-9372(1999)125:2(153) [31] T. R. Neelakantan and N. V. Pundarikanthan, “Neural Network Based Simulation-Optimization Model for Res- ervoir Operation,” Journal of Water Resource, Planning and Management, Vol. 126, No. 2, 2000, pp. 57-64. doi:10.1061/(ASCE)0733-9496(2000)126:2(57) [32] C. Ray and K. K. Klindworth, “Neural Networks for Ag- richemical Vulnerability Assessment of Rural Private Wells,” Journal of Hydrologic Engineering, Vol. 5, No. 2, 2000, pp. 162-171. doi:10.1061/(ASCE)1084-0699(2000)5:2(162) [33] K. Hsu, H. V. Gupta and S. Sorooshian, “Artifical Neural Network Modeling of the Rainfall-Runoff Process,” Jour- nal of Water Resource Research, Vol. 31, No. 10, 1995, pp. 2517-2530. doi:10.1029/95WR01955 [34] D. A. Fernando and A. W. Jayawardena, “Runoff Fore- casting Using RBF Networks with OLS Algorithm,” Journal of Hydrologic Engineering, Vol. 3, No. 3, 1998, pp. 203-209. doi:10.1061/(ASCE)1084-0699(1998)3:3(203) [35] A. S. Tokar and P. A. Johnson, “Rainfall-Runoff Model- ing Using Artificial Neural Networks,” Journal of Hy- drologic Engineering, Vol. 4, No. 3, 1999, pp. 232-239. doi:10.1061/(ASCE)1084-0699(1999)4:3(232) [36] S. Y. Liong, S. T. Khu and W. T. Chan, “Derivation of Pareto Front with Genetic Algorithm and Neural Net- work,” Journal of Hydrologic Engineering, Vol. 6, No. 1, 2001, pp. 52-61. doi:10.1061/(ASCE)1084-0699(2001)6:1(52) [37] T. A. Clair and J. M. Ehrman, “Using Neural Networks to Assess the Influence of Changing Seasonal Climates in Modifying Discharge, Dissolved Organic Carbon, and Nitrogen Export in Eastern Canadian Rivers,” Journal of Water Resources Research, Vol. 34, No. 3, 1998, pp. 447-455. doi:10.1029/97WR03472 [38] C. E. Imrie, S. Durucan and A. Korre, “River Flow Pre- diction Using Neural Networks: Generalization beyond the Calibration Range,” Journal of Hydrology, Vol. 233, No. 3-4, 2000, pp. 138-153. doi:10.1016/S0022-1694(00)00228-6 [39] M. Majumder, P. K. Roy and A. Mazumdar, “Optimiza- tion of the Water Use in the River Damodar in West Ben- gal in India: An Integrated Multi-Reservoir System with the Help of Artificial Neural Network,” Journal of Engi- neering, Computing and Architecture, Vol. 1, No. 2, 2007, Article ID: 1398. [40] M. Majumder, “Watershed Modeling of River Damodar with the Help of Neural Network and Genetic Algo- rithm,” Ph.D. Thesis, Jadavpur University, Kolkata, 2010. [41] S. K. Jain, A. Das and D. K. Srivastava, “Application of ANN for Reservoir Inflow Prediction and Operation,” Journal of Water Resource, Planning and Management, Vol. 125, No. 5, 1999, pp. 263-271. doi:10.1061/(ASCE)0733-9496(1999)125:5(263) [42] P. Coulibaly, F. Anctil and B. Bobee, “Daily Reservoir Inflow Forecasting Using Artificial Neural Networks with Stopped Training Approach,” Journal of Hydrology, Vol. 230, No. 3-4, 2000, pp. 244-257. doi:10.1016/S0022-1694(00)00214-6 [43] H. R. Maier and G. C. Dandy, “Empirical Comparison of Various Methods for Training Feed-Forward Neural Net- works for Salinity Forecasting,” Journal of Water Re- sources Research, Vol. 35, No. 8, 1999, pp. 2591-2596. doi:10.1029/1999WR900150 [44] K. P. Sudheer, “Knowledge Extraction from Trained Neu- ral Network River Flow Models,” Journal of Hydrologic Engineering, Vol. 10, No. 4, 2005, pp. 264-269. Copyright © 2012 SciRes. JWARP  M. B. ROY ET AL. Copyright © 2012 SciRes. JWARP 589 doi:10.1061/(ASCE)1084-0699(2005)10:4(264) [45] ASCE, “Task Committee on Application of Artificial Neu- ral Networks in Hydrology. Artificial Neural Networks in Hydrology I: Preliminary Concepts,” Journal of Hydro- logic Engineering, Vol. 5, No. 2, 2000, pp. 115-123. [46] C. F. Iscen, O. Emiroglu, S. Ilhan, N. Arslan, V. Yilmaz and S. Ahiska, “Application of Multivariate Statistical Techniques in the Assessment of Surface Water Quality in Uluabat Lake, Turk,” Environmental Monitoring and Assessment, Vol. 144, No. 1-3, 2008, pp. 269-276. doi:10.1007/s10661-007-9989-3 [47] J. A. Ahmed and A. K. Sarma, “Genetic Algorithm for Optimal Operating Policy of a Multipurpose Reservoir,” Journal of Water Resources Management, Vol. 19, No. 2, 2005, pp. 145-161. doi:10.1007/s11269-005-2704-7 [48] D. H. Burn and J. S. Yulianti, “Waste-Load Allocation Using Genetic Algorithms,” Journal of Water Resource, Planning and Management, Vol. 127, No. 2, 2001, pp. 121-129. doi:10.1061/(ASCE)0733-9496(2001)127:2(121) [49] Q. J. Wang, “The Genetic Algorithm and Its Application to Calibrating Conceptual Rainfall-Runoff Models,” Jour- nal of Water Resources Research, Vol. 27, No. 9, 1991, pp. 2467-2471. doi:10.1029/91WR01305 [50] R. Wardlaw and M. Sharif, “Evaluation of Genetic Algo- rithms for Optimal Reservoir System Operation,” Journal of Water Resources Planning and Management, Vol. 125, No. 1, 1999, pp. 25-33. doi:10.1061/(ASCE)0733-9496(1999)125:1(25)
|