Health
Vol.5 No.11(2013), Article ID:40066,10 pages DOI:10.4236/health.2013.511255
Client satisfaction with integrated community case management program in Wakiso District, Uganda, October 2012: A cross sectional survey
![]()
School of Public Health, College of Health Sciences, Makerere University, Kampala, Uganda; *Corresponding author: kipanden@gmail.com, ellie@musph.ac.ug, dknnkwesiga@gmail.com, drjamesbagonza@gmail.com, amukose@musph.ac.ug
Copyright © 2013 Nathan Tumuhamye et al. This is an open access article distributed under the Creative Commons Attribution License, which permits unrestricted use, distribution, and reproduction in any medium, provided the original work is properly cited.
Received 12 September 2013; revised 16 October 2013; accepted 28 October 2013
Keywords: Client Satisfaction; Malaria; Pneumonia; Diarrhea; Wakiso
ABSTRACT
Background: Malaria, pneumonia and diarrhea are the leading causes of death in children under five years of age in Uganda. In a bid to improve access to prompt and effective treatment of these diseases, Malaria Consortium in partnership with United Nations International Children’s Emergency Fund (UNICEF) introduced Integrated Community Case Management (ICCM) in eight central districts of Uganda. There is currently limited information about client satisfaction with this program. The main objective of the study was to assess client satisfaction with the ICCM program in Wakiso district. Methods: A cross-sectional study using quantitative methods and a modified SERVQUAL tool was conducted and 454 care givers of children under five years of age were interviewed. Differences in mean scores between expected and perceived services were analyzed using paired t-tests and chi-square tests. A negative score implied that clients were not satisfied with the care they received. Logistic regression models were also used. Results: Among 454 respondents, 80% of the care givers of children under five were satisfied with ICCM program. The overall gap (−0.332) between expectations and perceptions was significant, (t = −4.89, p-value 0.0081) meaning that despite the high level of client satisfaction, there still existed a quality gap in services provided under ICCM. Furthermore, there were no significant differences in the expectation and perception scores among the different dimensions except for reliability which had a score of −0.49 (p-value 0.0005). The multivariable logistic regression model showed that primary education (OR 2.8, 95% CI 1.12 - 6.80) and being a Muslim (OR 2.9, 95% CI 1.40 - 6.34) were significantly associated with client satisfaction. Conclusion: Overall, 80% of the clients were satisfied with ICCM services despite the overall quality gap in ICCM services and there was no statistical significant difference between perceptions and expectations for all the dimensions except for reliability dimension. The DHO and implementing partners should ensure a systematic approach for gathering, aggregating, analysing and reporting data to map and identify key gaps in treatment coverage.
1. INTRODUCTION
About 12 million deaths occur annually in children under five years of agein developing countries [1] and 70% of these deaths are due to the common childhood illnesses (diarrhea, pneumonia, measles, malaria, malnutrition) and in most cases, a combination of these conditions [2]. The main causes of death of children worldwide are neonatal disorders, diarrhea, pneumonia and malaria, although HIV/AIDS accounts for at least 10% in some African countries [3].
In sub-Saharan Africa, about 1.7 to 2.7 million people die of malaria every year among which one million are children below five years of age [4]. Malaria is the leading cause of morbidity and mortality in Uganda, accounting for 30% - 50% of outpatient visits at health facilities, 35% of hospital admissions, 9% - 14% of hospital deaths (nearly half of those in children less than five years of age) and a great number of deaths occurring outside health care settings [5]. The 2008 world malaria annual report estimation for total malaria deaths in Uganda was at 43,490, ranking it third in the world behind Nigeria and the Democratic Republic of Congo [6]. This death toll exceeds that of HIV/AIDS [6]. Worldwide, more than 2 million children die annually of acute respiratory infections, most often pneumonia [3,7]. Risk factors that influence fatal pneumonia include poor socioeconomic status, incomplete immunization schemes, malnutrition, late care seeking and inadequate treatment yet cheap and effective tools exist for pneumonia prevention and care [8].
Diarrhea is estimated to cause 1.5 million deaths and 21% of all under fives mortality worldwide annually [1]. It accounts for about five childhood deaths per 1000 population [9] mostly from developing countries. Annually diarrhea is associated with over 25 million outpatient visits, 2 million hospitalizations and 527,000 deaths worldwide [10]. The reported prevalence of diarrhea from global surveillance networks and hospital based studies ranges from 6% to 56% [11-13]. In Wakiso district, malaria, pneumonia and diarrhea in children account for 35%, 8% and 8% respectively of the overall positive diagnosis of children’s illnesses (District Health Office, Wakiso, 2011).
In 2010, recognizing the magnitude of malaria burden and malaria related illnesses like diarrhea and pneumonia in children under five years of age, Malaria Consortium in partnership with the United Nations International Children’s Emergency Fund (UNICEF) and the Government of Uganda adopted a new National Treatment and Control Policy called Integrated Community Case Management (ICCM) of malaria, pneumonia and diarrhea. It was adopted as a key strategic approach to malaria, pneumonia and diarrhea control and early treatment to reduce child mortality [5]. Malaria Consortium Uganda with funding from UNICEF is supporting ICCM in eight districts of the central region namely, Wakiso, Mpigi, Gombe, Gomba, Masaka, Lwego, Bukomansimbi and Kulungu. The project begun in July 2010 and its main objective is to avert at least 5500 deaths among children under five years of age by 2014.
The village health teams (VHTs) are supplied with prepackaged medicines, commodities and are responsible for mobilizing the communities to demand, support and use the ICCM services. The major interventions under ICCM are to support and strengthen community-based case management programs for malaria, pneumonia and diarrhea through selection of VHTs and training them in the basic health care package and in ICCM. The VHTs trained in ICCM are provided with the necessary commodities1, job aids and drugs in order to carry out their roles effectively. Close support supervision and monitoring and evaluation of the VHT activities are the key components of ICCM. For pneumonia, treatment is done using amoxicillin while treatment for diarrhea is with zinc supplements and low osmolarityoral rehydration salts (ORS).
Whereas preventive interventions can be scheduled, the curative interventions need to be made available all the time. This is most especially for children whose conditions occur unpredictably year round and therefore die before receiving any treatment. Most people especially those living in rural areas are out of reach of curative services and only a small fraction of those who acquire any disease are treated [14]. Studies done in Uganda have focused on utilization of health care providers by febrile children [15], challenges of malaria elimination [16] and determinants of delays in care-seeking for febrile children [17]. Limited studies on evaluation of client satisfaction with malaria treatment and prevention programs have been done. The main objective of this study was therefore to assess client satisfaction with integrated Community Case Management program… so as to improve malaria, pneumonia and diarrhea services, decrease patient defections, decrease negative word of mouth advertizing, increase patient referral and improve patient centered care and quality of ICCM in Wakiso District.
2. METHODS
2.1. Study Setting
Wakiso district lies in the central region, bordering with the districts of; Luweroin the North, Mukono in the East, Mpigiin the West, Masaka in the South-West and Kalangala in the South. It surrounds Kampala district and absorbs the social-economical stresses associated with urban establishments such as slums, poorly planned structures and heaps of garbage [18]. The district covers a total of 2704.55 km2 out of which 1710.45 km2 is land area while a total of 994.10 km2 is covered with forests, water and swamps. The district has a total of 104 government aided health facilities of which 65 are purely public and 39 are (Nongovernmental organizations (NGOs). About 45% of the district population is within 5 km of these facilities. The district has a projected population of 1,260,900 (District Population Office, 2011). The population comprises of 254,520 children below five years of age out of which 54,180 are aged below one year. In Wakiso district, ICCM was launched in September 2010 and the implementation begun in February 2011 after training two VHTs per village to help in implementation of the program at the village level. All sub counties in the district are implementing the program and each parish is under the supervision of a parish coordinator who was trained before under taking the coordination role.
2.2. Study Design
A cross sectional survey was used to determine the level of client satisfaction with Integrated Community Case Management in Wakiso district. Care givers of children aged less than five years who had used Integrated Community Case Management (ICCM) services in Wakiso district were interviewed.
2.3. Sample Size Calculation
The sample size was based on Kish Leslie’s formula for cross sectional studies

Where, N = Number of respondents needed, p = Estimated proportion of households who have used ICCM services. In this study, 50% which is worst scenario was used since there is no study done on the quality of ICCM services to ourknowledge, Z is 1.96 (the Z score corresponding to 95% confidence interval), d = Maximum error the researcher is willing to allow = 0.05

Using a non response rate of 20% which was reported in the first implementation survey on ICCM [19] the final sample size was 462. At final analysis, a total of 454 respondents were considered after eight other questionnaires were found to be incomplete.
2.4. Survey Instruments
We used the modified SERQUAL tool for the study. Tools were pretested on 20 respondents from 4 villages which were not part of the study area. The tools were subsequently modified where necessary. The SERVQUAL tool is used to measure service satisfaction by assessing five dimensions (reliability, responsiveness, ICCM related factors, empathy and assurance) of a service provided. Although originally developed as a marketing tool, it has been adapted by many authors for use in assessing patient satisfaction with health care. A diversity of areas of health care have been studied using SERVQUAL, including general health services; eye treatment; comparing group and solo clinic practices; chronic kidney disease screening [20]. Most of these studies identified SERVQUAL as being useful in measuring service quality and client satisfaction and have recommended its use.
2.5. Data Collection
Quantitative methods were used whereby an interviewer administered questionnaire was used. The SERVQUAL tool (Parasuraman et al. 1988) was adapted for use in this study as a data collection tool in form of a structured questionnaire. The questionnaire was translated back and forth into Luganda which is the commonest local language spoken in the study area.
Two languages were used (English and Luganda). The questionnaire in English was translated into Luganda and then back translated into English by different social scientists from the faculty of social science and languages at Makerere University. English is Uganda’s national language for official business, where as Luganda, is the most widely spoken local languages in the study area. Luganda was used as an alternative to English as per the respondent’s choice. The questionnaire consisted of service factors (assurance, responsiveness, empathy, reliability) and ICCM related factors. For each question, expectations and perceptions were included. Expectations of the clients with regards to the service can vary considerably based on a range of factors such as prior experience, personal needs and what other people may have told them. Although in the original tool half of the items are worded positively and the rest negatively (these have to be reverse coded for analysis), in this study all items were worded positively because this made it easier to understand and explain the tool and reduced on errors while using it. Also in the original tool, both sets of items were presented in seven-point likert response format, which ranged from “strongly agree” (7) to “strongly disagree” (1). However for this study, SERVQUAL was adapted to a five-point likert scale, which ranged from “strongly agree” (5) to “strongly disagree” (1). The neutral point was 3, above which a person was satisfied with an item and below which they were dissatisfied. Then, dimensions were weighted and the score for each dimension multiplied by the weighting. For each statement there is the mean Expectation (E) and Perception (P) value and the quality value calculated using the formula Q = P-E to determine the service gap. The minimum mean score that a statement can record is one with a maximum of five. The midpoint of the scale was three, which implied a neutral opinion on the statement. Mean scores higher than three showed that the respondents agreed with the statement, while mean scores lower than three showed disagreement with the statement. A negative gap score indicated that the actual service (the perceived score) is less than expected (the Expectation score) hence dissatisfaction. Positive scores indicated that clients were satisfied with ICCM services. Overall client satisfaction was also determined by including a question at the end of the questionnaire asking about the clients’ overall satisfaction.
2.6. Data Analysis
Data were exported to STATA version 10 for final analysis. Continuous variables were tested using paired ttest. Multivariable analysis was done using logistic regression to determine the influence of socio demographic characteristics on client satisfaction.
2.7. Analysis per Objective
Objective 1:
Respondents baseline characteristics were described by calculating frequencies, percentages, means and medians. At the univariate analysis level, differences in distribution of respondents characteristics and satisfaction were analyzed. Statistical significance was measured with an alpha of 5% (p < 0.05). The total perception scores for all respondents were calculated and then divided by 25, which was the number of items in the questionnaire, in order to get an average. Therefore, the average score could range from 1 to 5. This was done for each item. The same was done for the expectation scores. Client satisfaction was then calculated by subtracting average expectation scores from average perception scores for each client interviewed to get a service quality gap score (mean scores analysis). Negative figures showed that clients experienced dissatisfaction, while gap scores equal to or above zero were positive, showing satisfaction. Pairedt-tests were used to check whether the difference between the means of expectations and perceptions was significant. Statistical significance was measured with an alpha of 5% (p < 0.05).
Objective 2:
Expectations and perceptions were categorized into the five service dimensions of SERVQUAL. Quality along each of the five dimensions was assessed by averaging the difference scores on items (mean scores analysis). This showed the effect of each dimension and each item on client satisfaction. Paired t-tests were done to establish whether the gap between expectation and perception scores was different overall, within the dimensions and by comparing items (p < 0.05).
Objective 3:
Bivariate analysis was done to evaluate the associations between the outcome variable (client satisfaction) and each socio-demographic characteristic. The alpha of 10% (p < 0.1) was used in order to have less restriction for variables that would be used at the multivariable level. 95% confidence intervals were used at this stage. Because all independent variables were categorical they were broken down into dummy variables, to ensure that the different categories were analyzed separately. This was done so in order to avoid missing out on important information since some of the categories could be statistically significant even if the variable when taken as one might not be. Multiple logistic regressions gave results as odds ratios. For these analyses, statistical significance was determined by an alpha of 5% (p < 0.05) and 95% confidence intervals. Confounding was checked for by observing whether variables included in the model caused a change in the odds ratio of the main exposure by at least 10%. Another method was by checking whether a variable that was insignificant at the bivariate stage became significant at the multivariable level.
2.8. Ethical Considerations
The study was approved by the Higher Degrees, Research and Ethics Committee at Makerere University School of Public Health on behalf of the Uganda National Council for Science and Technology. Permission to conduct the research was got from the Wakiso District Health Officer and finally written informed consent from participants themselves. The study involved minimal risks and privacy was ensured by carrying out interviews in a place free of other people apart from the respondent. Respondents were told that the data that was to be obtained would be used for research purpose not any other purpose and the purpose and the background of the study was explained to the respondents before obtaining a written consent from them. Confidentiality of data was kept by using identification numbers rather than names and limiting access to the data.
3. RESULTS
The response rate for this study was 98.3%. As shown in Table 1, the final number used in the analysis was 454 respondents, of which the majority 157 (34.6%) were Catholics and 102 (22.5%) were protestants. The majority of the children 250 (55.1%) who used ICCM services were females compared to and 139 (29.7%). Of the respondents who participated in the study only 7 (1.5%) were employed as public servants. The respondents’ age was categorized into intervals in order to identify any differences within the groups. Respondents’ ages ranged from 18 to 60 years with mean age of 30.8 (SD 7.3). In regard to education status, there were 211 people (46.48%) who had attained secondary as their highest level of education. There was no procedure for selecting certain age during the interview but care takers of the children who had used ICCM services were interviewed irrespective of age. Many of the respondents 264 (58%) got to know ICCM services because the village health team member had visited them in their homes. The least
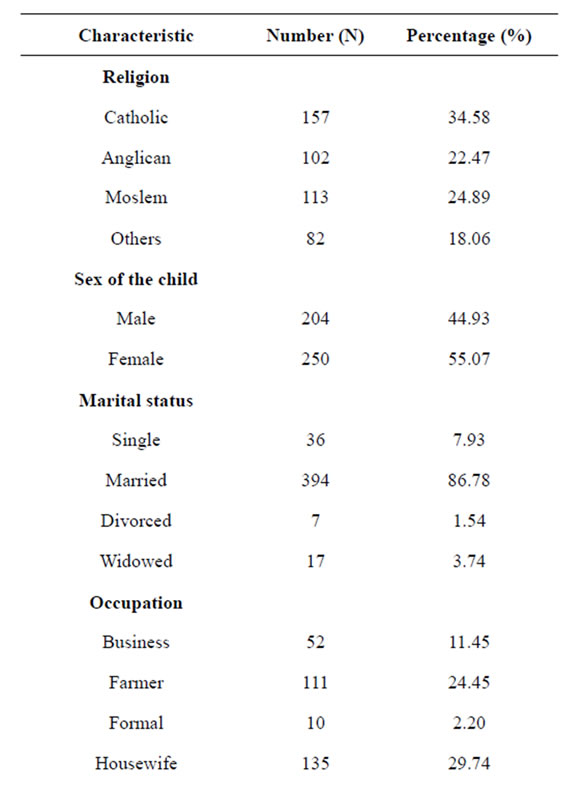
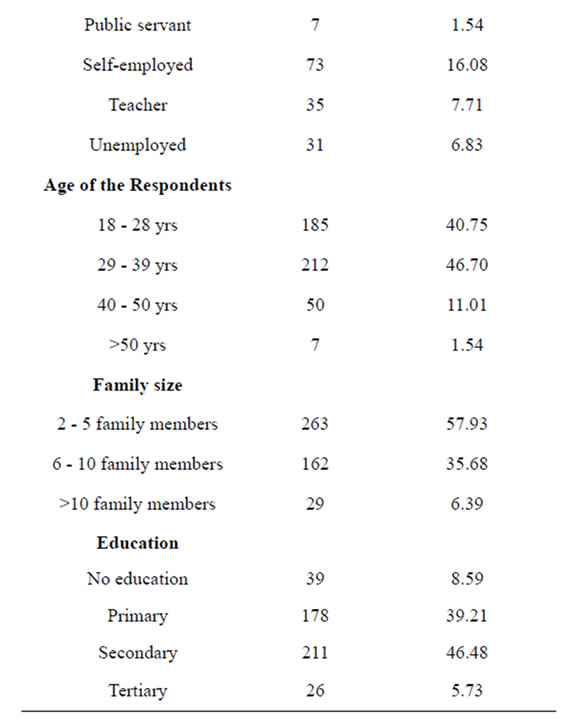
Table 1. Base line characteristics of the respondents (N = 454).
respondents 27 (5.9%) got ICCM information from other sources including the village meetings. More than three quarters of the respondents 394 (86.8%) were married and the majority of the respondents 263 (57.93%) had a family size ranging between two and five family members.
3.1. Perceptions
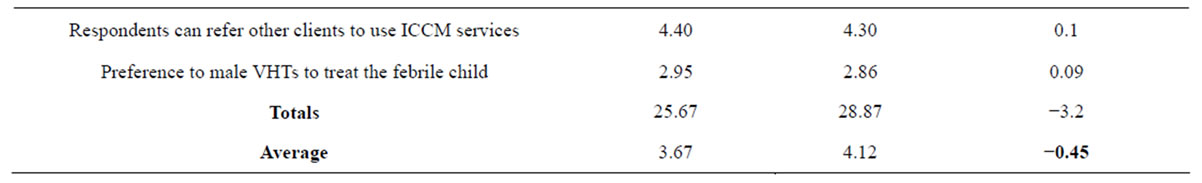
From Table 2, the highest perception score was 4.46 for the accurate record keeping by village health team members. The lowest score was 2.83 for home visits by village health team member providing ICCM services during treatment period. The average perception score given by the respondents was 3.9 meaning that on average, the majority of the respondents perceived the service quality as satisfactory. Almost all the mean perception scores were above the neutral opinion point apart from the statement on the preference for male village health team members and home visits made by the village health team members indicating that the majority of the respondents were satisfied with the statements.
3.2. Expectations
Overall, the highest expectation score was 4.54 for the Village Health Team members paying attention to sick children and the lowest was 2.86 for the preference to male Village Health Team member. The average expectation score for the respondents was 4.3.
3.3. Service Quality Gap
The overall satisfaction score was −0.34, showing that respondents were dissatisfied with services received under Integrated Community Case Management (ICCM) program. The gap scores were negative for eighteen items, indicating dissatisfaction on the respondents’ part. These were the items like; VHTs keeping promises, security of the clients, confidence to treat the febrile children, say exact time for services, prompt service from VHTs, availability of VHTs to treat the sick children, reassurance, understanding the specific needs of the children and knowledge to treat the sick children. The rest of the eight gap scores were positive indicating satisfaction. The worst scores were “accurate record keeping at 0.03 and the best score was at 0.48 for “VHTs being courteous”.
3.4. Reliability
Overall scores for perception and expectation were 3.95 and 4.44 respectively with a −0.49 gap score which is a reflection of dissatisfaction with reliability aspects of the SERVQUAL. This dimension had the largest service gaps indicating that respondents were the least satisfied with it.
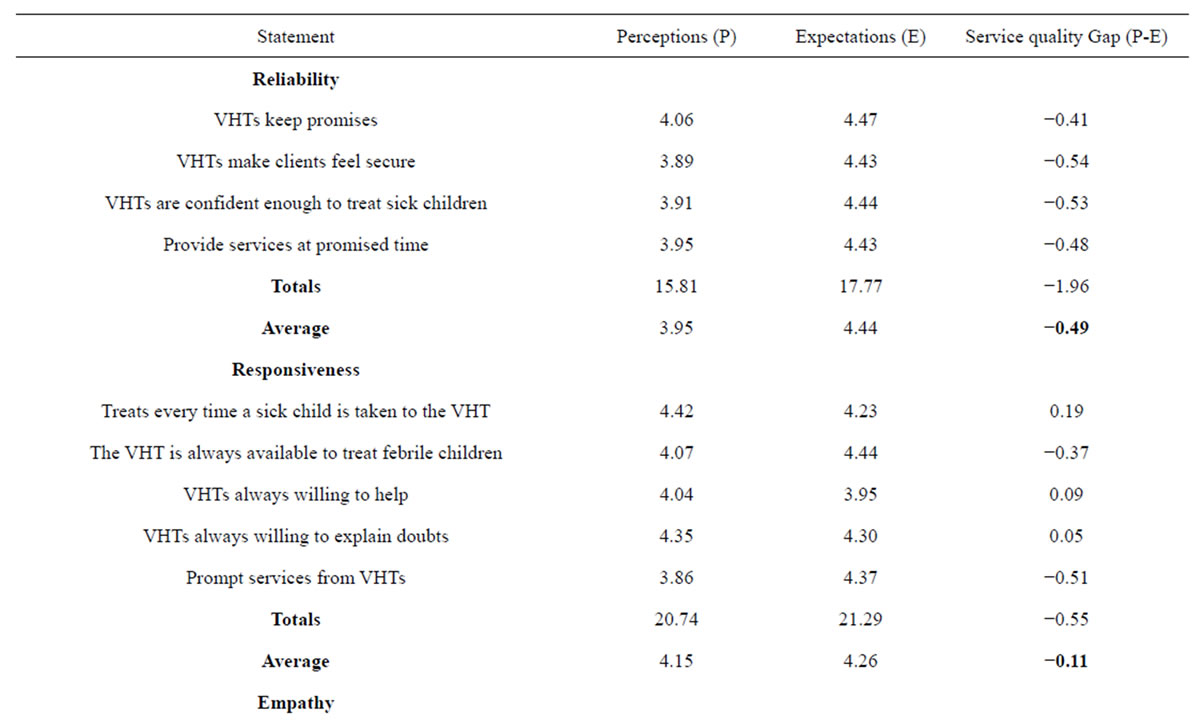
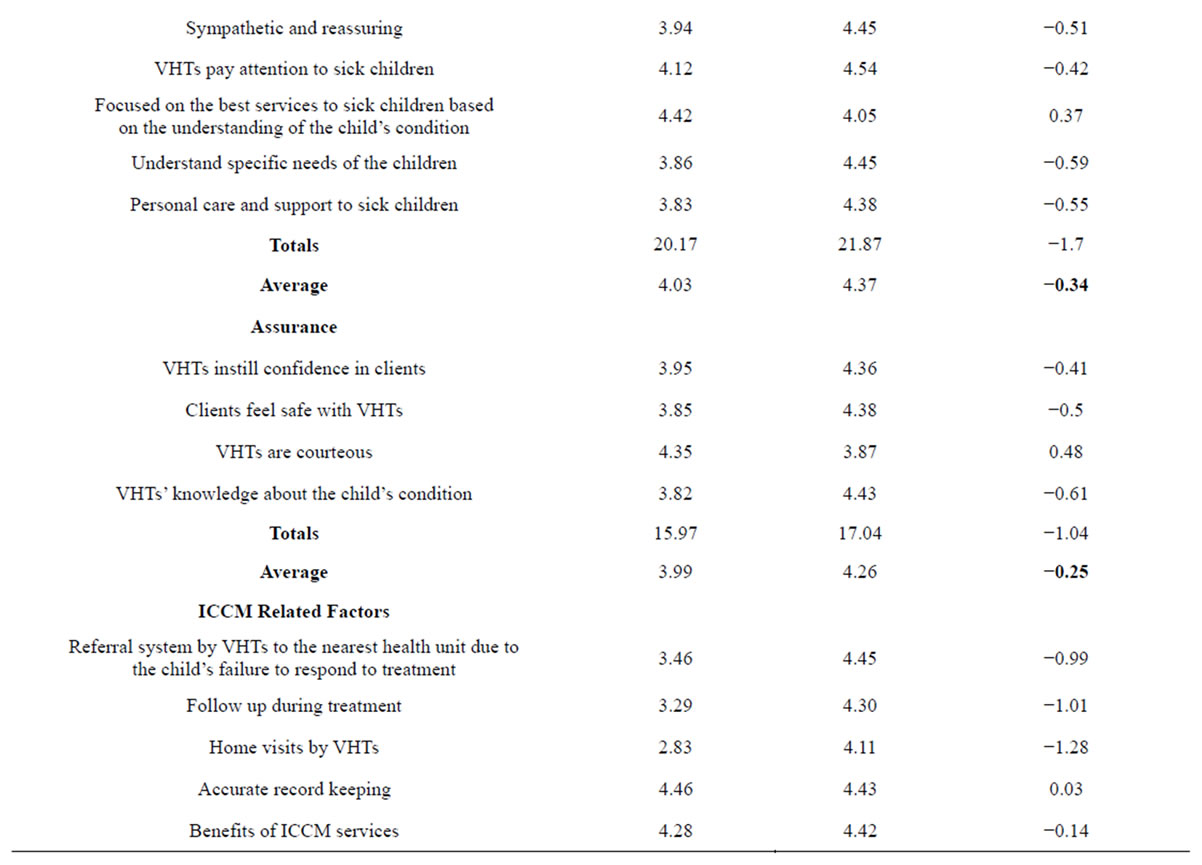
Table 2. Client satisfaction with various dimensions of SERVQUAL.
Continued
3.5. Responsiveness
Respondents in this dimension had an average of 4.15 for perceptions, 4.26 for expectations and a service gap of −0.11. This dimension had the least service gap which is a reflection that respondents were more satisfied with this dimension compared to the rest of the dimensions. However, respondents were satisfied with many of items on this dimension including the willingness of VHTs to help febrile children, treatment of febrile children everytime a sick child is taken to them and VHTs’ willingness to explain doubts.
3.6. Empathy
The overall average perceptions for empathy was 4.03, with expectations at 4.37 and a service gap of −0.34 indicating that respondents were also dissatisfied with this dimension. However, respondents were satisfied with the way village health team members focused on the best services to sick children with a gap score of 0.37.
3.7. Assurance
Also, respondents expressed dissatisfaction with this dimension of integrated community case management services. They showed dissatisfaction with this dimension as shown by the gap score of −0.26 (perceptions 3.99 and expectations 4.26). However, the respondents were satisfied with the courtesy they received from the village health team members.
3.8. ICCM Related Factors
The ICCM factors were the specific factors of emphasis identified as key factors in implementing the program that are to guide the village team members. The respondents were also dissatisfied with almost all factors apart from accurate record keeping and preference for either male or female VHT. Perceptions were rated at 3.67, expectations at 4.12 with −0.45 as the service gap. This dimension had the second largest service gaps indicating that respondents were the least satisfied with most of ICCM related factors.
3.9. Paired T-Tests
For the researcher to find out whether the gaps between average perception and expectation scores for the dimensions were significantly different, paired t-tests were done. Statistical significance was determined at p < 0.05.
From Table 3, it was realized that there was a significant difference between perceptions and expectations for one dimension reliability. In addition, the overall gap difference was also found to be statistically significant. This means that the clients could be in position to receive any service irrespective of its quality and this could be attributed to either high levels or not knowing the kind of quality services they are to receive.
In the questionnaire, a question asking about the overall client satisfaction was asked. The question was not on a likert scale like the rest of the questions. Respondents were asked whether or not they were satisfied with ICCM services. Overall, about 80% were satisfied with the ICCM services. Respondents who were not satisfied were asked by the interviewer for their reasons why they were not satisfied. For those who were not satisfied (20%), reasons for their dissatisfaction included; drug stock outs, unavailability of VHTs on some days, doubt on the professionalism and technical competence of the providers (VHTs) and others felt that the village health team members were not competent in understanding children’s illnesses.
To determine the influence of socio demographic factors on client satisfaction (Table 4), a multivariable analysis was conducted. Age was the first variable to be entered in the model and it was found not to be statistically significant to client satisfaction. Although it reduced the p value from 0.711 to 0.143, family size was statistically associated with client satisfaction. On adding sex of the child, family size remained statistically significant (p = 0.019). Education had no major effect on client satisfaction. While education decreased the odds ratio of family size, still family size was statistically significant. The category under religion that was significant at bivariable level (Muslims) remained so, with an odds ratio of 2.98 (95% CI 1.401 - 6.804) and p-value of 0.005. Primary level education also remained statistically significant at multivariable level with an odds ratio 2.8 (95% CI 1.124 - 6.804) and p value 0.02.
4. DISCUSSION
Overall, 80% care givers of children were satisfied with integrated community case management. However,
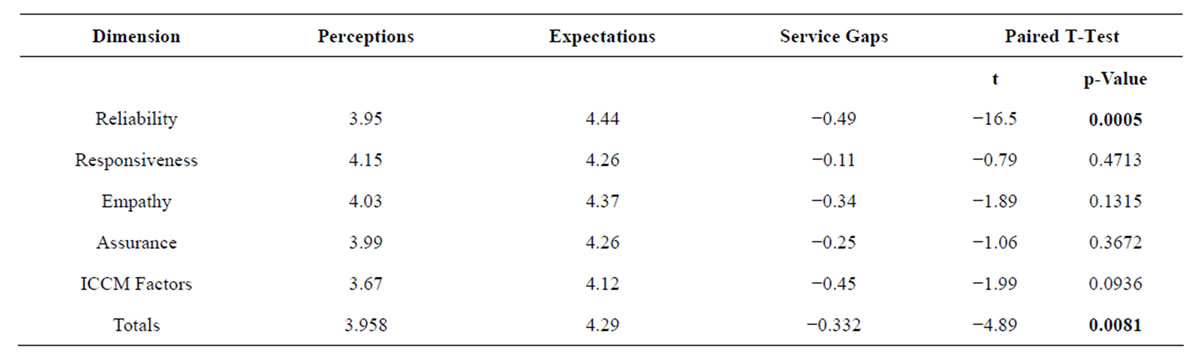
Table 3. Paired t-tests for client satisfaction dimensions.
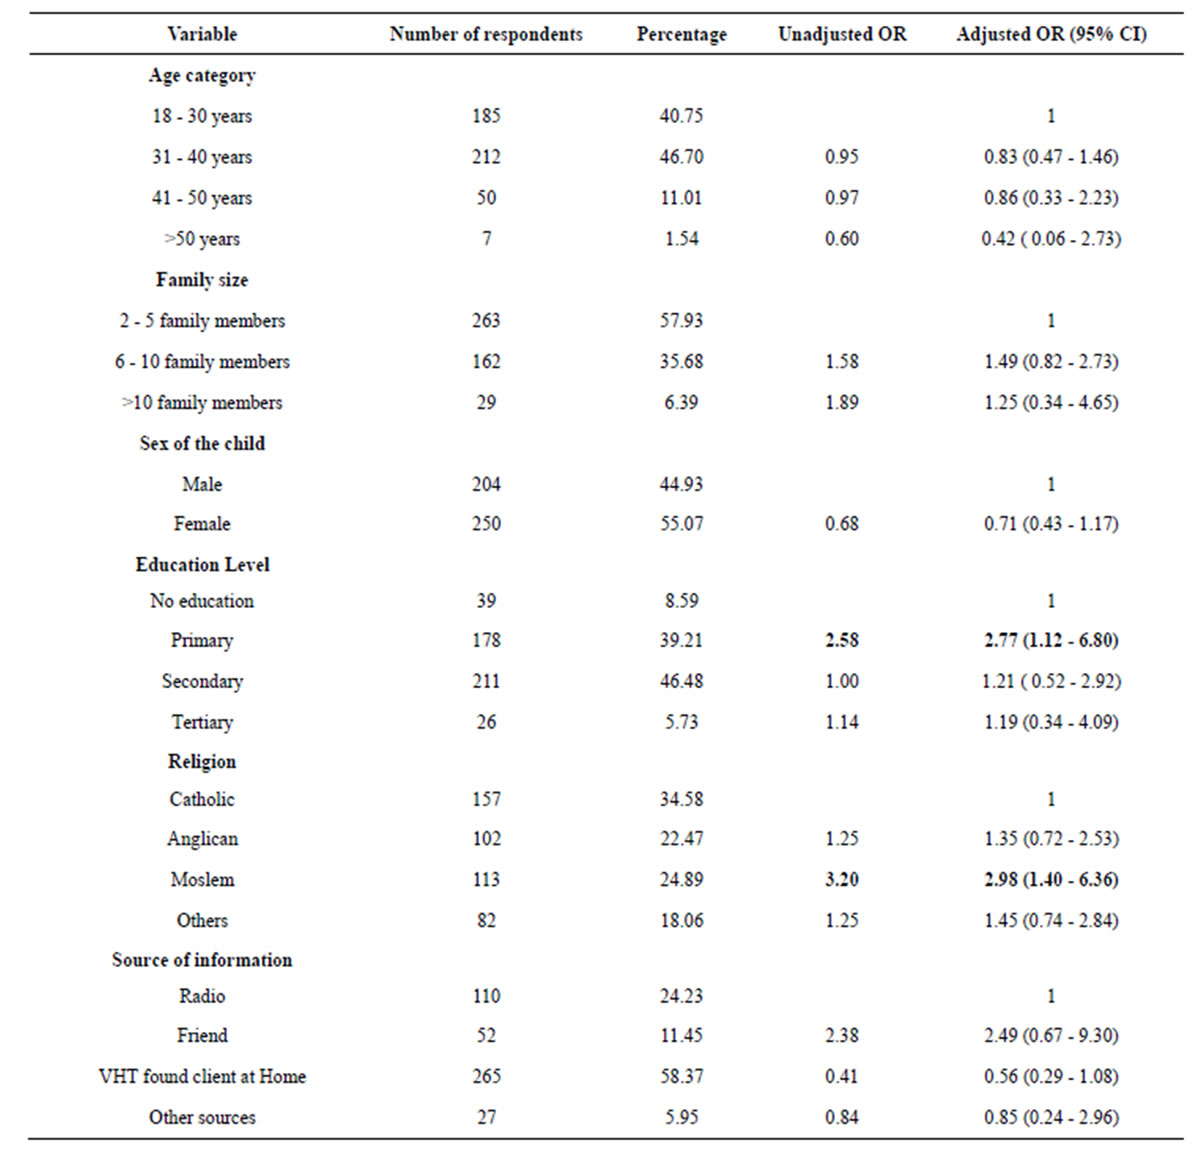
Table 4. Multivariable model showing factors affecting client satisfaction with ICCM program.
the difference between expectations and perceptions were not statistically significant for different dimensions of service quality as shown by mean scores of different dimensions. For perceptions and expectation not being statistically different means that irrespective of the quality of the services, clients use any available services and this could be attributed to both poverty levels and inadequate understanding of what constitutes quality by clients. The high number of negative service quality gaps (P-E) demonstrates quite significant similarities from similar studies. For example, [21] reported negative service quality gaps (P-E) for all generic areas of service quality, except for reliability. Regarding the high levels of satisfaction also, there is a risk of an acquiescence and a social desirability bias that may have resulted in an overreporting of satisfied patients [22,23]. Another explanation could be the use of the single-item questions. Most patients tend to give positive answers if they are asked how satisfied they were [24] even if they have complaints about specific aspects of the received care [25].
The mean general client satisfaction score ranged between, 2.83 to 4.54 based on a scale ranging from 1 (low satisfaction) to 5 (high satisfaction), suggesting that there is need for improvement. Studies conducted in a variety of developing country settings [26-28] showed mixed results on levels of general satisfaction. The inconsistent findings are not surprising, since there are not only large differences in how care is provided across settings, but clients have very different experiences and expectations. The study was conducted in a community setting, where clients may have higher expectation of the services than could be realistically met, thus resulting in negative gap scores.
The research revealed there was a gap between clients’ expectations and perceptions of the service quality provided by VHTs in Wakiso district. Even though the gaps between expectations and perceptions seem to exist, a paired sample t-test revealed that except for reliability, every other gap was not statistically significant. This means that the gap between perceptions and expectation may not be truly negative as indicated by statistical insignificant results using a t-test hence showing that the clients are satisfied with ICCM services.Indeed, the relationship between different dimensions and satisfaction with care remains unclear [23,29]. Several studies have reported differing results, depending on whether functional or symptom scales were considered in determining client satisfaction hence underlining the complexity of patient satisfaction interpretation.
5. LIMITATIONS OF THIS STUDY
Clients’ evaluations are often subjective and therefore, it is debatable whether their ratings are truely technical quality or the providers’ interpersonal skills. Nonetheless, the findings of the study collude on important gaps which need to be addressed in order to strengthen the program. The cross sectional design also gives a snap shot of events yet client satisfaction is likely to vary from one visit to another depending on a number of external factors including drug shortage at the time of the study and also personal factors that may not be related to program which the provider could have been going through at the time of the study.
6. CONCLUSION
Generally, 80% of the clients were satisfied with ICCM services and there was no statistical significant difference between perceptions and expectations for all the dimensions except for reliability dimension. The results revealed that there was a quality gap in services provided. Therefore, this study serves as a starting point for further research on service quality in the services provided at a community level.
7. CONTRIBUTIONS
NT conceived, designed, conducted and analyzed data in this study. He also wrote the manuscript. The other authors (ER and KD) were jointly responsible for study concept and writing the manuscript. Authors JB and AM contributed in writing the manuscript.
8. ACKNOWLEDGEMENTS
This research/publication was made possible by Uganda Malaria Clinical Operational and Health Services (COHRE) Training Program at Makerere University, Grant #D43-TW00807701A1, from the Fogarty International Center (FIC) at the National Institutes of Health (NIH) its contents are solely the responsibility of the authors and do not necessarily represent the official views of FIC or NIH. We acknowledge the support of community leaders, District Health Team Wakiso, research assistants and individual participants.
REFERENCES
- WHO (2008) Global burden of disease: 2004 update. Geneva.
- Nicoll, A. (2000) Integrated management of childhood illness in resource-poor countries: an initiative from the World Health Organization. Transactions of the Royal Society of Tropical Medicine & Hygiene, 94, 9-11. http://dx.doi.org/10.1016/S0035-9203(00)90418-8
- Black, R., Morris, S. and Bryce, J. (2003) Where and why are 10 million children dying every year? Lancet, 261, 2226-2234. http://dx.doi.org/10.1016/S0140-6736(03)13779-8
- Byakika-Kibwika, P., et al. (2010) Update on the efficacy, effectiveness and safety of artemether-lumefantrine combination therapy for treatment of uncomplicated malaria. Journal of Therapeutics and Clinical Risk Management, 2, 11-20.
- MOH (2010) Uganda ministry of health: Annual health sector performance report. M.O. Health, Kampala.
- Lynch, K.I., et al. (2005) President’s malaria initiative. Rapid Assessment Report, Uganda. http://www.fightingmalaria.gov/countries/mops/assessments/uganda_assessment.pdf
- Mulholland, K. (1999) Magnitude of the problem of childhood pneumonia. Lancet, 6736, 590-592.
- Reyes, H., Pérez-Cuevas, R., Salmeron, J., Tome, P., Guiscafre, H. and Gutierrez, G. (1997) Infant mortality due to acute respiratory infections: The influence of primary care processes. Health Policy Plan, 12, 214-223. http://dx.doi.org/10.1093/heapol/12.3.214
- Kosek, M., Bern, C. and Guerrant, R. (2003) The global burden of diarrhoeal disease, as estimated from studies published between 1992 and 2000. Bulletin of the World Health Organization, 81, 197-204.
- WHO (2007) Weekly epidemiological record. 285-296.
- Binka, F., et al. (2003) Incidence and risk factors of paediatric rotavirus diarrhoea in northern Ghana. Tropical Medicine & International Health, 8, 840-846. http://dx.doi.org/10.1046/j.1365-3156.2003.01097.x
- Parashar, U., Bresse, J. and Glass, R. (2006) Rotavirus and severe childhood diarrhea. Emerging Infectious Diseases, 12, 304-306. http://dx.doi.org/10.3201/eid1202.050006
- WHO (2008) Global networks for surveillance of rotavirus gastroenteritis. Weekly Epidemiological Report.
- MOH (2010) Uganda ministry of health: Integrated community case management of childhood malaria, pneumonia and diarrhoea. Implementation Guidelines, Kampala.
- Rutebemberwa, E., et al. (2009) Utilization of public or private health care providers by febrile children after user fee removal in Uganda. Malaria Journal, 14, 45. http://dx.doi.org/10.1186/1475-2875-8-45
- Yeka, A., et al. (2011) Malaria in Uganda: Challenges to control on the long road to elimination I. Epidemiology and current control efforts. Acta Tropica, 121, 184-195.
- Rutebemberwa, E., et al. (2009) Determinants of delay in care-seeking for febrile children in eastern Uganda. Tropical Medicine & International Health, 14, 472-479. http://dx.doi.org/10.1111/j.1365-3156.2009.02237.x
- Uganda Bureau of Statistics (2005) The 2002 Uganda population and housing census. U.B.O. Statistics, Kampala.
- Malaria Consortium Uganda (2011) Malaria consortium disease control. Better Health. http://www.malariaconsortium.org/userfiles/file/Uganda/MC_UGD_Brochure%20Web.pdf
- Hall, J. and Dornan, M. (1990) Patient sociodemographic characteristics as predictors of satisfaction with medical care: A meta-analysis. Social Science & Medicine, 30, 811-818. http://dx.doi.org/10.1016/0277-9536(90)90205-7
- Ferguson, J.M. and Higgins, L.F. (1999) A gap analysis of HOM service quality. Health Marketing Quarterly, 16, 1-15. http://dx.doi.org/10.1300/J026v16n02_01
- Nguyen, V.F., et al. (2011) Determinants of patient satisfaction in ambulatory oncology: A cross sectional study based on the OUT-PATSAT35 questionnaire. BMC Cancer, 11, 526. http://dx.doi.org/10.1186/1471-2407-11-526
- Sitzia, J. and Wood, N. (1997) Patient satisfaction: A review of issues and concepts. Social Science and Medicine, 45, 1829-1843. http://dx.doi.org/10.1016/S0277-9536(97)00128-7
- Van Campen, C., Sixma, H. and Kerssens, J. (1997) Assessing noninstitutionalized asthma and COPD patients’ priorities and perceptions of quality of health care: The development of the QUOTE-CNSLD instrument. Journal of Asthma, 34, 531-538. http://dx.doi.org/10.3109/02770909709055397
- Epstein, K., Laine, C. and Farber, N. (1996) Patients’ perceptions of Office Medical Practice: judging quality through the patients eyes. American Journal of Medical Quality, 11, 73-80. http://dx.doi.org/10.1177/0885713X9601100204
- Hansen, P., Peters, D. and Viswanathan, K. (2008) Client perceptions of the quality of primary care services in Afghanistan. International Journal for Quality in Health Care, 20, 384-391. http://dx.doi.org/10.1093/intqhc/mzn040
- Andaleeb, S., Siddiqui, N. and Khandakar, S. (2007) Patient satisfaction with health services in Bangladesh. Health Policy Plan, 22, 263-273. http://dx.doi.org/10.1093/heapol/czm017
- Mendoza, et al. (2001) Client satisfaction and quality of health care in rural Bangladesh. Bulletin of the World Health Organization, 79, 512-517.
- Westaway, M.S. and Rheeder, P. (2003) Interpersonal and organizational dimensions of patient satisfaction: The moderating effects of health status. International Journal for Quality in Health Care, 15, 337-344. http://dx.doi.org/10.1093/intqhc/mzg042
NOTES
1These commodities include Amoxicillin for the treatment of nonsevere pneumonia, Artemisinin-based Combination Therapy (ACTs) for uncomplicated malaria, Low-osmolality ORS for diarrhea, Zinc for diarrhea, Rectal Artesunate for pre-referral patients, Diagnostic commodities like respiratory timers and MUAC tape.