Journal of Modern Physics
Vol.3 No.8(2012), Article ID:21679,4 pages DOI:10.4236/jmp.2012.38108
Photoluminescence Compounds ZnGa2Se4 and ZnGa2Se4:Eu2+
1Institute of Physics of Azerbaijan NAS, Baku, Azerbaijan
2Lomonosov Moscow State University Campus in Baku, Baku, Azerbaijan
3Institute of Chemistry Azerbaijan NAS, Baku, Azerbaijan
Email: sasadullayeva@mail.ru u
Received May 7, 2012; revised June 1, 2012; accepted June 31, 2012
Keywords: Ternary Chalcopyrite; Photoluminescence; Rare-Earth Elements
ABSTRACT
Photoluminescence (PL) spectra measurements have been carried out in the ternary chalcopyrite semiconductor compounds ZnGa2Se4 and ZnGa2Se4:Eu2+ using single-wavelength excitation of a Hg lamp with l = 365 and 375 nm. Measurements were performed at the temperature range of (120 - 220 K) and (110 - 230 K) for ZnGa2Se4 and ZnGa2Se4:Eu2+, respectively. No PL was observed for both crystals at the temperatures higher than 220 K (ZnGa2Se4) and 230 K (ZnGa2Se4:Eu2+). At temperatures lower than ~220 K and ~230 K one and three lines were observed for ZnGa2Se4 and ZnGa2Se4:Eu at 591 nm and 566, 591, 646 nm, respectively. 566 nm line was assigned as due of the 4f65d → 4f7(8S7/2) transition of Eu2+ ions, whereas the rest two lines were attributed to the donor-acceptor recombination pairs. Probability of non-radiation transfers (A = 108 - 109 s−1), energy of optical phonons (hw = 25 - 30 meV), Huan Rice parameter (S = 8 - 10), energy of thermal quenching (DE = 0.02 - 0.06 eV) were determined from the temperature dependences of the full width at half maximum (FWHM = Г(T)).
1. Introduction
ZnGa2Se4 belongs to the group  compounds (where A-divalent cations of Zn, Cd; B-trivalent cations of Ga, In, Al, but C-chalcogens of S, Se, Te). Presence of birefringence, optical activity, major values of non-linear susceptibility coefficient, wide band gap, bright luminescence, high sensitivity is characteristic of these compounds. Above-mentioned properties propose these compounds to be prospective materials for semiconductive optoelectronics. ZnGa2Se4 has been first synthesized by author [1], X-ray analysis has been carried out. It is shown that ZnGa2Se4 crystallizes in tetragonal structure (space group
 ), lattice parameters a = 5.496 Å, c = 10.99 Å, c/a = 2.
Presence of ordered vacancy in cations sublattice is characteristic of the given structure. Optical and photoelectric properties of ZnGa2Se4 have been investigated in [2,3]. From reflection spectra at 300 K there has been first evaluated band gap of ZnGa2Se4 (2.58 eV). Later from optical absorption measurements close to the edge in polarized radiation at 300 K it is established that minimum optical transitions Г3 + Г4 → Г1 localized in the centre of Brillouin zone, are equal to 2.43 eV and resolved in polarization E ^ C. Physical properties also luminescent, optical, photoelectric and other properties of ZnGa2Se4 comparing with other compounds of group , for instance CdGa2S4, CdGa2Se4 and others have not been studied yet [4]. It is probably related to the difficulties of ZnGa2Se4 synthesis. This paper first deals with the investigation results of photoluminescence (PL) in ZnGa2Se4 and ZnGa2Se4:Eu polycrystals.
2. Experimental
ZnGa2Se4 was synthesized from high purity Zn (99.999%), Ga (99.999%), and Se (99.9999%). A stoichiometric elemental mixture was loaded into an ampule, which was then pumped down to 1.3 × 10⁻² Pa and placed in a furnace preheated to 950˚C ± 10˚C so that its tip was outside the furnace. When the body of the ampule reached the furnace temperature, vigorous reaction began. In the course of the reaction, the furnace temperature was gradually raised to 1150˚C and then maintained constant for 3 h to homogenize the melt. Next, the ampule was cooled to 500˚C ± 5˚C and held there for 24 h, followed by furnace cooling. The dopant was introduced into ZnGa2Se4 in the form of europium fluoride, EuF3. The samples were excited by the radiation from a PRK 4 mercury lamp at temperatures from 77 to 230 K. The sample temperature was monitored using a copper-constantan thermocouple and electronic potentiometer. PL spectra were measured on an SDL 1 spectrometer.
3. Results and Discussion
PL spectra of ZnGa2Se4 and ZnGa2Se4:Eu2+ in the temperature range of ~(120 - 220 K) and ~(110 - 230 K) are presented in Figures 1 and 2, respectively. No difference was detected when exciting the spectra with two different wavelengths at 365 and 375 nm.
Characteristic features of the temperature dependences of the PL spectra are as follows:
1) ZnGa2Se4:
a) no PL was observed at the temperatures higher than ~ 220 K.
b) one PL line appeared at ~220 K (591 nm, 2.10 eV) (Figure 1).
c) the intensity of PL line is linearly increased with decreasing the temperature as it is shown in Figure 3 (curve 1). The energy position of the PL line did not revealed noticeable temperature dependence up to ~120 K.
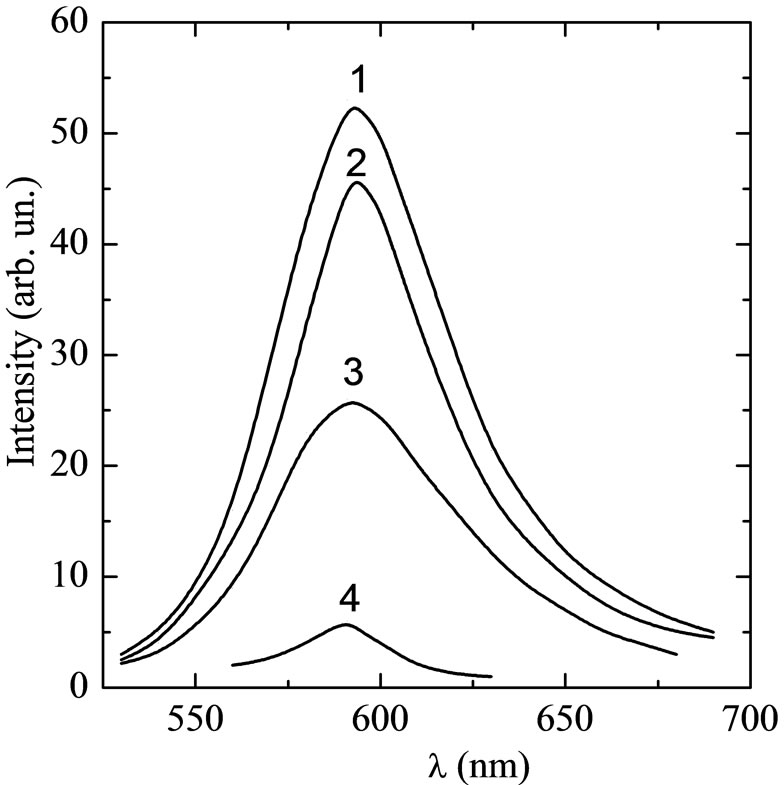
Figure 1. PL spectra of ZnGa2Se4 at various temperatures T (K): 1-120, 2-130, 3-148, 4-220.

Figure 2. PL spectra of ZnGa2Se4:Eu2+ at various temperatures T (K): 1-110, 2-157, 3-181, 4-198, 5-208, 6-215, 7-230.
d) the temperature dependence of the Г(T) of PL line is shown Figure 4 (curve 1).
2) ZnGa2Se4:Eu2+:
a) no PL was observed at the temperatures higher than 230 K.
b) three lines were detected at ~110 K with the maxima at 566 nm (2.19 eV), 591 nm (2.10 eV) and 646 nm (1.92 eV) (Figure 2).
c) the lines at 591 and 646 nm disappeared when the temperature of sample increased higher than ~120 K.
d) the temperature dependence of the intensity of 566 nm line revealed two linear regions with different slope (Figure 3, curve 2). It confirms existence of two energy levels in the forbidden gap of doped compound.
e) the energy position of the PL line at 591 nm did not revealed noticeable temperature dependence up to ~230 K.
f) the temperature dependence of the FWHM of PL line (566 nm at 110 K) is shown Figure 4 (curve 2).
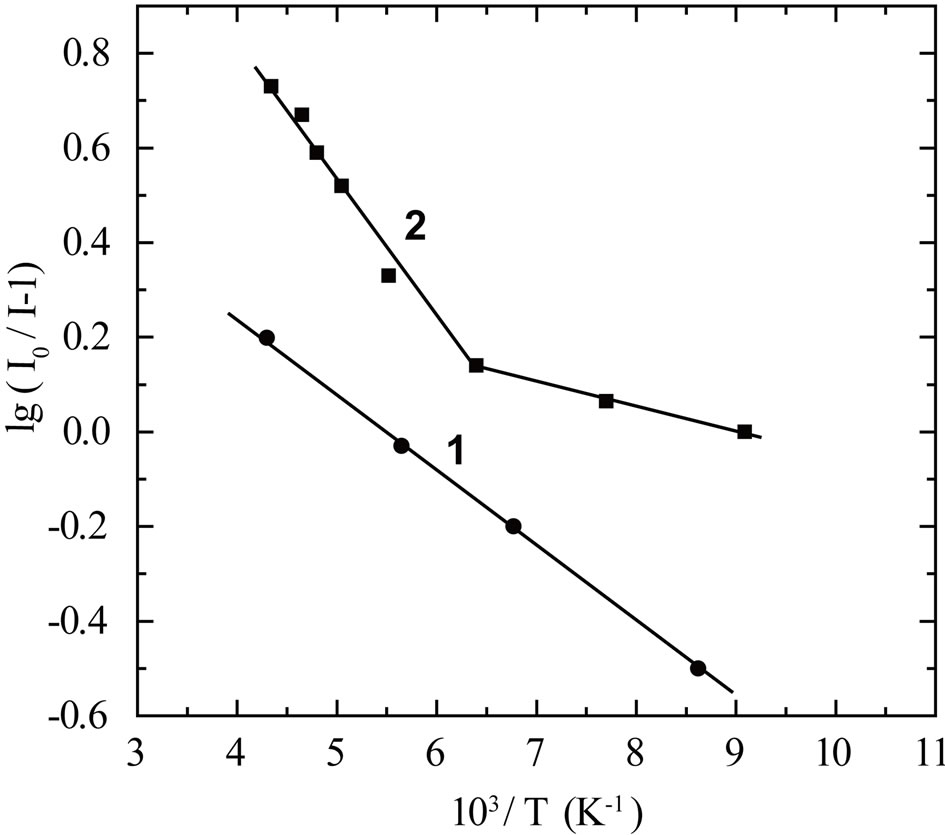
Figure 3. Temperature dependences of the PL intensity for ZnGa2Se4 (1) and ZnGa2Se4:Eu2+ (2) crystals.
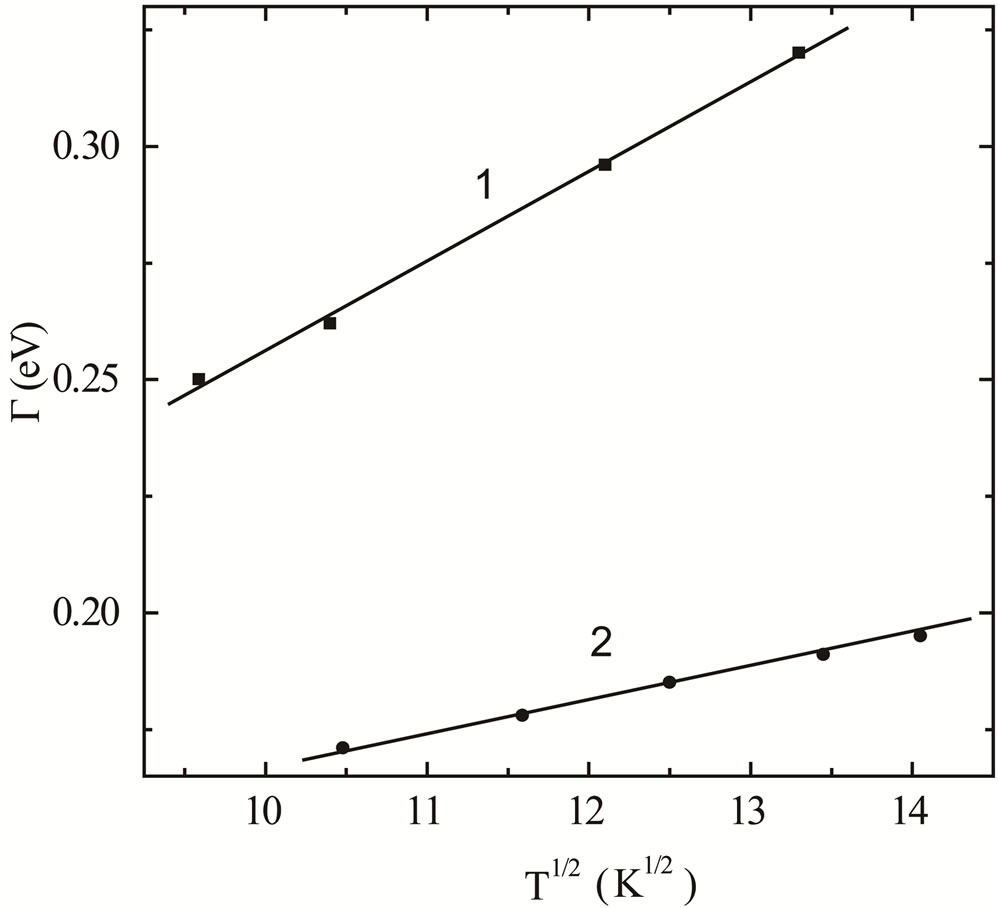
Figure 4. Temperature dependences of the FWHM of the most intense PL line (591 nm) for ZnGa2Se4 (1) and ZnGa2Se4:Eu2+ (566 nm at 110 K) (2).
It is seen that both samples revealed general characteristic features of the temperature dependences of the PL intensity. For both samples the intensity of PL lines decreased with increasing temperature. For ZnGa2Se4 effective PL was observed in the spectral range of 530 - 670 nm and for ZnGa2Se4:Eu2+ in the range of 530 - 630 nm. Г(T) of PL observed also increased with increasing temperature.
Analysis of obtained data showed that the PL maxima at 566 nm for ZnGa2Se4:Eu2+ is caused by the 4f65d → 4f7(8S7/2) transitions of Eu2+ ions, whereas maxima at 591 and 646 nm are due of the donor-acceptor pairs.
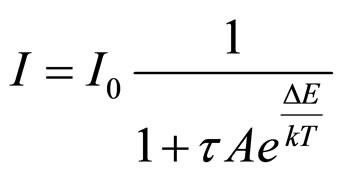
Temperature dependences of the intensity of PL lines for pure (591 nm) and doped compound (566 nm) were analyzed on the base of Mott theory and formula given in [4] and modified by the authors of [5]:
 (1)
(1)
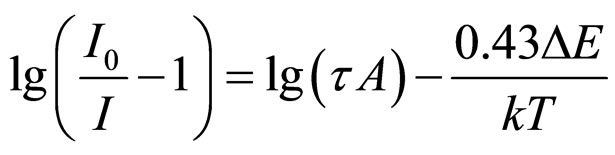
where I0—intensity at the temperature T at which no quenching takes place, t—average life time of Eu2+ ions in an excited states, A—probability of non-radioactive transfer, k—Boltsmann constant, DE is for the energy of quenching. Value of A is poorly temperature dependent, whereas t should not depend on temperature. In case of forbidden transitions increasing temperature leads to decrease t [5]. In this case formula (1) can be written as follows [5]:
 (2)
(2)
where notations are the same as in (1).
It follows from (2) that there is inverse linear dependence of lg(I0/I − 1) on T. For both compounds linear dependences of lg(I0/I − 1) on T is shown in Figure 3. Extrapolation of these dependences to 1/T → 0 gave the product of tA equal ~(500 - 1000) for both compounds. By using value t = 10−6 s given for Eu2+ in [6,7] a probability of non-radioactive transfer A » 108 ¸ 109 s−1 was estimated.
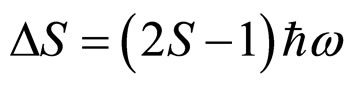
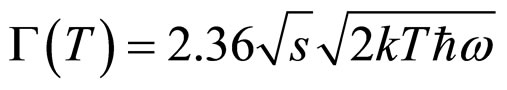
Analysis of the temperature dependences of Г(T) give an information about the mechanism of radiation transfer and a number of parameters characterizing it. Theoretical analysis of the experimental data of the absorption and emission spectra of solids allowed the author to derive the expressions for the temperature dependences of the Stokes shift (DS), Huan Rice factor (S), phonon energy (ħω) and the Г(T) [8-10]:
 (4)
(4)
 (5)
(5)
Comparison of the experimental data obtained in the present work (Figure 3) with those estimated with the formulaes (3) and (4) results to the next values of the Stokes shift DS » 0.5 eV, energy of the optical phonons ħω » (25 - 30 meV), Г(Т) » (0.14 - 0.18 eV) and Huan Rice factor S » (8 - 10). It is worth to mention that the energy of phonons estimated in the present work are in good agreement with those obtained for ZnGa2Se4 from Raman scattering measurements [10]. Analysis of existing experimental results on electric and photoelectric properties of pure and doped ZnGa2Se4 and results obtained in the present research allowed to suggest possible energy diagram of the optical transitions which is shown in Figure 5.
It should be noted that Huan Rice parameter reflects the most probable number of phonons which take part in the absorption and emission processes [11-13]. According to [11] in case of strong localization of principle wave function of the excited state and its blurring upper theoretical limit of Huan Rice factor S » 55 eV. In dependence on the degree of the wave function localization the S parameter varies in the range of S » 2 - 55 eV for different materials [11,12]. At present stage a reason for lower values of S obtained in the present work is not clear. One probably reason may be that in the ZnGa2Se4 and ZnGa2Se4:Eu2+ crystals degree of the wave function localization and its blurring is the lowest one when comparing with other materials. Further research is necessary to clarify this suggestion.
Analysis of our data show that the product of the PL maxima intensity Imax·Г(Т) does not depend on temperature B = Imax·Г(Т) = const (Figure 6).
Increase of the Imax·Г(Т) for both compounds may be qualitatively explained by the model suggested in [13] and presuming the formation of PL mechanism with the process in which phonons are playing an important role.
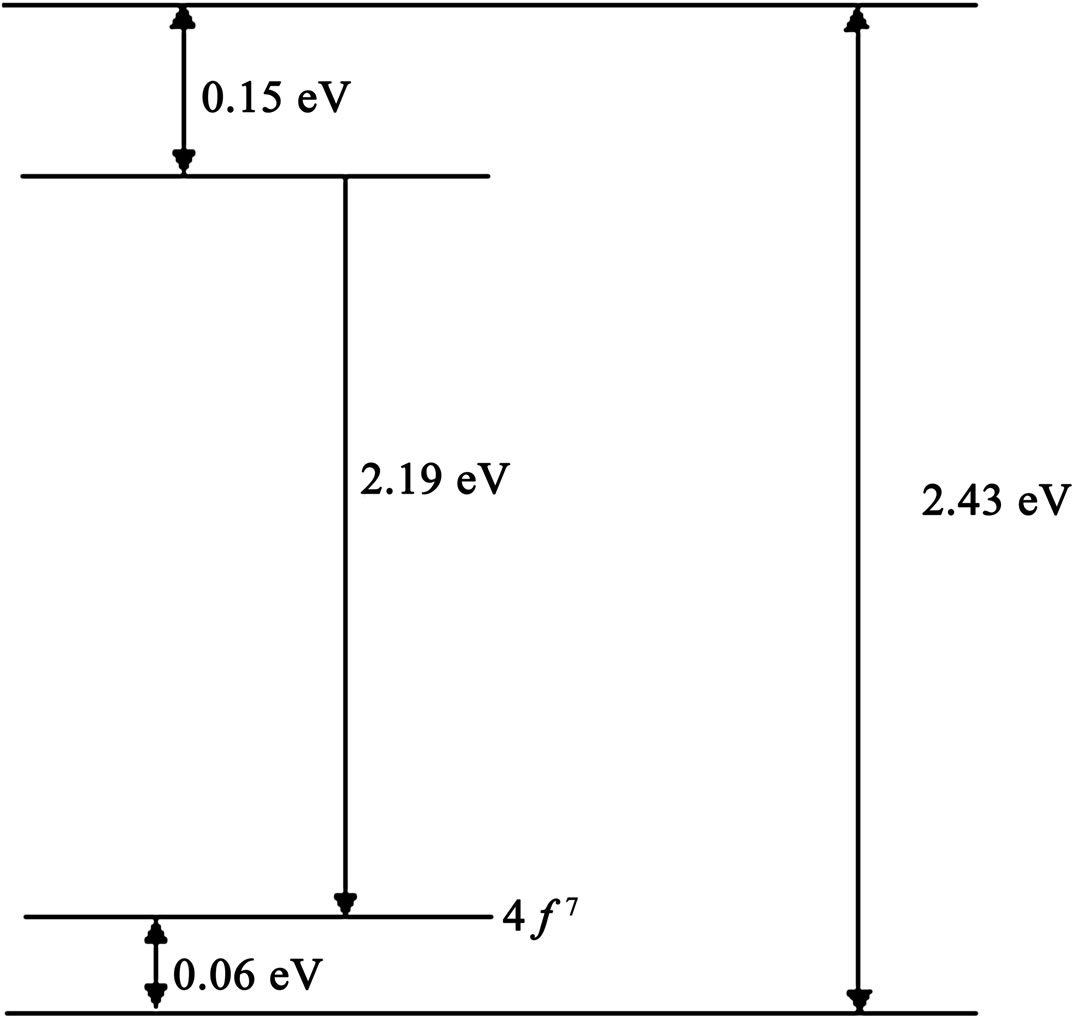
Figure 5. Energy diagram of the optical transitions for Eu2+ doped ZnGa2Se4 at 110K.
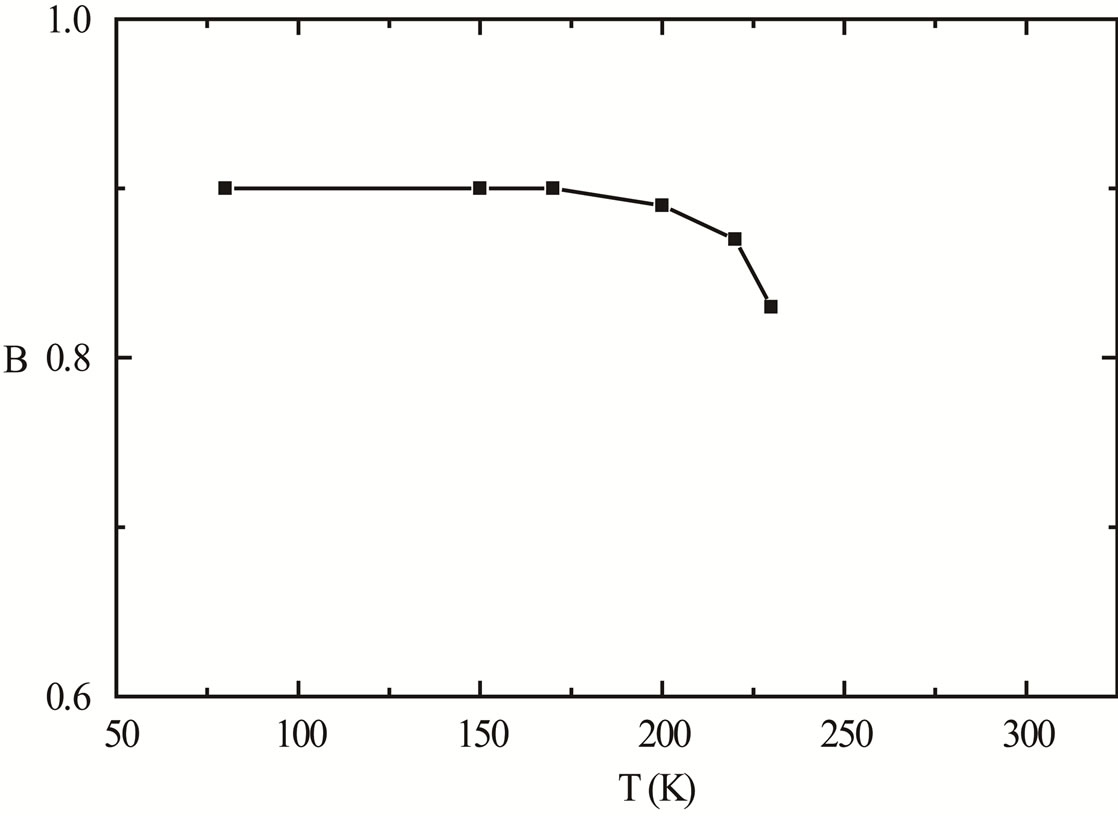
Figure 6. Temperature dependence of the product of the PL maxima intensity B = Imax·Г(Т) for Eu2+ doped ZnGa2Se4.
4. Conclusion
There has been synthesized ZnGa2Se4 compound, lattice parameters (a = 5.496 Å, c = 10.99 Å, c/a = 2) are determined, during the synthesis this compound is activated by Eu2+. In PL spectrum of ZnGa2Se4 maximum at 591 nm has been found out, in PL spectrum of ZnGa2Se4:Eu maxima at 566, 591 and 646 nm have been found out at 77 - 230 K in ZnGa2Se4 and ZnGa2Se4:Eu compounds. From analysis of temperature dependence Г(T) probability of non-radiative transfers (A = 108 - 109 s−1), energy of optical phonons ( = 25 - 30 meV), Huan Rice parameter (S = 8 - 10), energy of thermal quenching (
 E = 0.02 - 0.06 eV) have been determined. PL spectrum maximum of ZnGa2Se4:Eu at 566 nm is due to the transition 4f65d → 4f7(8S7/2) of Eu2+ ions, maxima at 591 and 646 nm are due donor-acceptor pair.
5. Acknowledgements
This work was supported by the Science Development Foundation under the President of the Republic of Azerbaijan—Grant No. EİF-2011-1(3)-82/01/1.
REFERENCES
- H. Hahn, G. Frank, W. Klinger, A. D. Störger and G. Störger, “Untersuchungen Über Ternäre Chalkogenide. VI. Über Ternäre Chalkogenide des Aluminiums, Galliums und Indiums mit Zink, Cadmium und Quecksilber,” Zeitschrift für Anorganische und Allgemeine Chemie, Vol. 279, No. 5-6, 1955, pp. 241-270. doi:10.1002/zaac.19552790502
- S. I. Radautsan, I. M. Tiginyanu, V. N. Fulga and Y. O. Derid, “Quasi-Continuously Distributed Traps and Photoluminescence in ZnGa2Se4 Single Crystals” Physica Status Solidi (a), Vol. 114, No. 1, 1989, pp. 259-263. doi:10.1002/pssa.2211140125
- T. G. Kerimova and A. G. Sultanova, “Preparation, Optical Absorption and Thermally Stimulated Conductivity of ZnGa2Se4,” Inorganic Materials, Vol. 38, No. 10, 2002, pp. 992-994. doi:10.1023/A:1020560801480
- K. R. Allakhverdiev, Z. Y. Salaeva and A. B. Orun, “TwoPhoton Absorption in CdGa2S4 and CdGa2S3.96Se0.04 Crystals,” Optics Communications, Vol. 167, 1999, pp. 95-98. doi:10.1016/S0030-4018(99)00279-5
- N. F. Mott and R. W. Gurney, “Electronic Processes in Ionic Crystals,” Clarendon Preess, Oxford, 1948.
- V. V. Antonov-Romanovskiy, “Kinetics of Crystallophosphorus Photoluminescence,” Nauka, Moscow, 1966.
- P. Benalloul, C. Barthou, C. Fouassier, A. N. Georgobiani, L. S. Lepnev, Y. N. Emirov, A. N. Gruzintsev, B. G. Tagiev, O. B. Tagiev and R. B. Jabbarov, “Luminescence of Eu2+ in Calcium Thiogallate,”Journal of The Electrochemical Society, Vol. 150, No. 1, 2003, pp. 62-65. doi:10.1149/1.1528945
- M. R. Davolos, A. Garcia, C. Fouassier and P. Hagenmuller, “Luminescence of Eu2+ in Strontium and Barium Thiogallates,” Journal of Solid State Chemistry, Vol. 83, No. 2, 1989, pp. 316-323. doi:10.1016/0022-4596(89)90181-3
- P. Dorenbos, “f → d Transition Energies of Divalent Lanthanides in Inorganic Compounds,” Journal of Physics: Condensed Matter, Vol. 15, No. 3, 2003, pp. 575- 594. Hdoi:10.1088/0953-8984/15/3/322
- P. Dorenbos, “Energy of the first 4f7→4f65d Transition of Eu2+ in Inorganic Compounds,” Journal of Luminescence, Vol. 104, No. 4, 2003, pp. 239-260. doi:10.1016/S0022-2313(03)00078-4
- K. Allakhverdiev, F. Gashimzade, T. Kerimova, T. Mitani, T. Naitou, K. Matsuishi and S. Onari, “Raman Scattering under Pressure in ZnGa2Se4,” Journal of Physics and Chemistry of Solids, Vol. 64, No. 9, 2003, pp. 1597-1601. doi:10.1016/S0022-3697(03)00077-5
- K. Huang and A. Rhys, “Theory of Light Absorption and Non-Radiative Transitions in F-Centres,” Proceedings of the Royal Society A, Vol. 204, No. 1078, 1950, pp. 406- 423. doi:10.1098/rspa.1950.0184
- A. F. Lubchenko, “Quantum Transitions in Impurity Centers of Solid States,” Naukova Dumka, Kiev, 1978.