Atmospheric and Climate Sciences
Vol.3 No.4(2013), Article ID:38825,9 pages DOI:10.4236/acs.2013.34064
Effects of Sky Conditions Measured by the Clearness Index on the Estimation of Solar Radiation Using a Digital Elevation Model
1Soil and Rural Engineering Department, Federal University of Mato Grosso, Mato Grosso, Brazil
2Department of Sanitary and Environmental Engineering, Federal University of Mato Grosso, Cuiabá, Brazil
3Department of Physics, Federal University of Mato Grosso, Mato Grosso, Brazil
Email: mdecalves@ufmt.br, lsanches@ufmt.br, vanessa@fisica.ufmt.br
Copyright © 2013 Marcelo de Carvalho Alves et al. This is an open access article distributed under the Creative Commons Attribution License, which permits unrestricted use, distribution, and reproduction in any medium, provided the original work is properly cited.
Received July 19, 2013; revised August 18, 2013; accepted August 25, 2013
Keywords: Sky Cover; Spatial; Radiation; Mapping Solar; Geographic Information Systems
ABSTRACT
This study evaluated the effects of sky conditions (measured by the clearness index, KT) on the estimation of solar radiation and its components. Solar radiation was calculated by a digital elevation model derived from the Shuttle Radar Topography Mission (SRTM). The calculated radiation was parameterized and validated with measured solar radiation from two stations inside the urban perimeter of the city of Cuiabá, Brazil, during 2006 to 2008. The measured solar radiation varied seasonally, with the highest values in December-March and the lowest in June-September. Comparisons between calculated and measured values for two sites in Cuiabá demonstrate that the model is accurate for daily Rg estimates under clear sky conditions based on Root Mean Square Error, Mean Bias Error and Willmott’s index. However, under partially cloudy and cloudy sky conditions the model was not able to provide robust estimates. Spatially, the highest values of incident Rg occurred on strands with North, Northeast and Northwest orientations and were lowest on those oriented to the South, Southeast and Southwest.
1. Introduction
Air quality in the urban areas is assessed through a combination of various meteorological factors [1], including solar energy, the main driver of life on Earth. Various authors [2-4] have noted that solar energy influences all the physical, chemical and biological processes operating in terrestrial ecosystem due to its role in energy and water vapor balance. For example, solar energy plays a controlling role in plant growth, soil heating and evapotranspiration. Moreover, knowledge of the spatial and temporal dynamics of solar radiation reaching the Earth’s surface is also very important for estimating current and future basic energy sources [5,6].
There are three groups of factors that determine the interaction of solar radiation with Earth’s atmosphere and surface: a) the geometry of the Earth’s surface, revolution and rotation(declination, latitude, solar hour angle), terrain (elevation, albedo, slope and surface orientation, shadows); b) attenuation of the atmosphere(absorptionscattering) by gases(air molecules, ozone, CO2 and O2) and solids, and; c) attenuation by liquid particles (aerosols, including non-condensed water) and clouds (condensed water) [7].
Knowledge of local variability in solar radiation is fundamental to studies about climate and has applications from eteorology, industry, agriculture, architecture, engineering and studies of water resources. This is because solar radiation affects air temperature, air movement and water availability for plants [8].
Variation in solar radiation as a function of the climate can be related to sky conditions (e.g. cloudiness). In general, sky conditions are difficult to predict, but can be categorized in terms of the weather parameters prevailing under clear sky, partially cloudy and overcast conditions. These descriptive terms can be quantitatively defined in terms of climatic variables (e.g. cloud cover, solar radiation) and are useful for energy-efficient building projects [9]. In Cuiabá, the sky cover conditions are influenced by several factors, including cloudiness and atmospheric combustion products and others. For example, [10] observed that sky cover in Cuiaba, Brazil, was influenced by a range of factors, including burning, mainly in the beginning of the dry season, with maximum intensity in September.
Continuous data on solar radiation at a given location are often difficult to obtain due to practical constraints. Thus, several models for solar radiation estimation based on meteorological variables (precipitation, temperature and sunshine) measured at conventional stations have recently been developed [11,12].
Mathematical models for radiation balance estimation should consider the influences of sky cover in areas with biomass burning activities dependent on the time of the year [10]. The concentration of aerosols will depend on the proximity of outbreaks of fire and weather conditions that influence the transport and dispersion of particulate matter in the atmosphere. The major absorbents, water vapour and aerosols, are particularly variable over the time, and when combined with changes in elevation they may significantly influence the spatial pattern of attenuation [13].
Burning events in central-western Brazil release a high concentration of aerosols into the atmosphere causing a significant attenuation of solar radiation not currently parameterized by models [14-16].
In this context, this study aims to evaluate the influence of sky coverage on global solar radiation estimation through a SRTM digital elevation model for the urban region of Cuiabá in central Brazil.
2. Material and Methods
2.1. Location and Description of the Studied Area
The study area, known locally as Baixada Cuiabana, is located in the urban region of Cuiaba city, Mato Grosso state, between latitude 15˚10' - 15˚50'S and longitude 54˚50'W - 58˚10'W. It has an average elevation of 165 m above sea level, ranging from 146 to 250 m, in a depression, surrounded on the north and east by the Chapada dos Guimarães city. Two meteorological stations were installed in this area at points characterized by different constructive features.
The first point was named Center station and was located in the center of Cuiabá city, (15˚36'1"S, 56˚5'29''W, 187 m altitude). This area is completely urbanized with sparse individual vegetation. The second point, named CPA (Centro Político Administrativo) station, was located at the perimeter of city in the Policy Centre Administrative of Cuiabá (15˚33'59"S, 56˚4'30"W, 239 m altitude). The station was surrounded by a few buildings and was close to a small lake. The straight line distance between the stations was 4 km (Figure 1).
The climate is classified as Aw (tropical dry and wet), according to Köppen’s classification, with two well defined seasons: a dry season (autumn-winter) and a wet season (spring-summer).The accumulated precipitation in the region is 1500 mm∙year−1 [17].
2.2. Experimental Data for Validation
Data acquired at the two stations were used for validation purpose. The solar radiation (Rg) was measured using a pyranometer installed in both stations (WM 918, Davis Instruments, Hayward, California, USA). The Centerstation pyranometer was in stalled 4.20 m height, and CPA station pyranometer was installed at10.50mheight, for safety reasons. The acquired data were stored every 30 minutes by a data acquisition and data storage system (Data logger and Vantage Pro 2, Davis Instruments, USA), from August 2006 to June 2008.
Upper and lower limits of 0 and 1300 Wm−2, respectively, were adopted in order to avoid compromising the quality of the estimates.
2.3. Estimation of the Clearness Index and Sky Cover
We used the clearness index (KT) to describe cloud cover that is characterized according to attenuation levels. The KT is an indicator of the relative clearness of the atmosphere [18] and is defined as the ratio of direct incident solar radiation (Rg) to the extraterrestrial solar atmosphere (Ro) (MJ m−2∙day−1).
The classification of the sky cover was based on [19]. A cloudy sky was defined in the range 0 < KT < 0.3, a partially cloudy sky between 0.3 ≤ 0.65 ≤ KT and a clear sky between 0.65 < KT < 1.0. Irradiation in the upper atmosphere (Ro) (MJ∙m−2∙day−1) was calculated by Equation (1).
(1)
where, Eo is the correction factor of eccentricity of the orbit (Equation (2)), Ws is the solar angle (degrees) (Equation (4)), f is the local latitude (degrees) and d is the solar declination (degrees) (Equation (5)).
 (2)where, Φ is defined by Equation (3) according to the Julian day (dJ)
 (3)
(3)
 (4)
(4)
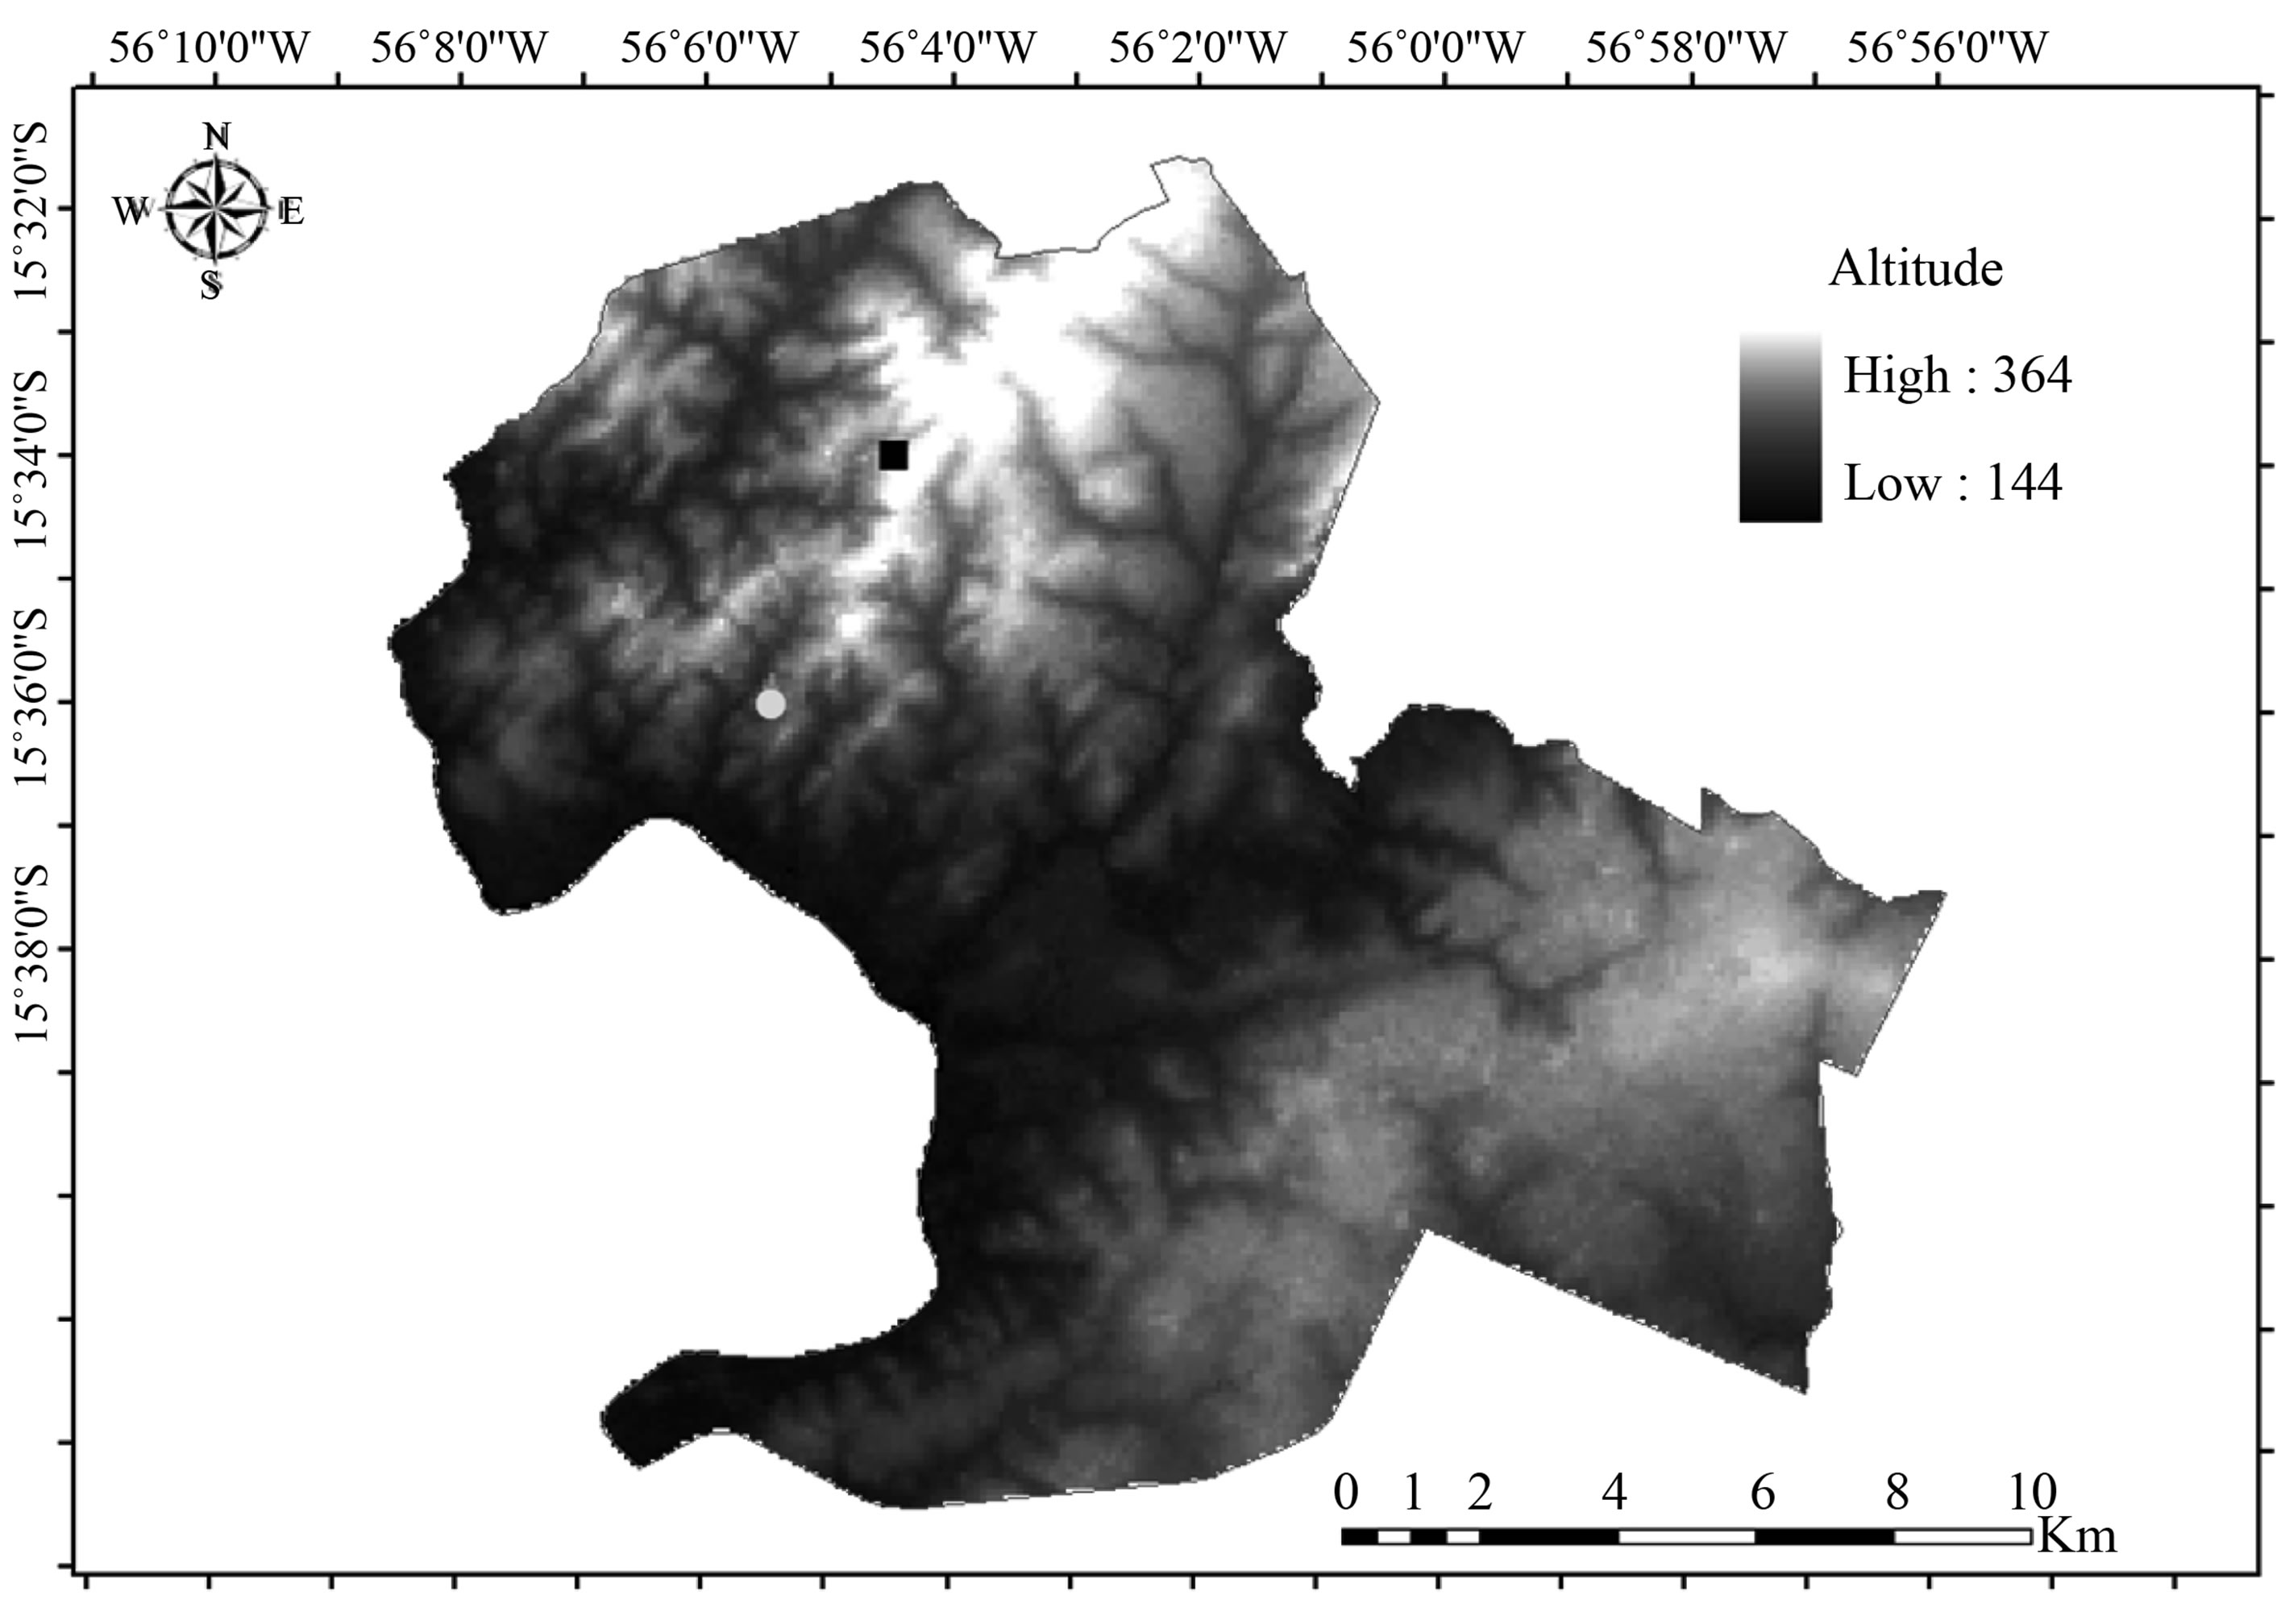
Figure 1. Location of the urban region of Cuiabá city, Mato Grosso state, Brazil and the location of meteorological stations in the Center (gray circle) and CPA station (black square) (SRTM Digital Elevation Model 2000, 90 m spatial resolution, GCSSAD 69 coordinate system). The altitude is in meters.
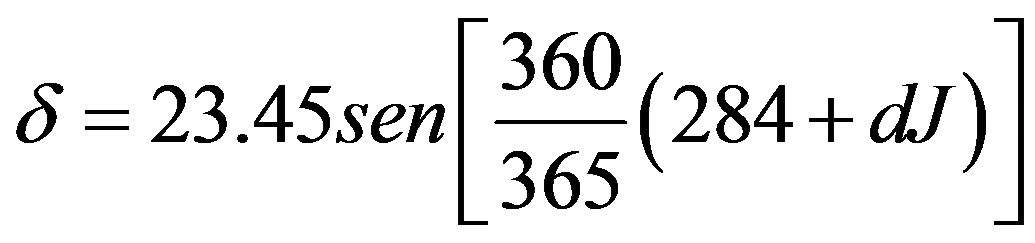 (5)
(5)
2.4. Calculated Global Solar Radiation Using the Solar Radiation Spatial Analyst Extension
Solar Radiation is a GIS tool of the GIS software ArcGIS® 9.2 which can be used to describe the spatial distribution of global solar radiation. The influence of latitude, altitude, surface orientation (slope and aspect) was considered as input variables derived from the Shuttle Radar Topography Mission (SRTM) digital elevation model (DEM) v.4.0 (USGS, 2010). The data were reprojected for UTM (Universal Transverse Mercator) South American Datum of 1969 (SAD 69) 21S zone, with a spatial resolution of 3 arc seconds, approximately 90 m of spatial resolution [4]. Equations were used to create the grids of radiation.
The Solar Radiation Area module was used to calculate raster maps and the Points Solar Radiation to calculate vector values of solar radiation in specific points, both expressed in Wh∙m−2. Specific vector points were used to generate the values of radiation related to the Center and CPA stations.
The parameters and input data adopted for the calculation of solar radiation were obtained after the parameterization of the model from the data measured in the field. The parameterization of the model was based on some original parameters of the GISA tool, and adopted for other points in Cuiaba (Table 1).

Table 1. Default and modified input parameters of the solar radiation algorithm.
Solar radiation data from 116 days (collected between 2006 and 2008 at the Centre and CPA stations) were selected considering the classification of the sky cover, of which 40 days were cloudy, 60 partially cloudy and 16 days clear. Global solar radiation was estimated and compared with the developed model using the Solar Analyst algorithm.
The Pearson correlation coefficient r (p < 0.05) was used to evaluate the degree of correlation and the direction of this correlation between the global solar radiation estimated from data collected by the sensors in the field and that generated by the solar analyst algorithm.
Another indicator of model performance was the use of statistical indices, such as Root Mean Square Error (RMSE) and the Mean Bias Error (MBE) recommended by [20]. Finally, the concordance index of [21] Willmott (d) (1981) was calculated to evaluate accuracy and to assess the deviation of the estimated values based on the measured values [14].
2.5. Spatial Data Analysis
The representation of the spatial distribution of calculated solar radiation was achieved using raster images in a geographic information system. The spatial resolution of each estimated pixel was 90 m. In total, 18 consecutive days of January (dJ14-31) were selected to represent the wet period and 18 consecutive days in July (dJ191- 208) of 2007 represented the dry period. The resulting maps were used to validate the parameters for the sky cover classified as clear. The slope and aspect maps were also calculated based on the DEM and were used to explain the obtained results of solar radiation.
3. Results and Discussion
3.1. Daily Variation of the Clearness Index
The average daily clearness index (KT) of 0.47 ranged from 0.002 to 0.69 from 2006 to 2008, indicating the percentage of attenuated solar radiation through atmosphere reaching of the surface at the CPA and Center stations (Figure 2).
The average value of the clearness index was similar to the values of 0.41 and 0.44 found by [19,22], respectively. These results were observed in Cascavel city, Paraná state, Brazil, and in the rural region of Botucatu city, São Paulo, Brazil, with lowest monthly values of 0.45 and highest values of 0.59 [23].
The highest values KT occurred most frequently between June and August—these months typically having less cloud cover. The lowest KT values occurred in January, February and December, these months being characterized by high concentrations of clouds and water vapor. A lower variation in the daily KT values occurred during conditions of lower cloud cover.
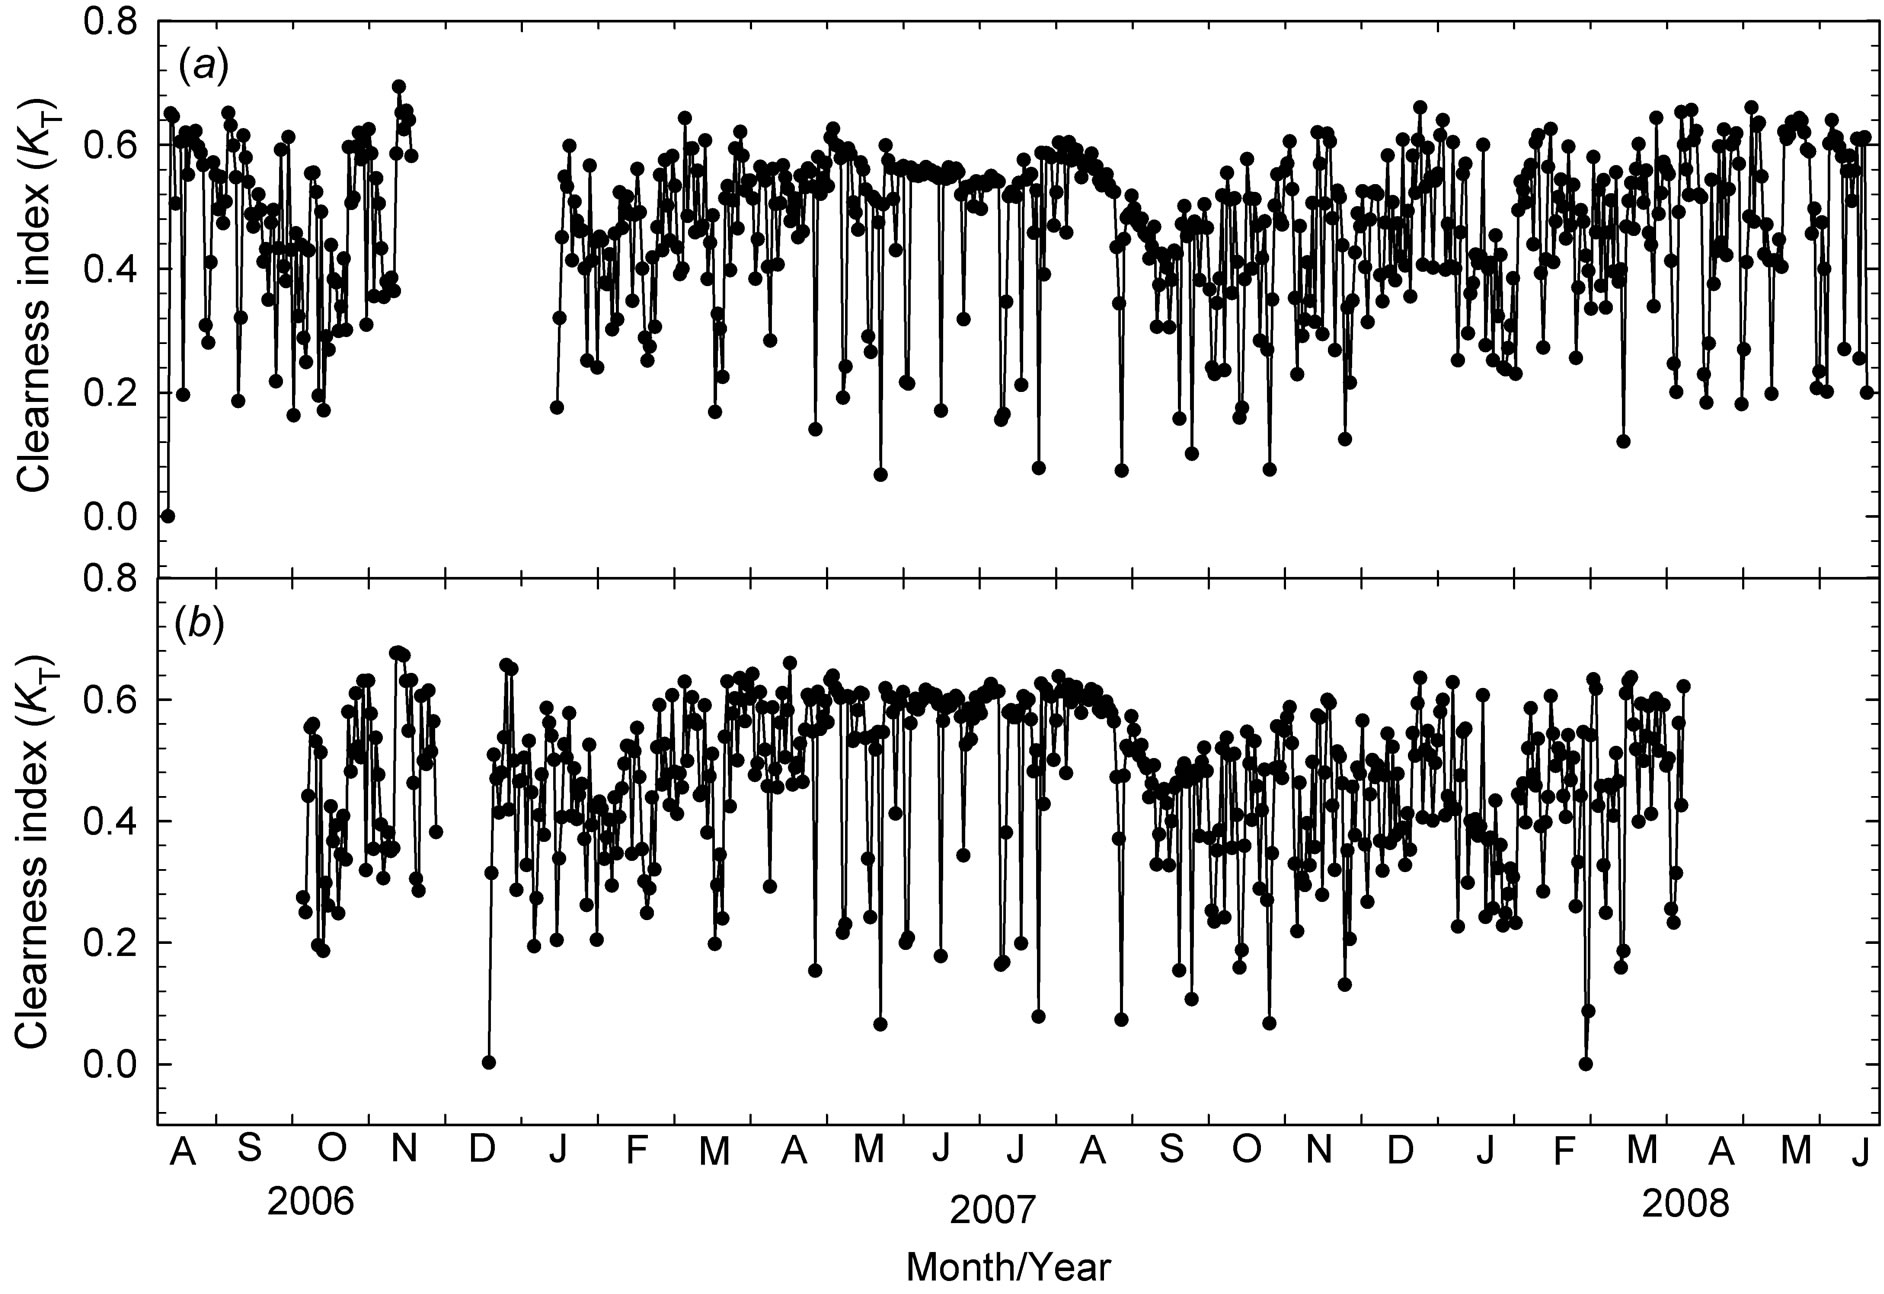
Figure 2. Daily average of clearness index (KT) in the Centerstation (a) and CPA station (b) from 2006 to 2008.
Similar seasonality was observed by [23,24] in Botucatu city, Brazil, with higher KT values during dry months (July and August) with less cloud cover. Lower values occurred during the wet months (January, February and November and December).
3.2. Validation of Calculated Global Radiation Considering the Sky Cover
Initially, the model used to estimate the solar radiation was set up using the input parameters suggested by the Solar Radiation Spatial Analyst extension of the GIS software ArcGIS® 9.2. After thoroughly testing the parameters by changing on a parameter at a time, the best statistical adjustments were identified using the highest Pearson correlation coefficient (r), the lower root mean square error (RMSE), Mean Bias Error (MBE) and a higher index of Willmott (d).
The best parameterization for the application of Spatial Analyst over different sky conditions was considered using the following parameters: proportion of diffuse radiation (0.2 for clear skies, 0.32 for partially cloudy sky and 0.77 for cloudy sky conditions) and the fraction of radiation that troughed the atmosphere (0.68 for clear skies, 0.49 for partially cloudy sky and 0.13 for cloudy sky conditions). The other parameters are described in Table 1, and did not differ from the default parameters of the Solar Radiation model.
Figure 3 shows the Solar radiation measured versus calculated solar radiation using digital elevation model considering sky conditions.
[25], analyzing the global solar radiation calculated by the Solar Analyst at two radiometric networks stations in Southern Spain, calculated the input parameters of transmissivity and diffuse fraction for all types of sky conditions from different ranges. From this information they were able to generate maps of the global solar radiation of the region.
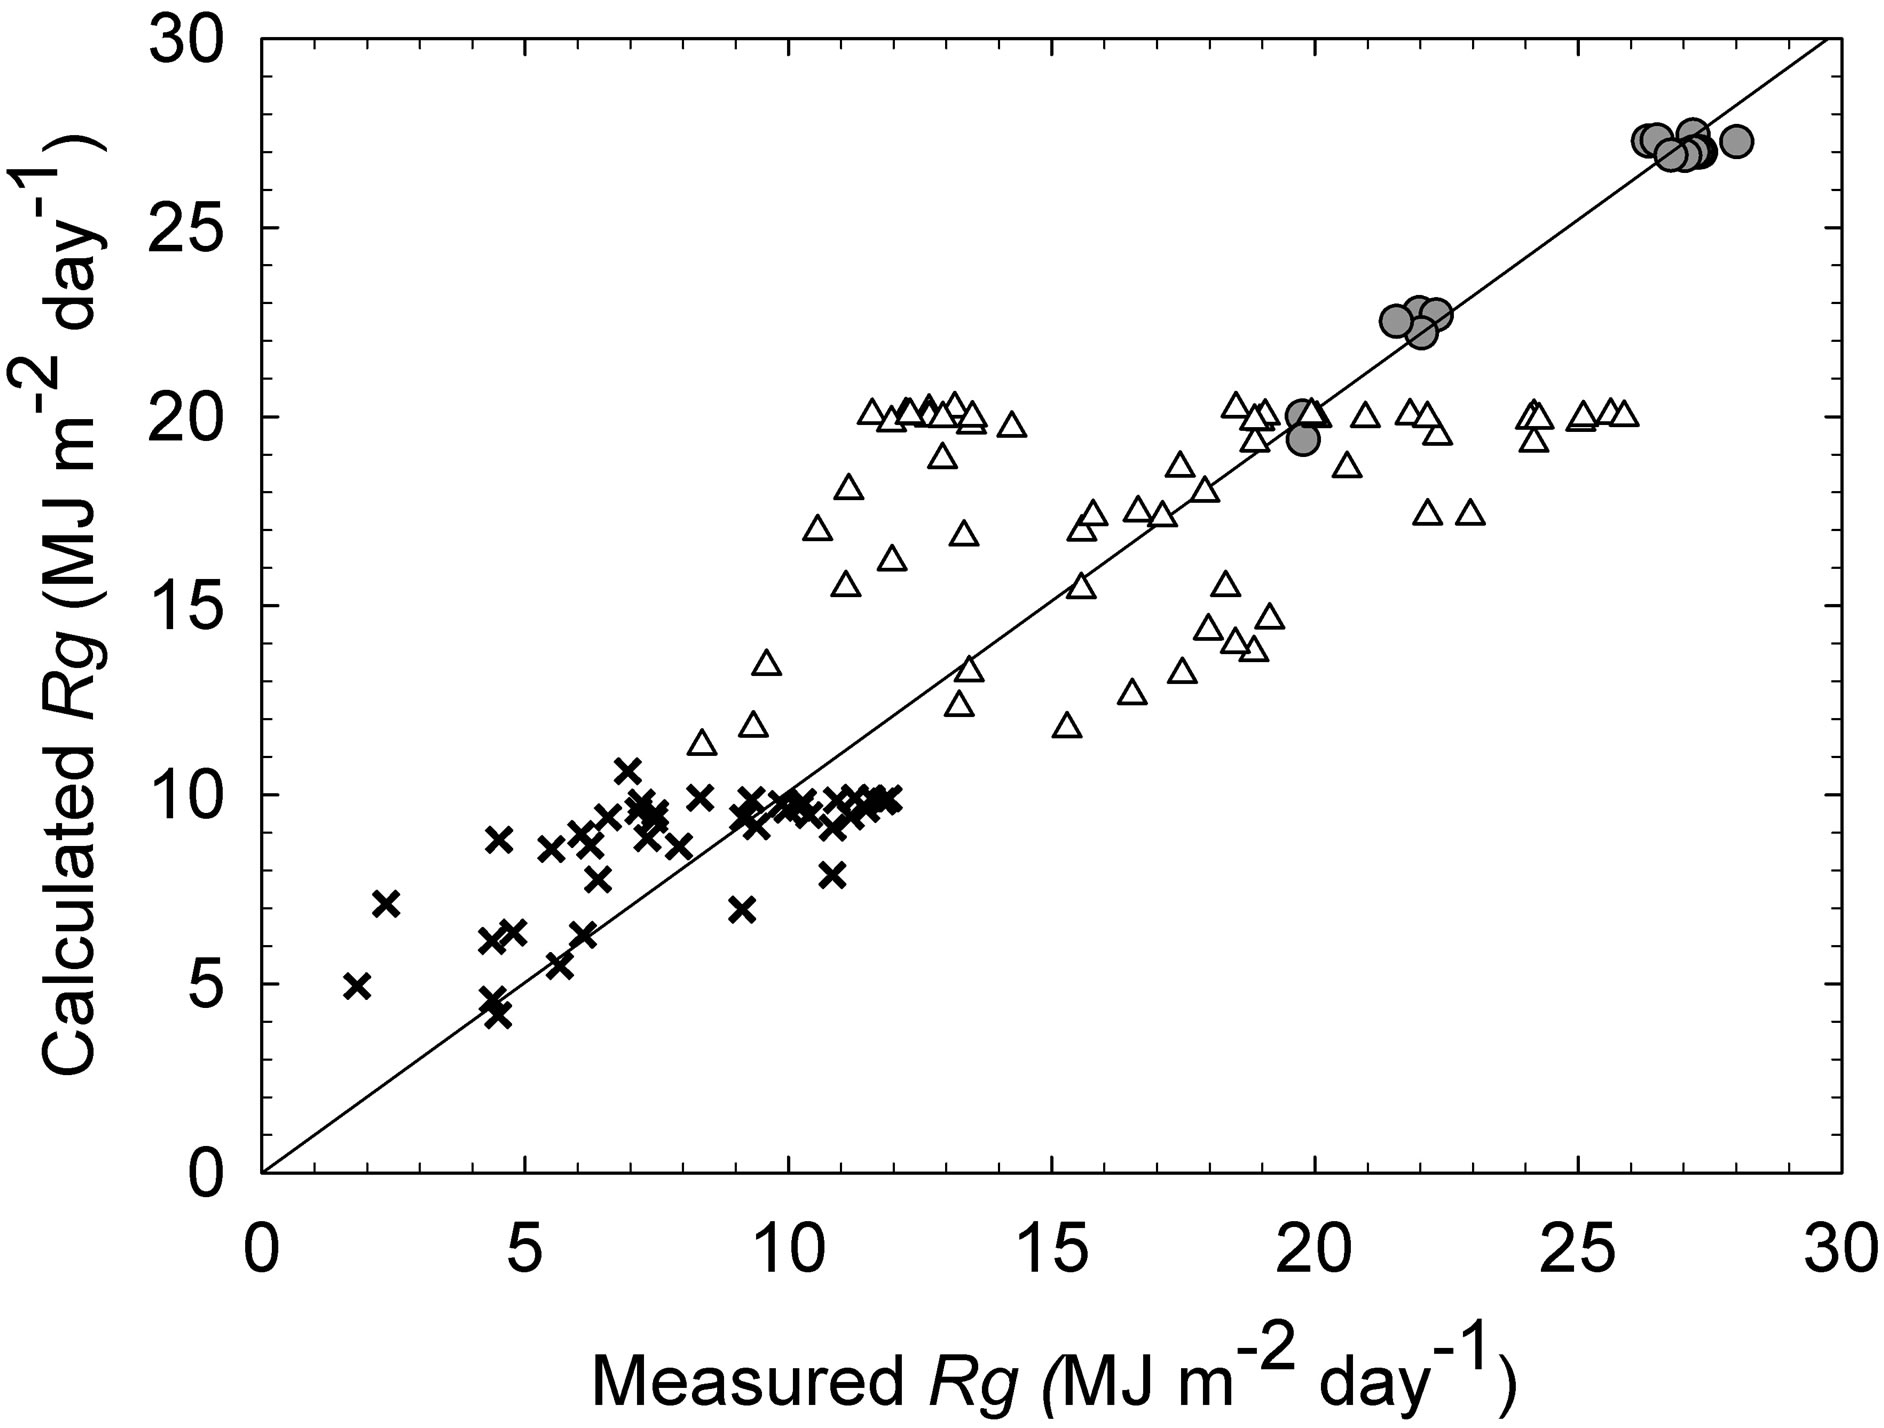
Figure 3. Solarr adiation measured versus calculated solar radiation using digital elevation model considering sky conditions (symbol x), partially cloudy (symbol Δ) and clear (symbol •). The solid linere presents a 1:1 ratio.
In the present study, the input parameters to be used in Solar Radiation (over clear sky and cloudy conditions) were adapted to estimate the Rg. However, when calculated for partially cloudy conditions, a greater number of tests were required and the output was not satisfactory. This lack of accuracy probably occurred due to the dry season being less cloudy; consequently more days with clear skies were expected related to the absence of cloud formation in the study area. However, due to frequent outbreaks of fire significant quantities of aerosols were emitted in to the atmosphere. These aerosols absorb solar radiation and reduce incident solar radiation on the surface in relation to their concentration in the atmosphere.
Similar climatic characteristics were observed by the Solar and Wind Energy Resource Assessment (SWERA) project, which mapped solar energy resources in Brazilian territory using a model of radiative transfer from July to December 2005 [14].
The combustion products injected in to the atmosphere during the fire season (July-October) could explain the systematic deviations and be used to validate the calculated global solar radiation by the radiation BRAZIL-SR model, using satellite image and observed surface data [10].
Table 2 shows the relationship between the Rg calculated by Solar Radiation and the measured Rg considering the three sky conditions.
According to the MBE values, calculated Rg was overestimated independent of the sky cover condition. As expected, the best correlation between calculated Rg and measured Rg was obtained during clear sky condition (Table 2) with the highest r(0.98) and d(0.99) and lowest RMSE (0.51 MJ∙m−2) and MBE (0.15 MJ∙m−2). There was no satisfactory correlation for partially cloudy and cloudy conditions—over estimating Rg by 0.75 and 0.60 MJ∙m−2,
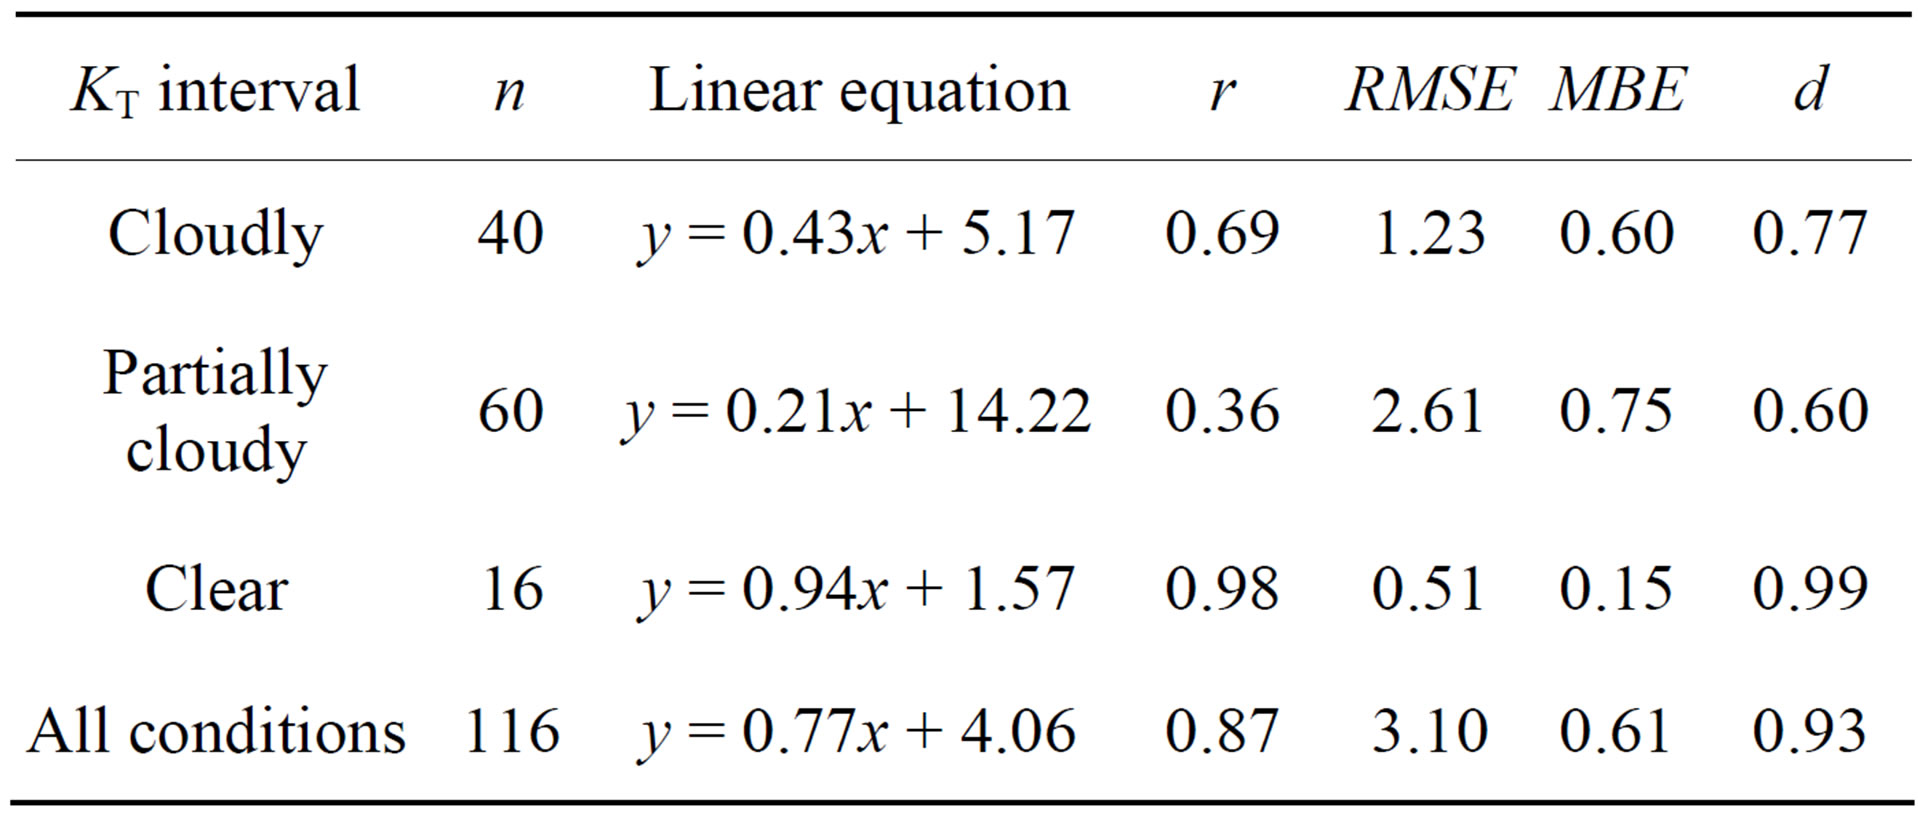
Table 2. Analysis of adjustment between the calculated and measured of Rg, number of data (n), linear regression, Pearson’s coefficient (r) (p < 0.05), root mean square error (RMSE, MJ∙m−2), Mean Bias Error (MBE, MJ∙m−2) and index of Will mott (d) under clearness index (KT). y is the calculated value and x is the measured value.
respectively. Possibly, the parameters used to represent the composition of the atmospheric conditions were responsible for the overestimation of the Solar Radiation model. However, the performance of the adjustment checked by d, indicated satisfactory relationship between the calculated and measured Rg (values tending to 1).
According to [25] Battles et al. (2008) and considering daily data, the best adjustments were observed under clear sky conditions and no satisfactory adjustments were possible for overcast skies. In accordance with the present study, the best results were also generated during clear skies. No satisfactory results were obtained for partially cloudy sky conditions, probably a function of the range of 0.3 ≤ KT ≤ 0.65 adopted in the present study. Cloudiness generated more errors, with an average RMSE of about26% when compared to clear sky conditions.
The Spatial Analyst under estimated radiation when applied to very cloudy conditions, confirming the need to estimate solar radiation only over clear skies [26]. Moreover, according to [27] the difficulty of validating the model for all sky conditions was evaluated, confirming the significant influence of aerosols from biomass burning in the atmospheric radiative transfer. Thus, the proximity of fire outbreaks produces a systematic error, similar to the error produced by the presence of clouds in the estimates provided by the BRAZIL-SR model.
[28] used the Spatial Analyst to estimate global radiation using adigital elevation model of 20 m spatial resolution. The authors observed values of RMSE of about 18% and the values of transmissivity and diffuse ratio varied depending on the clearness index.
An different model (using the Angstrom equation) was used to estimate daily global solar radiation in the region of Cascavel city, southern Brazil, and had a tendency to overestimate the global radiation in January, February, April, June, August, September, October, November and December and to underestimate during the months of March, May and July [22].
3.3. Monthly Average of Measured and Calculated Global Solar Irradiation for Each Type of Sky Cover
The monthly average of the clearness index (KT) exhibited seasonal variations, with the highest values occurring during the dry season (June-August) and the lowest values during the wet season, especially in the beginning of the rains (October-November) (Figure 4(a)). In a similar study in the region of Maceio city, northeastern Brazil, the sky conditions were also dominated by partially cloudy days with low frequencies of clear or cloudy days, and the clearness index varied from 0.50 (May-August) to 0.61 (November), with an annual average of 0.56 (Souza et al., 2005).
The seasonality of KT showed the opposite pattern to the seasonality in the monthly average of solar radiation (Rg) (Figure 4(b)). The monthly Rg average was 16.41 MJ∙m−2 considering the entire year and independent of sky conditions. Specifically, for each category of sky condition, the Rg average was 8.15 MJ∙m−2 (cloudy), 17.97 MJ∙m−2 (partially cloudy) and 24.35 MJ∙m−2 (clear), indicating the range of variation in global solar radiation received on the surface due to atmospheric attenuation.
The measured monthly average daily values of the two stations together ranged from 13.23 MJ∙m−2 (June/2008) up to 20.28 MJ∙m−2 (November/2006) with an average of 16.41 MJ∙m−2. Similar values were reported by [23] for a rural region of Botucatu city, southern Brazil (22.85˚S; 48.45˚W, altitude of 786 m), with a range of global radiation from 12.6 MJ∙m−2 in June to 21.0 MJ∙m−2 in No vember and an average of 17.62 MJ∙m−2. This seasonality of solar radiation in the Southern Hemisphere is expected at Earth’s surface, with higher values in the summer and lower values in the winter. This tendency follows the
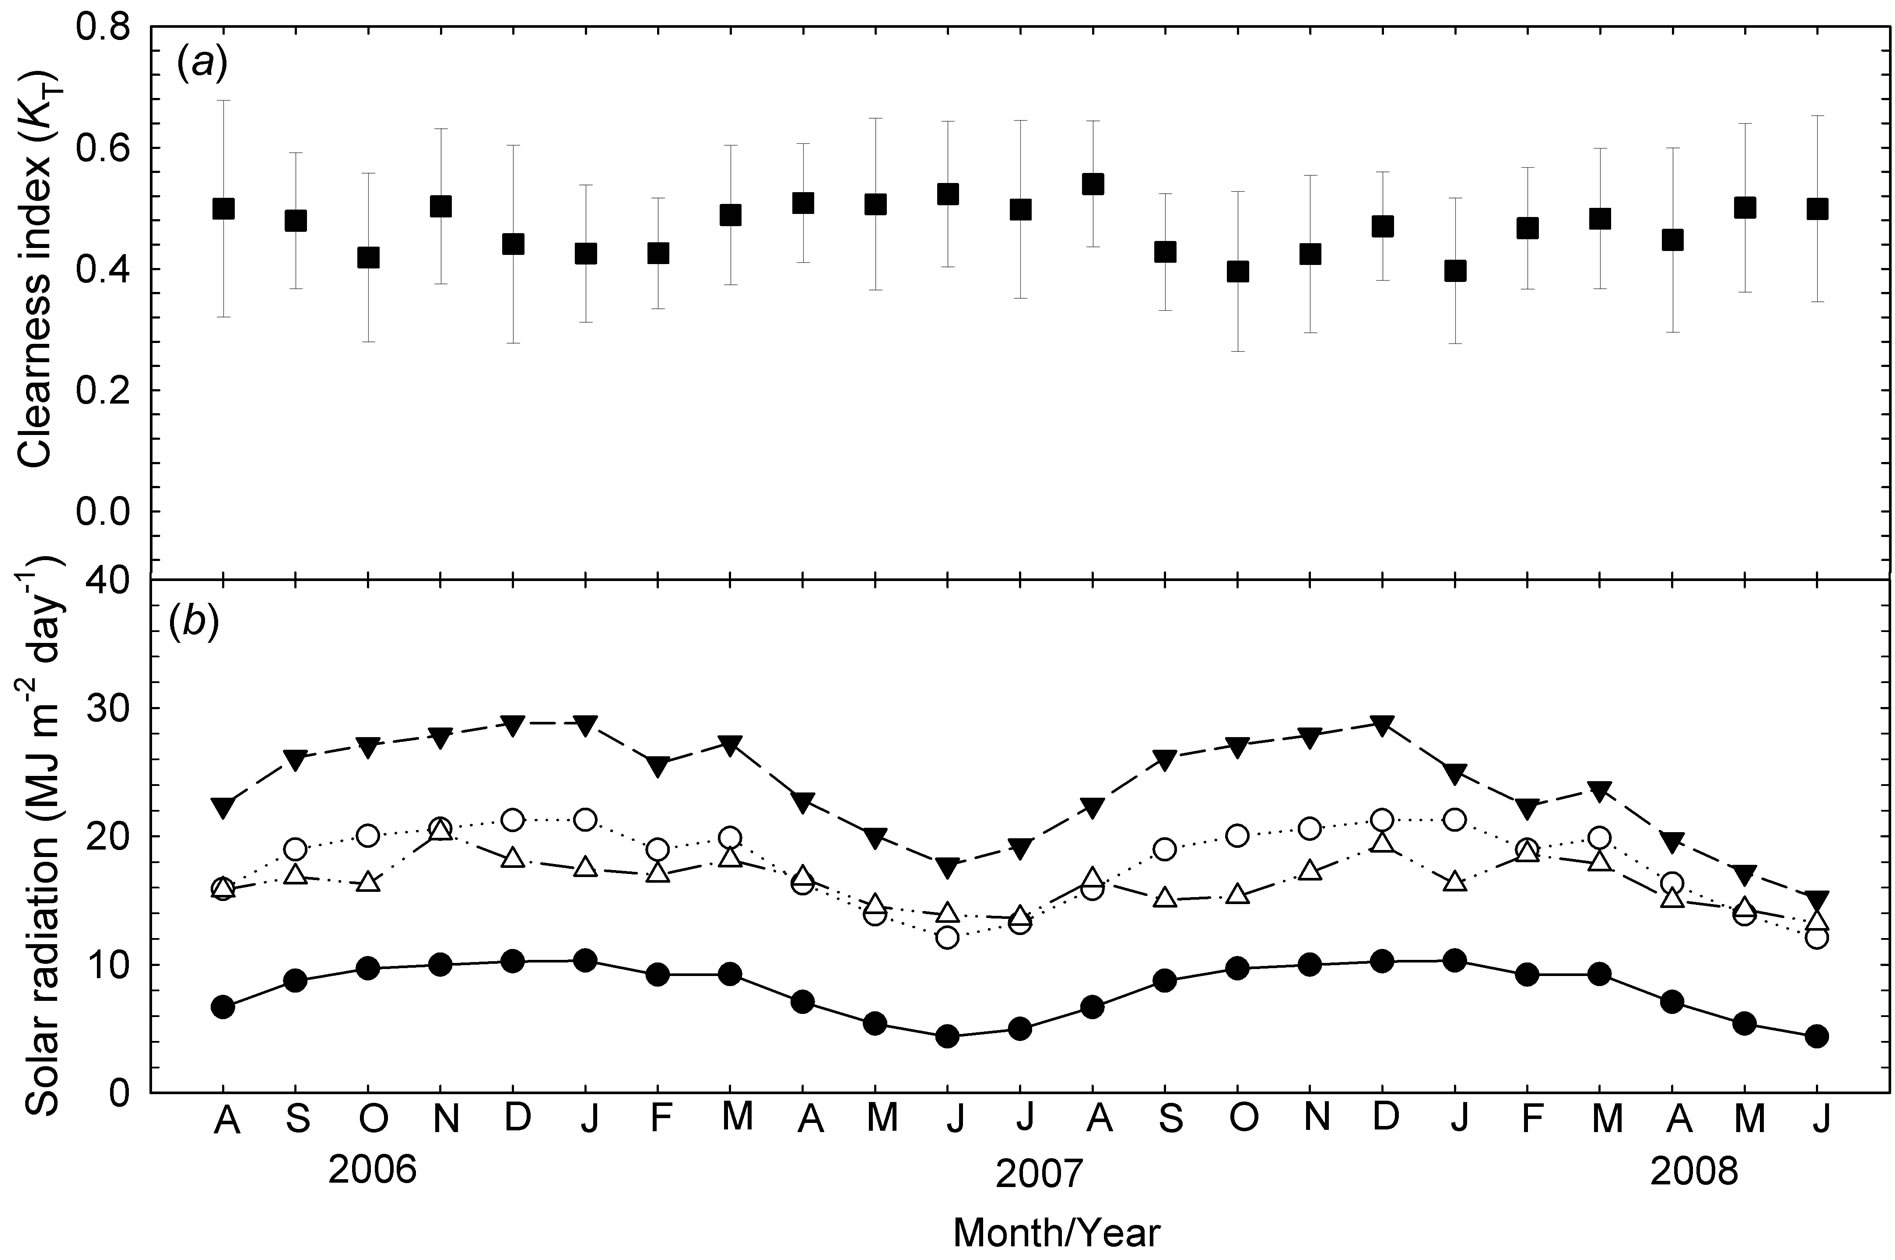
Figure 4. (a) Average monthly clearness index (± SD), (b) Measured solar radiation (MJ∙m−2∙day−1) and calculated solar radiation (MJ∙m−2∙day−1) using digital elevation model for the sky conditions cloudy, partially cloudy and clear in the urban region of Cuiabá city, from August 2006 to June 2008.
characteristics of radiation at the top of the atmosphere, decreasing from January through June and July, and increasing in December.
As anticipated, the values for clear sky were always higher than those for partially cloudy conditions and overcast skies.
3.4. Spatial Distribution of Calculated Solar Radiation
The topography factors of altitude, slope and aspect strongly affected the spatial distribution of solar radiation (Figures 5(a) and (b)).
The distribution of strands orientation (aspect) showed delimited areas with predominance of the slopes facing North and the South. The observed distribution in radiation is consistent with that described for an area of dense vegetation in the South of the state of Goiás, central Brazil, in which for most of the year the solar radiation was focused toward areas facing North, while areas facing to the South were exposed only in January [29]. [30] also observed that Juiz de For a city, southeast Brazil, was characterized by strands oriented to the North and this pattern lead to them receiving a greater amount of energy from the sun over the year.
The representation of the spatial distribution of the daily average of calculated Rg using Solar Analyst during the wet and dry seasons is shown in Figure 6. Urban region of Cuiabá city varied in altitude between 146 to 250 m, exhibiting strong trends with the lowest values of Rg at the lowest altitudes with different slopes (0 to 18.4%) (Figure 6(a)). [28] reported higher levels of solar radiation (calculated Rg) at both lower and higher altitudesites, with insignificant effects of horizon.
Solar radiation is typically more closely related to the topographic characteristics of the study area than to altitude [25]. According to the authors, differences in altitude were less important than other topographic variables, such as the shadows produced by surrounding mountains. Moreover, no dependence was observed between global solar radiation, altitude and slope. According to the results of the present study, not only the topographic characteristics must be considered for global solar radiation estimation, but also the sky conditions and the occurrence of burning events.
[8] reported that only a small part of the annual solar radiation can be attributed to solar declination, but the cloudiness between dry and wet seasons is a major cause of the high variation in solar radiation.
Variation in solar radiation depends on the slope orientation and was different in places facing South, Southeast and Southwest in January, while in July the orientation of the slopes were more favorable when facing North, Northeast and Northwest. In the Southern hemisphere, North facing slopes receive more sunlight than
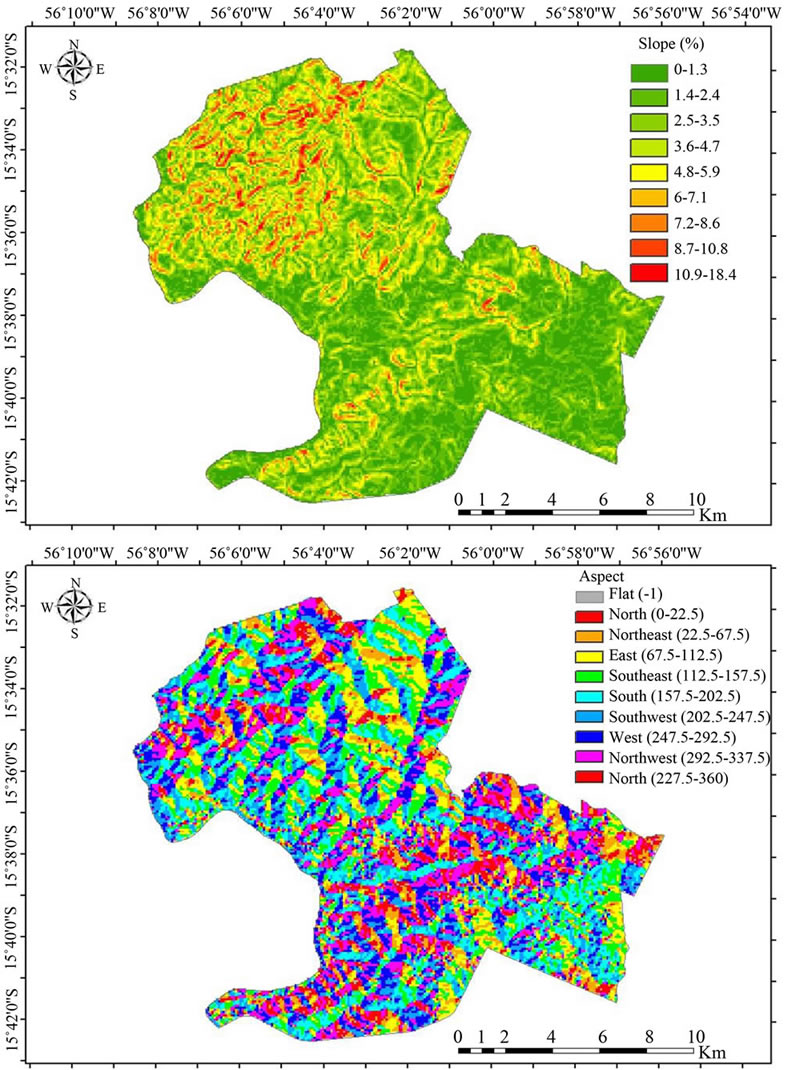
Figure 5. (a) Slope, (b) Strand sorientation (aspect) for the urban region of Cuiabá city.
those facing to the South [31].
The spatial distribution of Rg varied according to latitude. The highest daily averages ranged from 7.09 to 7.44 KWh∙m−2 (wet season) and from 4.24 to 5.26 KWh∙m−2 (dry season). A similar distribution of Rg maps were observed by [32], with variation from 6.0 to 7.5 KWh∙m−2 in January and from 4.0 to 5.0 KWh∙m−2 in July, for the Midwest region of Brazil.
4. Summary and Conclusions
This study evaluated the effects of sky conditions (as measured by the clearness index, KT) on the estimation of solar radiation and its components, based on SRTM digital elevation model.
The estimation of solar radiation by the Solar Radiation algorithm was more robust under clear and cloudy sky conditions. However, under partially cloudy conditions, the model showed poor adjustment and cannot be satisfactorily applied.
The generated maps of solar radiation enable the visualization of solar radiation in the different topographic regions inside the urban perimeter of Cuiabá city. Through the maps, it was possible to observe that the highest values of Rg occurred in January on strands oriented towards the South, Southeast and Southwest, and in July on strands oriented towards the North, Northeast and Northwest.
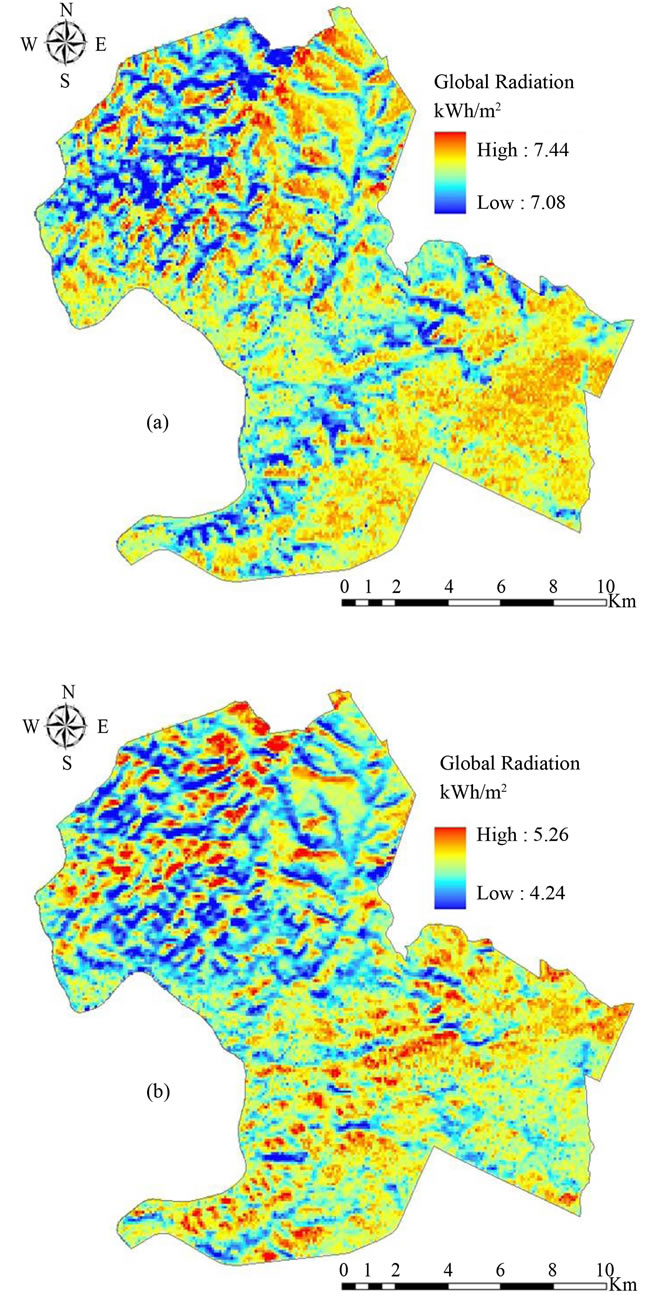
Figure 6. Spatial distribution of solar radiation (KWh∙m−2) under clear sky condition in (a) January and; (b) in July 2007 for the urban region of Cuiabá city.
5. Acknowledgements
Partial support was provided by the Programa de Apoio a Núcleos de Excelência (PRONEX) provided by Fundação de Amparo a Pesquisa do Estado de Mato Grosso (FAPEMAT), Process N. 823971/2009.
REFERENCES
- N. Ilten and T. Selici, “Investigating the Impacts of Some Meteorological Parameters on Air Pollution in Balikesir, Turkey,” Environmental Monitoring and Assessment, Vol. 140, No. 1-3, 2008, pp. 267-277. http://dx.doi.org/10.1007/s10661-007-9865-1
- M. Bilgili and M. Ozgoren, “Daily Total Global Solar Radiation Modeling from Several Meteorological Data,” Meteorology and Atmospheric Physics, Vol. 112, No. 3-4, 2011, pp. 125-138. http://dx.doi.org/10.1007/s00703-011-0137-9
- K. Zakšek, T. Podobnikar and K. Oštir, “Solar Radiation Modeling,” Computers & Geosciences, Vol. 31, No. 2, 2005, pp. 233-240. http://dx.doi.org/10.1016/j.cageo.2004.09.018
- P. Fu and P. M. A. Rich, “A Geometric Solar Radiation Model with Applications in Agriculture and Forestry,” Computers and Electronics in Agriculture, Vol. 37, No. 1-3, 2002, pp. 25-35. http://dx.doi.org/10.1016/S0168-1699(02)00115-1
- M. Martínez-Chico, F. J. Batles and J. L. Bosch, “Cloud Classification in a Mediterranean Location Using Radiation Data and Sky Images,” Energy, Vol. 36, No. 7, 2011, pp. 4055-4062. http://dx.doi.org/10.1016/j.energy.2011.04.043
- A. Sözen and E. Arcaklıoğlu, “Prospects for Future Projections of the Basic Energy Sources in Turkey,” Energy Sources, Vol. 2, No. 2, 2007, pp. 183-201. http://dx.doi.org/10.1080/15567240600813930
- G. Montero, J. M. Escobar, E. Rodríguez and R. Montenegro, “Solar Radiation and Shadow Modelling with Adaptive Triangular Meshes,” Solar Energy, Vol. 83, No. 7, 2009, pp. 998-1012. http://dx.doi.org/10.1016/j.solener.2009.01.004
- J. L. de Souza, M. R. Nicácio and M. A. L. Moura, “Global Solar Radiation Measurements in Maceió, Brazil,” Renewable Energy, Vol. 30, No. 8, 2005, pp. 1203-1220. http://dx.doi.org/10.1016/j.renene.2004.09.013
- D. H. W. Li and J. C. Lam, “An Analysis of Climatic Parameters and Sky Condition Classification,” Building and Environment, Vol. 36, No. 4, 2001, pp. 435-445. http://dx.doi.org/10.1016/S0360-1323(00)00027-5
- E. B. Pereira, F. R. Martins, S. L. Abreu, P. Couto, S. Colle and R. Stuhlmann, “Biomass Burning Controlled Modulation of the Solar Radiation in Brazil,” Advances in Space Research, Vol. 24, No. 7, 1999, pp. 971-975. http://dx.doi.org/10.1016/S0273-1177(99)00370-1
- A. Ferronato, J. H. Campelo Júnior, E. L. Bezerra and M. M. D. D. Mendonça, “Estimativa da Radiação Solar Global Baseada em Medidas de Temperatura do ar,” Proceedings of XIII Congresso Brasileiro de Agrometeorologia, Santa Maria, July, 2003, pp. 781-782.
- F. F. Blanco and P. C. Sentelhas, “Coeficientes da Equa- ção de Angströn-Prescott para Estimativa da Insolação para Piracicaba-SP,” Revista Brasileira de Agrometeorologia, Vol. 10, 2002, pp. 295-300.
- J. A. Ruiz-Arias, T. Cebecauer, J. Tovar-Pescador and M. Súri, “Spatial Disaggregation of Satellite-Derived Irradiance Using a High-Resolution Digital Elevation Model,” Solar Energy, Vol. 84, No. 9, 2010, pp. 1644-1657. http://dx.doi.org/10.1016/j.solener.2010.06.002
- F. R. Martins, E. B. Pereira, R. A. Guarnieri, C. S. Yamashita and R. C. Chagas, “Mapeamento dos Recursos de Energia Solar no Brasil Utilizando Modelo de Transferência Radiativa BRASIL-SR,” Proceedings of I Congresso Brasileiro de Energia Solar, Fortaleza, April 2007, pp. 1-10.
- G. Stephens, “Radiation Profiles in Extended Water Clouds. II: Parameterization Schemes,” Journal of Atmospheric Science, Vol. 35, No. 11, 1978, pp. 2123-2132. http://dx.doi.org/10.1175/1520-0469(1978)035<2123:RPIEWC>2.0.CO;2
- E. B. Pereira, A. W. Setzer, F. Gerab, P. E. Artaxo, M. C. Pereira and G. Monroe, “Airborne Measurements of Aerosols from Burning Biomass in Brazil Related to the TRACE A Experiment,” Journal of Geophysical Research, Vol. 101, No. D19, 1996, pp. 23983-23992.
- M. M. A. Sampaio, “Análise do Desempenho Térmico e Lumínico de Habitações Populares em Cuiabá-MT,” Dissertation, Federal University of Mato Grosso, 2006.
- B. Liu and R. Jordan, “The Interrelationship and Characteristic Distribution of Direct, Diffuse and Total Solar Radiation,” Solar Energy, Vol. 4, No. 3, 1960, pp. 1-19. http://dx.doi.org/10.1016/0038-092X(60)90062-1
- R. Dallacort, R. P. Ricieri, S. L. Silva, S. L. F. Paulo and F. F. Silva, “Análises do Comportamento de um Actinó- grafo Bimetálico (R. Fuess-Berlin-Steglitz) em Diferentes Tipos de Cobertura do céu,” Acta Scentiarum Agronomy, Vol. 26, 2004, pp. 413-419.
- M. Iqbal, “An Introduction to Solar Radiation,” Academic Press, Toronto, 1983.
- C. J. Willmott, “On the Validation of Models,” Physical Geography, Vol. 2, 1981, pp. 184-194.
- M. I. Valiati, “Estimativa da Irradiação Solar Global com Diferentes Partições para a Região de Cascavel,” Dissertation, State University of West of Paraná, Cascavel, 2001.
- T. Inácio, “Potencial Solar das Radiações Global, Difusa e Direta em Botucatu,” Dissertation, State University of Paulista, Botucatu, 2009.
- A. F. Santos, J. G. Z. de Mattos and S. V. de Assis, “Frequência de Dias Claros com Base nos Valores do Índice de Limpidez,” Proceedings of XI Congresso Brasileiro de Meteorologia, Rio de Janeiro, 2000, pp. 54-58.
- F. J. Batlles, J. L. Bosch, J. Tovar-Pescador, M. MartínezDurbán, R. Ortega and I. Miralles, “Determination of Atmospheric Parameters to Estimate Global Radiation in Areas of Complex Topography: Generation of Global Irradiation Map,” Energy Conversion and Management, Vol. 49, No. 2, 2008, pp. 336-345. http://dx.doi.org/10.1016/j.enconman.2007.06.012
- P. Fu and P. M. A. Rich, “A Geometric Solar Radiation Model and Its Applications in Agriculture and Forestry,” Proceedings of the 2nd International Conference on Geospatial Information in Agriculture and Forestry, Lake Buena Vista, 10-12 January 2000, pp. I357-364.
- F. R. Martins, E. B. Pereira and M. P. S. Echer, “Levantamento dos Recursos de Energia Solar no Brasil com o Emprego de Satélite Geoestacionário: O Projeto Swera,” Revista Brasileira de Ensino de Física, Vol. 26, No. 2, 2004, pp. 145-159. http://dx.doi.org/10.1590/S0102-47442004000200010
- M. Martínez-Durbán, L. F. Zarzalejo, J. L. Bosch, S. Rosiek, J. Polo and F. J. Battlles, “Estimation of Global Daily Irradiation in Complex Topography Zones Using Digital Elevation Models and Meteosat Images: Comparison of the Results,” Energy Conversion and Management, Vol. 50, No. 9, 2009, pp. 2233-2238. http://dx.doi.org/10.1016/j.enconman.2009.05.009
- L. E. G. Machado, E. D. Nunes and P. A. Romão, “Aná- lise da Influência da Topografia na Variação Sazonal de Fitofisionomias na Bacia do Rio Veríssimo-GO,” XIV Simpósio Brasileiro de Sensoriamento Remoto, Natal, 2009.
- F. T. P. Torres, L. N. Moreira, E. A. Soares, J. U. Pierre and G. A. Ribeiro, “Exposição das Vertentes e Ocorrências de Incêndios em Vegetação no Município de Juiz de Fora-MG,” Proceedings of XIII Simpósio Brasileiro de Geografia Física Aplicada, Viçosa, 2009.
- R. J. Hugget, “Geoecology: An Evaluation Approach,” London, 1995.
- E. R. Martins, E. B. Pereira, S. L. Abreu and S. Colle, “Mapas de Irradiação Solar para o Brasil—Resultados do Projeto SWERA,” Proceedings of the Simpósio Brasileiro de Sensoriamento Remoto, Goiânia, April 2005, pp. 16-21.