International Journal of Clinical Medicine
Vol. 3 No. 7 (2012) , Article ID: 26333 , 5 pages DOI:10.4236/ijcm.2012.37123
Double Crossover Points in the DFA of Heartbeats in Patients with Sleep Apnea
![]()
1Department of Medicine, Tokyo Women’s Medical University, Medical Center East, Tokyo, Japan; 2Department of Clinical Nutrition and Informatics, Tokyo Kasei University, Tokyo, Japan; 3Harvard-MIT Division of Health Science and Technology, Boston, USA.
Email: ichimi6174@hotmail.co.jp
Received September 10th, 2012; revised October 20th, 2012; accepted November 19th, 2012
Keywords: Sleep Apnea; DFA (Detrended Fluctuation Analysis); Scaling Exponent; Crossover Points; Heartbeats
ABSTRACT
Cardiovascular and cerebrovascular events have been observed during night-time associated with periodic breathing including sleep apnea and Cheyne-Stokes respiration. Early detection and treatment is important to reduce night-time events. We clarified the characteristics of the dynamic nature of heartbeats associated with periodic breathing by using detrended fluctuation analysis (DFA). We analyzed heartbeats in eight recordings from the MIT-BIH Polysomnographic database. We observed two crossover points and defined three scaling exponents, β1 (n ≤ 40 beats), β2 (50 ≤ n ≤ 200), and β3 (251 ≤ n ≤ 1584). Compared with β1 (1.21 ± 0.13) and β3 (0.92 ± 0.16), scaling exponent β2 (0.62 ± 0.16) showed the statistically lowest value (p < 0.05). And there was a negative relationship between the scaling exponent β2 and apnea/hypopnea index (p < 0.05). These results indicate that DFA analysis of heartbeats may be useful for the early detection of sleep associated breathing disorders including sleep apnea and its severity.
1. Introduction
Sleep is not a passive state but an active neurophysiological condition, and sometimes a state of heightened autonomic activity is associated with REM sleep or sleep apnea. Life-threatening arrhythmias and cerebrovascular events have been observed during night-time [1-4]. Epidemiological studies suggest that hypertension is frequently observed in patients with sleep apnea syndrome [5-14]. Early diagnosis or treatment of sleep apnea is thus important to reduce night-time cardiovascular events. Sleep disordered breathing including sleep apnea syndrome is usually diagnosed by polysomnographic techniques. This procedure takes a lot of time, requires instruments to monitor several physiological signals, needs specific skills and is usually performed by specially trained technicians in sleep laboratories. The diagnosis of sleep-disordered breathing is sometimes missed because of the lack of a simple and adequate screening tool [15]. Use of 24-hour electrocardiogram and analysis of heart rate may be useful as a “rule out test” for sleep disorder breathing in patients with congestive heart failure. During the events of periodic breathing including CheyneStokes respiration and obstructive sleep apnea, a cyclic variation of the heart rate is observed [16]. Spectral analysis of the heart rate obtained from 24-hour electrocardiographic monitoring can afford useful information concerning periodic breathing. The peak value in the very low frequency band (VLF: 0.01 - 0.05 Hz) is associated with the presence of periodic breathing or CheyneStokes respiration [17,18]. Thus, the analysis of nocturnal heart rate variability by spectral analysis is a quick and easy screening tool for sleep-disordered breathing [19]. Detrended fluctuation analysis (DFA) has become a widely-used method to detect fluctuations that cannot be distinguished by linear analysis methods [20]. Analysis of the fractal characteristics of heartbeats yields more powerful prognostic information than traditional measurement of heart rate variability in patients with heart failure [20-22]. DFA has been applied to evaluate patients with sleep apnea syndrome [23]. In extracting a scaling exponent α2, a crossover point was set at 70 beats. In this study, we conducted DFA of heartbeats in subjects with sleep apnea by setting two crossover points and evaluated whether scaling exponents have an ability to evaluate the relationship between the number of apnea/hypopnea events and the value of the scaling exponent.
2. Methods
We selected 8 subjects from the MIT-BIH Polysomnographic Database, which we had previously developed [24]. These subjects underwent night-time polysomnography with ECG (electro-cardiogram), EEG (electroencephalogram), nasal and oral air flow, respiratory movement, and systemic blood pressure. These signals were digitized at a sampling interval of 250 Hz. Each heartbeat was detected automatically by using the ARISTOTLE arrhythmia detector (developed by G.B. Moody in MIT), and each beat annotation was verified by visual inspection and re-edited by cursor in the screen editor (WAVE). In the MIT-BIH polysomnographic database, nasal and thoracic respiratory signals in patients with sleep apnea were included. These sleep recordings were evaluated by a sleep expert at Beth-Israel Hospital who followed the guidelines of Rechtschaffen and Kales [25]. The number of sleep apnea and hypopnea events was measured by observing the respiratory signals with cessation of respiration for at least 10 seconds or a hypopnea in which airflow decreased by 50% for 10 seconds. We used the detrended fluctuation analysis method (DFA), which had been developed to characterize the correlation properties in non-stationary time series of a physiological signal [20]. We have developed a DFA analysis program by using VBA (Visual Basic for Applications) and Microsoft Excel according to the DFA algorithm [20]. As a first step, the inter-beat interval time series is integrated and Y(k) = (for i = 1 to k; (B(i) – Bave)2; next i) is obtained; where Bave is the average instantaneous RRinterval signal, and B(i) is the beat-to-beat signal. The integrated time series is divided into boxes. For each box of length n, a least squares line (the “trend”) is fit to the n samples in the box. The fluctuations within each box are the differences between the samples and the fitted, and the root-mean-square fluctuation over all boxes of size n is denoted as F(n). This calculation is repeated for all values of n between 3 and the length of the time series. After that, for each n size, F(n) is obtained. The plot of log10(F(n)) against log10(n) was obtained. The slope of the line relating F(n) and n in a log-log scale is the scaling exponent α. Traditionally a DFA plot consists of two distinct regions characterized by two straight lines before and after a crossover point (CP). In our study, the scaling exponent α1 (3 ≤ n ≤ 16), and α2 (17 ≤ n ≤ 64) are calculated. As we observed two crossover points, we defined an additional three scaling exponents, β1, β2 and β3. The values of β1, β2, and β3 correspond to the slopes of log10F(n) as a function of log10(n) in the range between 3 ≤ n ≤ 40 beats, 50 ≤ n ≤ 200 beats, and 251 ≤ n ≤ 1584 beats, respectively. The range of β1 consisted of 13 scales, β2 involved 7 scales and β3 involved 9 scales.
3. Statistical Analysis
All data are present as mean ± standard deviation. The Bartlett multiple-sample test was performed for equal variances. Analysis of variance (ANOVA) for repeated measurements was applied to examine significant changes in the measured variables of exponents β1, β2, and β3. The paired t-test was used to examine the differences. Probability levels < 0.05 were considered significant.
4. Results
The scaling behavior in a patient with sleep apnea (total number of sleep apnea events: 264) demonstrates at least two crossover points (Figure 1). The box size of the first crossover point is 40 beats, and that of the second one is 251 beats. Scaling exponents obtained by the slopes of fitted lines were as follows; α1 = 1.38, α2 = 0.98, β1 = 1.35, β2 = 0.44, and β3 = 1.06.
The scaling behavior in a subject with a sleep apnea index of less than 5 events/hour shows no remarkable change before and after the crossover points (Figure 2: α1 = 1.23, α2 = 1.02, β1 = 0.997, β2 = 0.84, β3 = 1.005).
To examine whether there is a difference in the scaling exponents, we performed a statistical analysis on eight subjects. A significantly lower value was obtained in the scaling exponent of α2 (1.03 ± 0.08) compared with the scaling exponent of α1 (1.23 ± 0.11). The mean and standard deviation of scaling exponents of β1 = 1.21 ± 0.13, β2 = 0.62 ± 0.18 and β3 = 0.92 ± 0.16 were found and statistically significant changes are observed (p < 0.05), with β2 being the lowest value (Figure 3).
As shown in Figure 4, the relationship between the numbers of sleep apnea/hypopnea index and the values
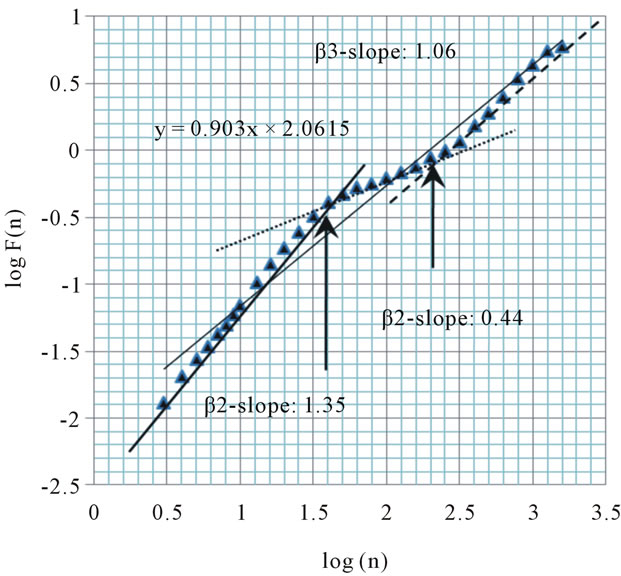
Figure 1. Plot of scaling function log(F(n)) versus log(n) for the heartbeats using DFA from MIT-BIH Polysomnographic Database (SLP48: A subject with sleep apnea syndrome: apnea/hypopnea index 46.8). Arrows indicate “crossover” points, which we hypothesized. We calculated the slope of the plot between the crossover points, and defined it as β2.
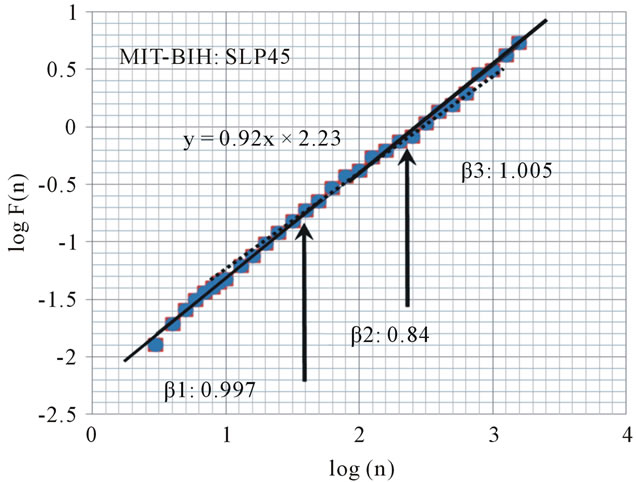
Figure 2. Plot of scaling function log(F(n)) versus log(n) for the heart beat using DFA from MIT-BIH Polysomnographic Database (SLP45: A subject with low apnea/hypopnea index: 5). The slope of the regression line is 0.92. Arrows indicate “crossover” points, which we hypothesized.
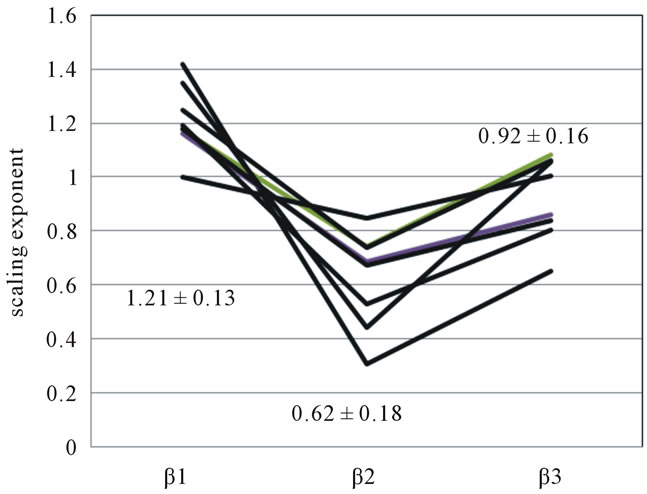
Figure 3. Scaling exponent β1, β2, β3 in eight subjects.
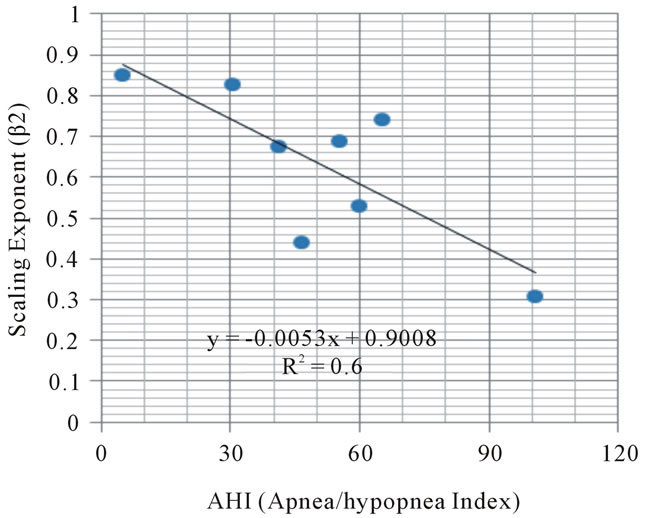
Figure 4. Relationship between sleep apnea/hypopnea events (AHI) and scaling exponent.
of the β2 exponent in eight subjects showed the negative correlation (p < 0.05).
5. Discussion
In this study, we analyzed the scaling behavior in heartbeats by using the DFA method. There were apparent two crossover points in the plot of logF(n) and log(n) derived from the DFA method in subjects suffering from sleep apnea syndrome. We detected a statistically significant decrease in the β2 value in subjects with sleep apnea syndrome and a negative correlation between numbers of sleep apnea events and β2 values.
Penzel et al. determined two scaling exponents, α1 and α2 instead of using the traditional crossover point [23]. They defined exponent α1 as the slope of logF(t) as a function of logt in the range 10 £ t £ 40 beats, and α2 as the slope in the range 70 £ t £ 300 beats. We defined exponent β2 as the slope in the range 50 £ n £ 200 beats. This means the scaling exponent α1, α2 as defined by Penzel and the scaling exponent β1, β2 as defined by us covers almost the same range. They reported that the average scaling exponents of α2 value obtained from all night data in healthy (H), moderate sleep apnea (M), and severe sleep apnea (S), were 0.67 ± 0.19, 0.63 ± 0.11 and 0.51 ± 0.14 respectively. These values are similar to our results except for subjects without sleep apnea who showed a scaling exponent of β2 = 0.84. Peng [20] reported average scaling exponents of α1 = 1.201 ± 0.178 and α2 = 0.998 ± 0.124 for healthy subjects, and for congestive heart failure subjects, α1 = 0.803 ± 0.259 and α2 = 0.998 ± 0.124. Thus, the pathologic subjects exhibit a “reverse” crossover and it is possible to distinguish between the two groups.
We found double crossover points in the plot of logF(n) vs. logn in patients with sleep apnea. In order to calculate the scaling exponent β2, we set the first crossover point at n = 50 (CP1) and the second at n = 251 (CP2). Concerning exponent β2, there was a rapid decrease of the slope after the first crossover point (50 < n < 250) and a rapid increase of the slope after the second CP2.
The amplitude and period of sinusoidal trends have an effect on the crossover point [26,27]. The period of a sinusoidal trend determines the crossover point [27]. Detrended fluctuation analysis for time sequential data obtained from the period of sinusoidal signal Xs with a period of T and amplitude A disclosed a crossover point of T beats and amplitude A leads to a vertical shift of logF(n). After CP1, the slope decreases nearly flat (slope = 0). Thus the cyclic change of the heartbeats with a cycle length of T beats observed in subjects with periodic breathing might produce a CP1 of T beats. These data are very similar to our results.
There are several sinusoidal rhythms of the heart beat in our pathophysiological system: 1) respiratory sinus arrhythmia (especially observed during deep sleep) with a cycle length of 4 to 8 seconds; 2) the Mayer rhythm (10 seconds); 3) sleep apnea with a cycle length of 30 - 60 seconds; and 4) Cheyne-Stokes respiration (cycle length of 60 - 120 seconds). We quantitatively analyzed the cycle length of periodic breathing in three different conditions and subjects [1], and found that: 1) for normal subjects under hypobaric pressure, the cycle length is 19.6 ± 3.5 seconds; 2) in patients with sleep apnea syndrome, the cycle length is 58.5 ± 11.1 seconds; and 3) in patients suffering from congestive heart failure accompanied by Cheyne-Stokes respiration, the cycle length is 93.2 ± 21.7 seconds. In the present study, we observed CP1 at 40 beats, indicating the cycle length of the sleep apnea. The rhythm regulation system in the central nervous system (CNS) has the ability to affect the sinus node of the heart through the autonomic nervous system, and may contribute to produce this crossover point [28].
This is the first study to point out the presence of CP2 in subjects suffering from sleep apnea. There was a statistically significant negative correlation between the number of apnea events and the value of scaling exponent β2 (p < 0.05).
Further study might be required: 1) to clarify the physiological or mathematical significance of the presence of CP2; 2) to develop an algorithm to determine CP1 and CP2; and 3) to establish the sensitivity and specificity of β2 in evaluating sleep apnea syndrome.
We conclude that the scaling exponent β2 obtained from heartbeats detrended fluctuation analysis might be a useful parameter in evaluating the severity of sleep apnea.
6. Acknowledgements
We appreciate Roger G. Mark in MIT, J. W. Weiss and A. L. Goldberger in Beth Israel Deaconess Medical Center who kindly helped and organized us in recording and producing the MIT-BIH Polysomnographic database. None founding sources were used to obtain the results of the present study.
REFERENCES
- J. Motta and C. Guilleminault, “Cardiac Dysfunction during Sleep,” Annals of Clinical Research, Vol. 17, 1985, pp. 190-198.
- K. Otsuka, Y. Ichimaru and T. Yanaga, “Studies of Arrhythmias by 24-Hour Polygraphic Recordings: Relationship between Atrioventricular Block and Sleep States,” American Heart Journal, Vol. 105, No. 6, 1983, pp. 934-940. doi:10.1016/0002-8703(83)90393-9
- Y. Ichimaru, Y. Kodama and T. Yanaga, “Circadian Variation of Heart Rate Variability,” The Computer Society of the IEEE, Computers in Cardiology, Vol. 14, 1988, pp. 315-318.
- H. Palomeki, “Snoring and the Risk of Ischemic Brain Infarction,” Stroke, Vol. 22, 1991, pp. 1021-1025. doi:10.1161/01.STR.22.8.1021
- A. G. Tilkian, C. Guilleminault, J. S. Schroeder, et al., “Hymodynamics in Sleep Induced Apnea. Studies during Wakefulness and Sleep,” Annals of Internal Medicine, Vol. 85, 1976, pp. 714-719.
- E. Lugaresi, G. Coccagna, F. Cirignotta, P. Farnetti, R. GaBassi, G. Di Donato, et al., “Breathing during Sleep in Man in Normal and Pathological Conditions,” Advances in Experimental Medicine and Biology, Vol. 99, 1978, pp. 35-45. doi:10.1007/978-1-4613-4009-6_5
- C. Guilleminault, J. Van Den Hoed and M. M. Miller, “Clinical Overview of the Sleep Apnea Syndromes,” In: C. Guilleminault and W. C. Dement, Eds., Sleep Apnea Syndromes, Alan R. Liss, Inc., New York, 1978, pp. 1-12.
- B. Buruch, C. Pollack, B. Borowiecki and E. Weitzman, “The Hypersomnia-Sleep Apnea Syndrome: A Reversible Major Cardiovascular Hazard,” Circulation, 1977, Vol. 56, p. 177.
- R. P. Milkmen, S. Redline, C. C. Carlisle, A. R. Assaf and P. D. Levinson, “Day-Time Hypertension in Obstructive Sleep Apnea. Prevalence and Contributing Risk Factor,” Chest, Vol. 99, No. 4, 1991, pp. 861-866. doi:10.1378/chest.99.4.861
- E. C. Fletcher, R. D. Debeholce, S. Lovoi and A. B. Garin, “Undiagnosed Sleep Apnea in Patients with Essential Hypertension,” Annals of Internal Medicine, Vol. 103, 1985, pp. 190-195.
- A. J. Williams, D. Houston, S. Finberg, C. Lam, J. L. Kinney and S. Santiago, “Sleep Apnea Syndrome and Essential Hypertension,” American Journal of Cardiology, Vol. 55, No. 8, 1985, pp. 1019-1022. doi:10.1016/0002-9149(85)90738-6
- M. Koskenvuo, J. Kaprio, T. Telakivi, M. Partinen, K. Heikkila and S. Sarna, “Snoring as a Risk Factor for Ischaemic Heart Disease and Stroke in Men,” British Medical Journal, Vol. 294, 1978, pp. 16-19. doi:10.1136/bmj.294.6563.16
- A. R. Tilkian, C. Guilleminault, J. S. Schroeder, K. L. Lehrman, B. L. Simmons and W. C. Dement, “Sleep Induced Apnea Syndrome: Prevalence of Cardiac Arrhythmias and Their Reversal after Tracheostomy,” American Journal of Medicine, Vol. 63, No. 3, 1977, pp. 348-358. doi:10.1016/0002-9343(77)90272-8
- C. Guilleminault, S. Connolly and R. Winkle, “Cardiac Arrhythmia and Conduction Disturbances during Sleep in 400 Patients with Sleep Apnea Syndrome,” American Journal of Cardiology, Vol. 52, No. 5, 1983, pp. 490-494. doi:10.1016/0002-9149(83)90013-9
- A. Vazir, M. Dayer, P. C. Hasting, H. F. MiIntyre, et al., “Can Heart Rate Variation Rule out Sleep Disordered Breathing Heart Failure?” European Respiratory Journal, Vol. 27, No. 3, 2006, pp. 571-577, doi:10.1183/09031936.06.00130904
- C. Guilleminault, S. Connonly, R. Winkle, K. Melvin, et al., “A Cyclical Varation of the Heart Rate in Sleep Apnoea Syndrome, Mechanisms, and Usefulness of 24 h Electrocardiography as a Screening Technique,” Lancet, Vol. 323, No. 8369, 1984, pp. 126-131. doi:10.1016/S0140-6736(84)90062-X
- Y. Ichimaru, M. Ichimaru, Y. Kodama and T. Yanaga, “Detection of Periodic Breathing during 24-Hour Ambulatory ECG Monitoring,” IEEE Computers in Cardiology, Vol. 13, 1987, pp. 411-414.
- Y. Ichimaru and T. Yanaga, “Frequency Characteristics of the Heart Rate Variability Produced by Cheyne-Stokes Respiration during Ambulatory Monitoring,” Computers and Biomedical Research, Vol. 22, No. 3, 1989, pp. 225-233. doi:10.1016/0010-4809(89)90003-7
- F. Roche, E. Sforza, D. Duverney, et al., “Heart Rate Increment: An Electrocardiological Approach for the Early Detection of Obstructive Sleep Apnoea/Hypopnea Syndrome,” Clinical Science, Vol. 107, 2004, pp. 105-110. doi:10.1042/CS20040036
- C. K. Peng, S. Havlin, H. E. Stanley and A. L. Goldberger, “Quantification of Scaling Components and Crossover Phenomena in Nonstationary Heartbeat Time Series,” Chaos, Vol. 5, No. 1, 1995, pp. 82-87. doi:10.1063/1.166141
- H. V. Huikiri, T. H. Makikallio, C. K. Peng, A. L. Goldberger, et al., “Fractal Correlation Properties of R-R Interval Dynamics and Mortality in Patients with Depressed Left Ventricular Function after an Acute Myocardial Infarction,” Circulation, Vol. 101, 2000, pp. 47-53. doi:10.1161/01.CIR.101.1.47
- J. M. Tapanainen, P. E. Thomsen, L. Kober, C. TorpPedersen, T. H. Makikallio, A. M. Still, K. S. Lindgren and H. V. Huikuri, “Fractal Analysis of Heart Rate Variability and Mortality after an Acute Myocardial Infarction,” American Journal of Cardiology, Vol. 90, No. 4, 2002, pp. 347-352. doi:10.1016/S0002-9149(02)02488-8
- T. Penzel, J. W. Kantelhardt, L. Crote, J. H. Peter and A. Bundle, “Comparison of Detrended Fluctuation Analysis and Spectral Analysis for Heart Rate Variability in Sleep and Sleep Apnea,” IEEE Transactions on Biological Engineering, Vol. 50, No. 10, 2003, pp. 1143-1151. doi:10.1109/TBME.2003.817636
- Y. Ichimaru and G. B. Moody, “Development of the Polysomnographic Database on CD-ROM,” Psychiatry and Clinical Neurosciences, Vol. 53, No. 2, 1999, pp. 175-177. doi:10.1046/j.1440-1819.1999.00527.x
- A. Rechtschaffen and A. Kales, “A Manual of Standardized Terminology, Techniques and Scoring System for Sleep Stages of Human Sleep Subjects,” US Government Printing Office, Washington DC, 1968.
- K. Hu, P. Ch. Ivanov, Z. Chen, P. Carpena and H. E. Stanley, “Effect of Trends on Detrended Fluctuation Analysis,” Physical Review, Vol. 64, 2001, pp. 1-19.
- D. T. Schmitt and P. Ch. Ivanov, “Fractal Scale-Invariant and Nonlinear Properties of Cardiac Dynamics Remain Stable with Advanced Age: A New Mechanistic Picture of Cardiac Control in Healthy Elderly,” American Journal of Physiology Regulatory, Integrative and Comparative Physiology, Vol. 293, No. 5, 2007, pp. R1923-R1937, doi:10.1152/ajpregu.00372.2007
- Y. Ichimaru and S. Katayama, “Rhythms in the Central Nervous System and 1/f Fluctuations of the Heart Rate,” Frontiers of Medical & Biological Engineering, Vol. 60, No. 2, 1994, pp. 117-130.