Paper Menu >>
Journal Menu >>
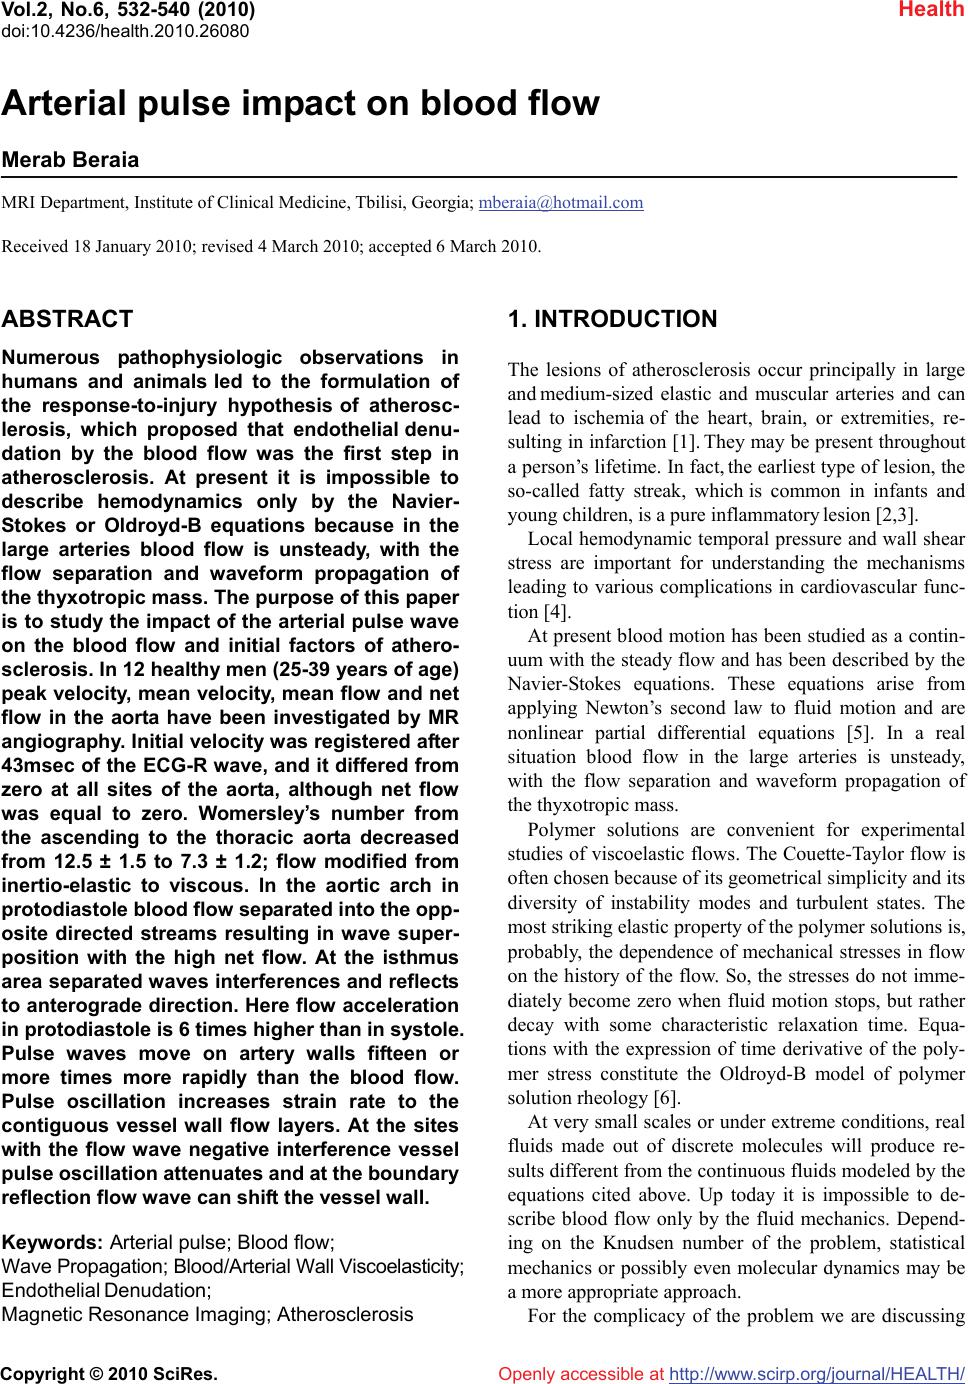 Vol.2, No.6, 532-540 (2010) Health doi:10.4236/health.2010.26080 Copyright © 2010 SciRes. Openly accessible at http://www.scirp.org/journal/HEALTH/ Arterial pulse impact on blood flow Merab Beraia MRI Department, Institute of Clinical Medicine, Tbilisi, Georgia; mberaia@hotmail.com Received 18 January 2010; revised 4 March 2010; accepted 6 March 2010. ABSTRACT Numerous pathophysiologic observations in humans and animals led to the formulation of the response-to-injury hypothesis of atherosc- lerosis, which proposed that endothelial denu- dation by the blood flow was the first step in atherosclerosis. At present it is impossible to describe hemodynamics only by the Navier- Stokes or Oldroyd-B equations because in the large arteries blood flow is unsteady, with the flow separation and waveform propagation of the thyxotropic mass. The purpose of this paper is to study the impact of the arterial pulse wave on the blood flow and initial factors of athero- sclerosis. In 12 healthy men (25-39 years of age) peak velocity, mean velocity, mean flow and net flow in the aorta have been investigated by МR angiography. Initial velocity was registered after 43msec of the ECG-R wave, and it differed from zero at all sites of the aorta, although net flow was equal to zero. Womersley’s number from the ascending to the thoracic aorta decreased from 12.5 ± 1.5 to 7.3 ± 1.2; flow modified from inertio-elastic to viscous. In the aortic arch in protodiastole blood flow separated into the opp- osite directed streams resulting in wave super- position with the high net flow. At the isthmus area separated waves interferences and reflects to anterograde direction. Here flow acceleration in protodiastole is 6 times higher than in systole. Pulse waves move on artery walls fifteen or more times more rapidly than the blood flow. Pulse oscillation increases strain rate to the contiguous vessel wall flow layers. At the sites with the flow wave negative interference vessel pulse oscillation attenuates and at the boundary reflection flow wave can shift the vessel wall. Keywords: Arterial pulse; Blood flow; Wave Propagation; Blood/Arterial Wall Viscoelasticity; Endothelial Denudation; Magnetic Resonance Imaging; Atherosclerosis 1. INTRODUCTION The lesions of atherosclerosis occur principally in large and medium-sized elastic and muscular arteries and can lead to ischemia of the heart, brain, or extremities, re- sulting in infarction [1]. They may be present throughout a person’s lifetime. In fact, the earliest type of lesion, the so-called fatty streak, which is common in infants and young children, is a pure inflammatory lesion [2,3]. Local hemodynamic temporal pressure and wall shear stress are important for understanding the mechanisms leading to various complications in cardiovascular func- tion [4]. At present blood motion has been studied as a contin- uum with the steady flow and has been described by the Navier-Stokes equations. These equations arise from applying Newton’s second law to fluid motion and are nonlinear partial differential equations [5]. In a real situation blood flow in the large arteries is unsteady, with the flow separation and waveform propagation of the thyxotropic mass. Polymer solutions are convenient for experimental studies of viscoelastic flows. The Couette-Taylor flow is often chosen because of its geometrical simplicity and its diversity of instability modes and turbulent states. The most striking elastic property of the polymer solutions is, probably, the dependence of mechanical stresses in flow on the history of the flow. So, the stresses do not imme- diately become zero when fluid motion stops, but rather decay with some characteristic relaxation time. Equa- tions with the expression of time derivative of the poly- mer stress constitute the Oldroyd-B model of polymer solution rheology [6]. At very small scales or under extreme conditions, real fluids made out of discrete molecules will produce re- sults different from the continuous fluids modeled by the equations cited above. Up today it is impossible to de- scribe blood flow only by the fluid mechanics. Depend- ing on the Knudsen number of the problem, statistical mechanics or possibly even molecular dynamics may be a more appropriate approach. For the complicacy of the problem we are discussing  M. Beraia / HEALTH 2 (2010) 532-540 Copyright © 2010 SciRes. Openly accessible at http://www.scirp.org/journal/HEALTH/ 533 533 the theoretical basis for the waveform propagation of the viscoelastic substances and the ways of its correlation. 2. MATHERIALS AND METHODS We have investigated 12 healthy men (25-39 years of age) with a 1.5-T MR imager with the breath hold (18 sec) and ECG triggering in different sites of the aorta. Pulse rate 72 to 78 beats per minute. Kinematic viscosity of the blood 3.8 × 10⁻⁶ m2/s [7,8]. Volunteers were preliminarily examined by the cardi- ologist, angiologist and hematologists. Flow quantifica- tion (mean velocity, peak velocity, mean flow, net flow) was carried out in every 43 sec at different sites of the ascending aorta, aortic arch and thoracic aorta in 1 mm slices of 7 cm2 area. All data are given below as graphs. (Figures 1-5) Examinations were performed with sur- face coil technology, with a gradient strength 40 mT/m and a maximum slew rate 200 mT/m/msec. 3. RESULTS In our cases the initial flow velocity was registries after 43msec of the ECG-R wave, and it was different from zero at all sites of the aorta, although net flow was equal to zero. During the heart cycle blood systolic velocity varies in sinusoid shape, whereas net flow increases gradually at the diastole when blood velocity was low. Initial flow acceleration was lower than of the next one, although gradient pressure much higher initially and gradually decreased at the flow. Womersley’s number from ascending to thoracic aorta decreased from 12.5 ± 1.5 to 7.3 ± 1.2 and flow modified from the inertio-elastic to viscous. Specificity, sensitivity and accuracy of the MRA to the explored area were 95%, 97%, and 96% (Figures 1-5). Figure 1. Peak velocity (a), mean velocity (b), mean flow(c) and net flow (d) graphs at the ascending aorta. (Dotted line - flow at the internal wall). Velocity and flow graph starts after ECG-R wave with the 43msec delay time. Blood acceleration for the initial systole (43msec) is lower than that for the next time (43-90msec). Net flow increases at the end diastole.  M. Beraia / HEALTH 2 (2010) 532-540 Copyright © 2010 SciRes. Openly accessible at http://www.scirp.org/journal/HEALTH/ 534 Figure 2. Peak velocity (a), mean velocity (b), mean flow(c) and net flow (d) graphs at the aortic arch. (Dotted line-flow at the ex- ternal wall). At peak velocity graph separated stream flows in opposite direction. Net flow increases at the end diastole. Figure 3. Peak velocity (a), mean velocity (b), mean flow(c) and net flow (d) graphs at the isthmus of the aorta. (Dotted line-flow at the external wall). Peak velocity at the 300msec is zero (negative interference) and then sharply increases to downstream. Here acceleration is 6 times higher than that in systole. Reflected wave changes polarity (phase change). Net flow increases at the end diastole.  M. Beraia / HEALTH 2 (2010) 532-540 Copyright © 2010 SciRes. Openly accessible at http://www.scirp.org/journal/HEALTH/ 535 535 Figure 4. Peak velocity (a), mean velocity (b), mean flow(c) and net flow (d) graphs at the end of aortic arch (a). (Dotted line-flow at the internal wall). Flow direction at the graphs inverted due to slice position at MRI. Wave oscillation is transmits from external to internal wall. Fotmation of the peak velocity delays to the same at the isthmus area. Net flow increases at the end diastole. Figure 5. Peak velocity (A), mean velocity (B), mean flow(C) and net flow (D) graphs at the thoracic aorta. (Dotted line-flow at the internal wall). Flow direction at the graphs inverted due to slice position at MRI. There is no flow separation at the protodiastole. Net flow increases at the end diastole.  M. Beraia / HEALTH 2 (2010) 532-540 Copyright © 2010 SciRes. Openly accessible at http://www.scirp.org/journal/HEALTH/ 536 4. DISCUSSION Inertial flow is characteristic for the Newtonian fluids. Blood is non Newtonian [9], thyxotropic [10,11] and as a viscoelastic substance must be expressed in some phe- nomena: 1) If the stress is held constant, the strain increases with the time (creep); 2) If the strain is held constant, the stress decreases with time (relaxation); 3) Effective stiffness depends on the rate of applica- tion of the load; 4) If cyclic loading is applied, hysteresis (phase lag) occurs, leading to a dissipation of mechanical energy; 5) Wave experience attenuation; 6) Rebound of the object following an impact is less than 100% [12]. With the viscoelastic hydrocolloids as a blood, some deformation caused by shear stress is elastic and will return to zero when force is removed. The remaining deformation will not return to zero forming creep flow of the substance. Under the constant force elastic dis- placement remains constant whereas the sliding dis- placement increases. If the force varies in sinusoid shape, shear strain rate lags behind the changes in the causative force by the phase. Systolic sinusoid pulse pressure in the vessel wall and inside the blood propagates as a wave [13]. Wave is the disturbance that runs through the space and time, trans- ferring energy, little/no associated with the mass trans- port; instead there are oscillations around almost fixed positions. Within wave, phase of the oscillation is dif- ferent for adjacent points in space because the vibration reaches these points at different times [14]. The mechanical wave in substance propagates as elas- tic deformation and velocity shown in phase velocity. Wave phase velocity (vp) is given by the equation: vp = λf (λ-wave length, f-fluctuation frequency). The phase velocity for waves in a medium is determined in part by intrinsic properties of the medium. For all mechanical waves in elastic media, the square of the phase velocity is proportional to the ratio of the appropriate elastic property of the medium to the appropriate inertia prop- erty. Wave velocity within the material is independent of the wave amplitude [15]. When a wave encounters a boundary which is neither rigid (hard) nor free (soft) but instead somewhere in bet- ween, part of the wave is reflected from the boundary and part of the wave is transmitted across the boundary. The exact behavior of reflection and transmission de- pends on the material properties on both sides of the boundary. If a pulse crosses the boundary from a denser medium into a less dense medium, the speed and the wavelength are both increased. The frequency of the incident pulse is the same as the frequency of the transmitted pulse. At the soft boundary, the restoring force is zero and the reflected wave has the same polar- ity (no phase change) as the incident wave [16]. Arterial pulse pressure evaluating in the initial systole, move on arteries and it is not caused by the forward movement of the blood: blood stroke volume forming distension of the medium and pulse pressure propagates through the aorta in waveform by elastic deformation of the vessel wall and the blood [17,18]. Further to elastic, sliding deformation of the blood is accompanying. The large arteries, i.e., aorta, pulmonary artery and their ma- jor branches are referred to elastic arteries because of the presence of relatively large amounts of elastin. The structural features of various segments of the arterial tree have a functional significance in the conversion of dis- continuous ventricular output to a continuous flow in the peripheral circulation. Due to the dispensability of the large arteries and the resistance encountered in the pe- ripheral circulation, a portion of the blood ejected by the ventricle is stored in the large arteries during systole. In diastole stored blood is released, thus maintaining the continuity of peripheral blood flow and preventing ex- cessive fall in arterial pressure [19]. Pulse oscillation in arterial wall increases strain rate to the contiguous wall flow layers. In our cases in image area at the time 0.043 sec initial net flow = 0, mean os- cillation velocity v = 3-5 cm/sec, distance to the wall r = 0.5 cm. Oscillatory strain rate = 6-10 sec–1. Due to vis- cosity/strain rate graph, at the strain rate up to 1 sec–1 blood viscosity sharply (more than x30) decreased. The changes in viscosity are a result of modification in arrangement, orientation and stretching of the red blood cells. In the low shear rate region the cells are en- countered in large aggregates and as the shear rate in- creases, the size of the aggregates diminish. At the mid shear rates, near unit strain internal stress due to pressure is sufficient to separate the aggregated cells causing breakage of aggregates (creep). Increasing shear rate causes the cells to orient in the direction of flow. Above a unit strain, a cell is forced to move past its adjacent neighbour. At the high shear stress rates blood forms layers of stretched and packed red blood cells sliding on layers of plasma. Pulse wave velocity from aorta to small arterial wall is ≈ 7-15-35 m/sec. Pressure wave velocity in blood is ≈ 6-8 m/sec. Peak flow velocity in aorta is ≈ 1.2-1.4 m/sec. [20]. At the identical frequency, wave length to the ves- sel wall and adjoining flow blood slice must be different. Initiation of the strain rate and blood flow is shown on the stream surface and gradually involves the whole blood mass. So, phase delayed creep flow becomes sim-  M. Beraia / HEALTH 2 (2010) 532-540 Copyright © 2010 SciRes. Openly accessible at http://www.scirp.org/journal/HEALTH/ 537 537 pler. These correlations are more expressed at the pro- ximal aorta. Here pulse wave oscillation amplitude is high and blood in systole reveals inertio-elastic proper- ties. To the distal pulse wave attenuates and boundary layer enlarges, flow becomes viscous. Blood viscoelastic transformation is one of the main reasons for the low flow velocity at the high systolic pressure at the distal arterial tree (Figure 6). Blood flow (creep/relaxation) delays to the pressure wave oscillation by the phase. Pressure and flow phase difference in viscoelastic flow is shown in Womersley’s number-α. (α = d/2√2πfρ/μ. d-diameter, f-fluctuation frequency, ρ-density, μ-viscosity). It defines relationship between elastic and viscous stress during the pressure oscillation and shows which part of the pipe is occupies by the boundary layer’s viscous flow. In the large arter- ies, boundary layer is less than the blood volume pro- vided by the pressure [5]. At the 43 msec. distances propagating by the pressure wave is about 28-60 cm. and covers all of the imaged places. At the ascending aorta Flow is inertio-elasatic. Elas- ticity is promoted by the blood and vessel wall structure. Womerslay’s number is 12.5 ± 1.5. In the elastic material phase angle between causative force-pulse pressure and strain rate (blood systolic oscillation) is low (Figure 7). Blood viscous stress exceeds to elastic and pulse energy stored mostly in the substance. In systole blood mostly oscillates; there is no/low creep flow. Creep flow phase delay to pressure is about 85˚; oscillatory (creep) flow amplitude is low. Flow amplitude is characterized by the relation of the maximum volumetric flow rate Qmax (volume of the fluid which passes through a given surface per unit time), to the stationary volumetric flow rate-Qst (flow rate which would be established at the maximum gradient pressure at the Poiseuille’s flow) (Figure 7). This is main reason for the low initial sys- tolic flow acceleration. Figure 6. Transformation of the inertio-elastic flow to viscous through the time; boundary layer formation at the ascending aorta (3D reconstruction of the mean velocity in voxels inside the imaging slice). At the in initial systole pulse oscillation is noted at the stream surface. b and c. Inertio-elastic flow with the flat profile (plane wave at high Womerersley’s number). d. Viscous (Poiseuille’s) flow with the lower Womersley’s number at 350msec. In difference to–a, flow profile is parabolic, although flow time is the same–50msec. (at 300msec velocity is zero).  M. Beraia / HEALTH 2 (2010) 532-540 Copyright © 2010 SciRes. Openly accessible at http://www.scirp.org/journal/HEALTH/ 538 40° 80° Figure 7. Pressure and flow phase delay in viscoelastic flow at the different sites of aorta. Elastic/viscous stress correlation in the material (above), flow amplitude (middle-comparable with the net flow) and pressure/flow phase delay (below) at the sinusoidal varying pressure with the increasing Womersley’s number-α. Blood is thyxotropic and decreases in the apparent viscosity under shearing, followed by a gradual recovery when the shear is removed. The effect is time dependent. In diastole pressure is less pulsating. Pressure exposi- tion time for the viscoelastic creep flow is higher than that for the systole. These correlations are more expr- essed at the distal aorta. Here pressure dissipates in blood structural rearrangement. Womerslay’s number is 7.3 ± 1.2. In the viscous material phase angle between the causative force - pulse pressure and strain rate (creep flow) is high (Figure 7). Flow is more viscous/less iner- tial. Creep flow phase delay to pulse pressure decreases (about 40˚). Flow amplitude and net flow is high. Ratio of mean/net blood flow shows wiscoelastic properties of the local circulatory system. Ratio of the (dynamic) viscous force to the inertial force (fluid density) is characterized by the kinematic viscosity. Kinematic viscosity with diameter of the ves- sel defines Womerslay’s number. At the lower Womer- sley’s number flow profile is parabolic and volumetric flow rate is determined by the instant pressure. Aforesaid is especially importance at the end diastole and to the distal arterial tree. At the aortic arch blood circular movement facilitates flow velocity dispersion. In initial protodiastole blood flow is separated into the opposite flowing streams. Later streams have identical direction (flow recirculat- ion). (Figure 8). In line of our date, protodiastolic and systolic flow waves initially have different frequencies and at the su- perposition do not resist to each other [20]. Wave super- position facilitates to increase strain rate: blood particles at the same time participating in different oscillations. It causes to high net flow at the diastole as shown in graphs and can simplify blood outflow in the different arterial branches. Here stress must be sufficient to caus- ing breakage of the red cell aggregates. (Figures 1(d)- 5(d)). At the isthmus area (end/entrance of the circle flow) separating flow waves at 300-400 msec have identical frequencies and phase (antegrade directed waves are formed at the same places of Walsalva sinuses), so they can interfere. (Figure 3(a)). Here at the destructive in- terference flow velocity is zero and further sharply in- creases. Flow anterograde acceleration in protodiastole is 6 times higher than in systole. At zero velocity systolic kinetic energy of the blood passes in to potential energy of the vessel wall. Wall elastic stress increases, wall os- cillation basic frequency changes and systolic pulse wave can be attenuates. At the isthmus area flow wave with the high accelera- tion changes position from external to internal wall. Circumstances can be promoted by the presence of the recirculation zones. Wave propagation on the graphs is similar to the wave reflection at the boundaries (Figure 8). Obviously, systolic energy of the heart transforms in space and time by the elastic oscillation and/or viscous sliding of the blood elements. Movement is always in waveform. At the wave destructive interference high elastic stress facilitates initial recirculation at the exter- nal aortic wall. By our dates, in protodiastole blood peak velocity at the external wall is much higher than that of systolic and peak shear stress is about 25 N/m2. But just before the flow local pressure is much higher than at the flow and is equal to shear stress, it exceeds thresholds of the elas- tic deformation and as the outer slice of the blood is ad- hesive to the wall, forming endothelial denudation. At the place with the high local pressure flow wave reflects, i.e., wave velocity vector changes in quantity and direc- tion. At the hard boundary restoring force is high and the reflected wave has the different polarity to the incident wave (phase changes). But endothelial layer is not ab- solutely hard and wave can shift the vessel wall. The ground substance, non-cellular components of extracellular matrix fibers in the human body, is thyxot- ropic and acts as a support for the cells. It seems that at the high shear stress to the viscoelastic transformation undergo not only blood cells, but extracellular matrix too. The more so as cholesterol in experimental membranes  M. Beraia / HEALTH 2 (2010) 532-540 Copyright © 2010 SciRes. Openly accessible at http://www.scirp.org/journal/HEALTH/ 539 539 Figure 8. Flow wave reflection and recirculation sites at the different sites of the aortic arch. Dotted line – separated flow stream in retrograde (at 190-300msec) and anterograde (after 300msec) direction at the different walls of the aortic arch. At the isthmus wave node is displaced to the vessel wall. can modify lateral tension and surface viscosity of the lipid bilayers [21]. In atherosclerosis it can be compen- satory reaction of the vessel wall to the increased stress. Flow wave interference with the reflection at the ex- ternal wall also specified to the distal part of the ascend- ing aorta (opposite to isthmus), but flow acceleration is much lower than at the isthmus area. Aortic dissection is characteristic for those areas. It is significant that red blood cell aggregation affects blood viscoelasticity, but shear stress threshold to de- struction of erythrocyte membrane is 6 times higher than for the endothelial sheet and erythrocyte membrane can move around the cell. Pathological data have shown that atherosclerotic change in children and young adults can be correlated with the presence of the same factors as it is identified in adults [22]. Circular movement at the arterial bifurcation can be facilitated by the same changes as at the aortic arch. It seems that at the vessel branching sites wave superpose- tion increases net flow, but is fraught with the endothe- lial denudation. Modified arterial pulse can be used as an atherosclerosis prevention factor. To obtain more spe- cific information about the flow physiology in protodi- astole and blood viscoelastic modification during the cardiac cycle, studies must be continued. Author hopes for cooperation with the other institutes. 5. CONCLUSIONS Systolic pulse oscillation in arterial wall increases strain rate to the contiguous wall blood flow layers. At the circular sites flow separation and wave super- position promotes to the blood viscoelastic modification and high net flow in diastole. At the distinct circular area flow wave superposition forms destructive interference. Here wall systolic pulse oscillation attenuates and flow wave reflects. In protodiastole anterograde directed viscous flow re- circulation with the high acceleration and wave reflec- tion shifts the endothelial layer.  M. Beraia / HEALTH 2 (2010) 532-540 Copyright © 2010 SciRes. Openly accessible at http://www.scirp.org/journal/HEALTH/ 540 REFERENCES [1] Crowther, M.A. (2005) Pathogenesis of atherosclerosis. Hematology, 1(1), 436-441. [2] Russel, R. (1999) Atherosclerosis–an inflammatory dis- ease. The New England Journal of Medicine, 340(2), 115-126. [3] Peter, L., Ridker, P.M. and Attilio, M. (2002) Inflamma- tion and atherosclerosis. Circulation, 105(9), 1135-1143. [4] Tuveli, M. (2001) Pathophysiological aspects of vascular disease: role of hemodinamic factors. Technical Report. CRS4, Center for Advanced Studies, Researche and de- velopment in Sardinia, Cagliari. [5] Pedley, T.J. (1980) The fluid mechanics of large blood vessels. Cambridge University Press, Cambridge. [6] Groisman, A. and Steinberg, V. (2004) Elastic turbulence in curvilinear flows of polymer solutions. New Journal of Physics, 6(29), 74437-74437. [7] Almeder, C.R. (1997) Simulation of the Human Arterial System. Diplomarbeit ausgefuhrt ander Abteilung fur Simulationstechnik des Instituts fur Analysis, Technische Mathematik und Versicherungsmathematik an der Tech- nische Universitat Wien, Wien. [8] Gotz, J. (2006) Numerical Simulation of blood flow in aneurysms using the lattice boltzmann method. Master Thesis, Lehrstuhl für Informatik, Erlangen. [9] Mandal, P.K. (2005) An unsteady analysis of non- New- tonian blood flow through tapered arteries with stenosis. International Journal of Non Linear MechAnics, 40(1), 151-164. [10] Dintenfass, L. (1962) Thixotropy of the blood and pro- neness to thrombus formation. Circulation Research, 11 (2), 233-239. [11] Brujan, E.A. (2000) Collapse of cavitation bubbles in blood. Europhysics letters, 50(2), 175-181. [12] Lakes, R.S. (2009) Viscoelastic materials. Cambrige Uni- versity Press, New York. [13] Guyton, G. and Hall, J.E. (2006) Textbook of medical physiology. 11th Edition, Elsevier, Philadelphia. [14] Billingham, J. and King, A.C. (2000) Wave motion. Cambridge Texts in Applied Mathematics, Cambridge University Press, Cambridge. [15] Pain, H.J. (2005) The physics of vibration and waves. 6th Edition, John Wiley & Sons Ltd., England. [16] Korpas, D., Halek, J. and Dolezaz, L. (2009) Parameters describing the pulse wave. Physiological Research, 58(4), 473-479. [17] Mackenzie, I.S., Wilkinson, I.B. and Cockcroft, J.R. (2002) Assesment of arterial stiffness in clinical practice. QJM: Oxford Journal Medicine, 95(2), 67-74. [18] Kitawaki, T. and Shimizu, M. (2005) Effect of the blood vessel viscoelasticity on the blood pressure wave propa- gation (Numerical analysis using one-dimen- sional vis- coelastic tube model). Transactions of the Japan Society of Mechanical Energies, 71(707), 1768-1775. [19] Aggoun, Y. and Beghetti, M. (2002) Noninvasive as- sessment of arterial function in children: Clinical appli- cation. Images Pediatric Cardiology, 13, 12-18. [20] Beraia, M., Todua, F. and Khomeriki, O. (2006) Protodi- astole and vessel damage in atherosclerosis. Biocyber- netics and Biomedical Engineering, 26(3), 65-75. [21] Hiderbrand, M.F. and Bayerl, T.M. (2005) Differences in the modulation of collective membrane motions by er- gosterol, lanosterol and cholesterol: A dynamic light scattering study. Biophysical Journal, 88(5), 3360-3367. [22] Wennemann, P. (2008) Particle image velocimetry for microscale blood flow measurement. Gildeprint, En- schede. |