Paper Menu >>
Journal Menu >>
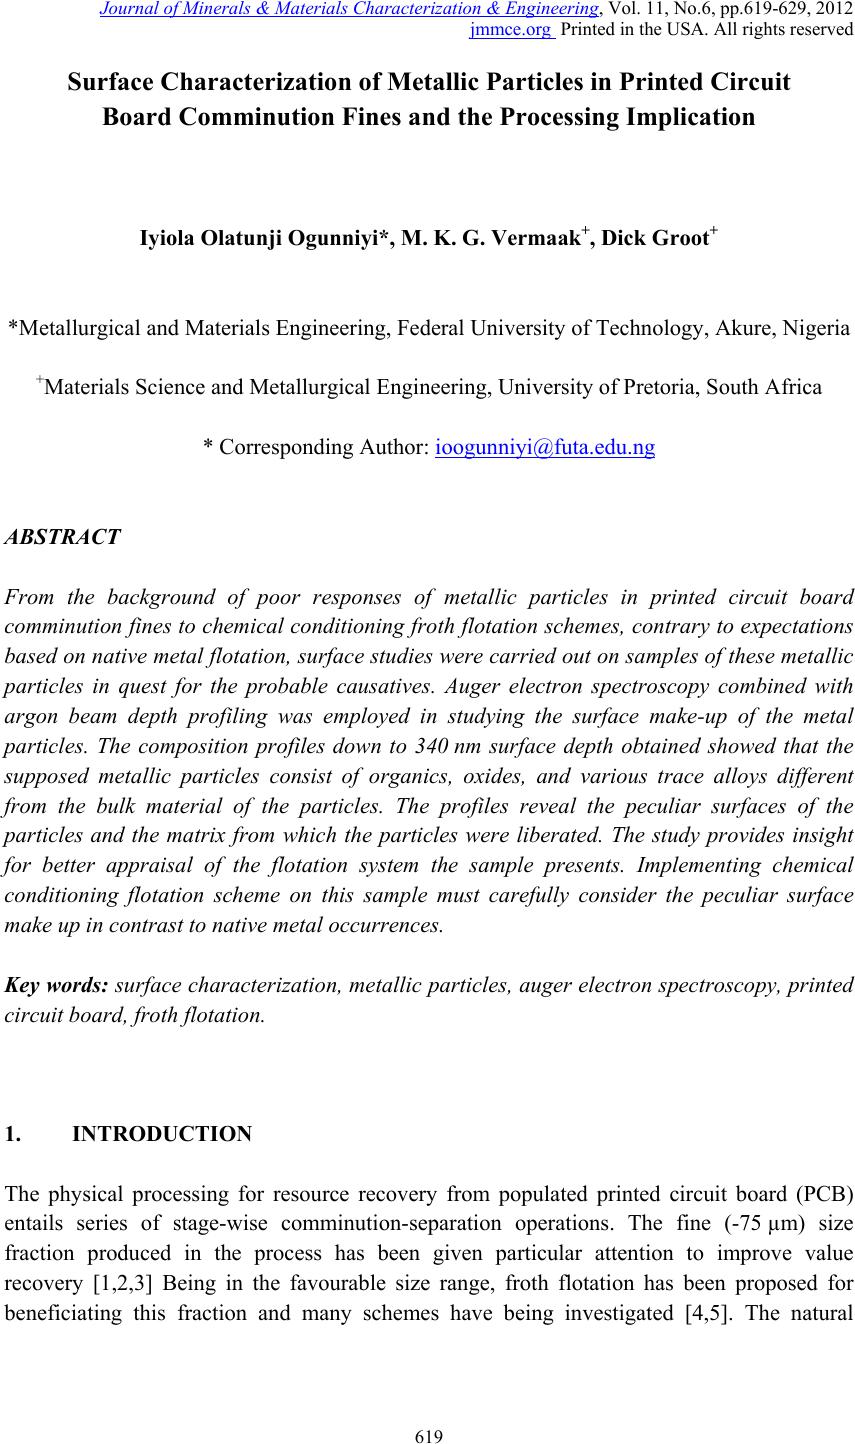 Journal of Mi nerals & Materials Characteriza tion & Engineering, Vol. 11, No.6, pp.619-629, 2012 jmmce.org Printed in the USA. All rights reserved 619 Surface Characterization of Metallic Particles in Printed Circuit Board Comminution Fines and the Processing Implication Iyiola Olatunji Ogunniyi*, M. K. G. Vermaak+, Dick Groot+ *Metallurgical and Materials Engineering, Federal University of Technology, Akure, Nigeria +Materials Science and Metallurgical Engineering, University of Pretoria, South Africa * Corresponding Author: ioogunniyi@futa.edu.ng ABSTRACT From the background of poor responses of metallic particles in printed circuit board comminution fines to chemical conditioning froth flotation schemes, contrary to expectations based on native metal flotation, surface studies were carried out on samples of these metallic particles in quest for the probable causatives. Auger electron spectroscopy combined with argon beam depth profiling was employed in studying the surface make-up of the metal particles. The composition profiles down to 340 nm surface depth obtained showed that the supposed metallic particles consist of organics, oxides, and various trace alloys different from the bulk material of the particles. The profiles reveal the peculiar surfaces of the particles and the matrix from which the particles were liberated. The study provides insight for better appraisal of the flotation system the sample presents. Implementing chemical conditioning flotation scheme on this sample must carefully consider the peculiar surface make up in contrast to native metal occurrences. Key words: surface characterization, metallic particles, auger electron spectroscopy, printed circuit board, froth flotation. 1. INTRODUCTION The physical processing for resource recovery from populated printed circuit board (PCB) entails series of stage-wise comminution-separation operations. The fine (-75 µm) size fraction produced in the process has been given particular attention to improve value recovery [1,2,3] Being in the favourable size range, froth flotation has been proposed for beneficiating this fraction and many schemes have being investigated [4,5]. The natural  620 Iyiola Olatunji Ogunniyi Vol.11, No.6 hydrophobic response is one of the flotation schemes. Implemented as reverse flotation, it remarkably enriched the sink fractions with the metallic values. Various chemical conditionings schemes were investigated. These include: potassium amyl xanthate (PAX) conditioning for bulk metallic flotation, based on describable interaction of xanthates with metal surfaces and bulk flotation schemes in complex ores [6 - 12]; sodium hydrogen sulphide activation to PAX drawing from activation of oxidized copper mineral [6]); conditioning with sodium mercaptobenzothiazole (SMBT), SMBT being a selective collector for tarnished copper and lead minerals [13]; cationic conditioning with tetra butyl ammonium chloride based on particles surface potential [6, 14]. Depressants applications were also considered: employing carboxyl methyl cellulose as in conventional macromolecular depression [6], and a gamma depression scheme with ethoxy nonyl phenol as the active surfactant, based on the Zisman’s critical surface tension concept [15]. Responses to these reagents were not encouraging. A probable cause can be surface oxidation of the metallic particles and generally low reactivity of process finished, end use alloys compared to natural mineral surfaces. The complex flotation system the pulp itself presents cannot be ruled out, with significant calcium depression as another possible explanation for the overall poor response to reagents in the system. A detailed composition characterization gave some insight [16]. Since particle-reagent interaction in froth flotation is purely a surface phenomena, a surface study of the metallic particles in this sample will give insight into the actual surface make up of the particles, clarify the probabilities for explaining observed responses to chemical conditioning, provide basis for clearer appraisal of the flotation system the sample presents and help in making more detailed consideration in further pursuit of flotation beneficiation on this sample. 2. METHODOLOGY 2.1 Selection of Particles and Fibres Particles of the fine samples were of very diverse shapes. There are particles with distinctly elongated morphology such as from glass fibres and from the copper traces within the board laminate. In this context, particles were therefore used only for pieces not having such distinct elongation, while those so elongated were rather qualified as fibres. For the fibres, they are much longer than the dA of 75 µm. The fibres can therefore be easily distinguished in searching the fine sample visually. Samples of copper fibres were seen and picked directly from the –75μm fraction for investigation. There are other metallic fibres visually different in coloration from the copper traces. Sample of such were also picked. For the particles, it is not easy to pick from the sample. If, instead of picking the particles, a small portion of the sample is dispersed and probed directly, it will charge profusely, compromising resolution and signal acquisition; this was actually demonstrated. Charging apart, using beam interaction to search out the particles from the grayscale secondary electron  Vol.11, No.6 Surface Characterization of Metallic Particles 621 image view of the sample inside the microscope will involve time-consuming surveys. Hence, particles from the actual −75 μm could not be used for the surface investigation. To go around this, using corona electrostatic separation, conducting fraction was obtained from the +212 – 300 μm fraction of PCB comminution product. This conducting fraction consists of the assorted metallic particles of interest. The metallic particles surface in this +212 − 300 μm fraction can be taken to exactly represent that of the metallic particles in the −75 μm fraction, since they are screened from product of the same comminution stage. Moreover, it is particularly rich in copper particles, so that a copper surface can be easily picked up from a dispersion of a small sample of this conducting fraction when probed inside the microscope. Copper is a target non-ferrous commodity inside the PCB comminution fine. The behaviour of copper particles in the flotation system is therefore of interest, and characterisation of copper particles will be telling a lot. 2.2 Surface Preparation A small portion of the assorted metallic particles (from the electrostatic conducting fraction) was taken and rinsed in distilled water. Another portion was rinsed in PCB CF pulp filtrate. The rinsing in distilled water creates a surface clean of physical adherence, while rinsing in PCB pulp filtrate create the particle surface that results when the PCB CF sample is pulped in water. Any effect of the content of the pulp liquid on the particle surfaces is thus simulated. The portions were taken in a glass dish drained and allowed to dry in a dessicator at room temperature for four hours. A third portion was taken and untreated. The fibres were also given similar treatments. A few grains from each portion of the assorted particles were placed on separate carbon tape with a clean spatula. The tape was then blown by pure nitrogen gas to remove particles lying on top of others and not directly adhering to the tape. This gave a dispersed monolayer of the particles on the tape. Figure 1 shows a secondary electron image (at 1 kV landing voltage of primary beam) of the particles on carbon tape, as presented for the investigation inside the microscope. The fibres were also carefully placed on the carbon tape with forceps, ensuring that the particles do not roll on the tape in the process. Table 1 summarises the designation and description of the surfaces. In total, eight surfaces were mounted for exposure – three different particles surfaces and five different fibre surfaces. 2.3 Surface Features Study For any tell-tale microscopic physical surface features, high resolution observation of the surface of a PCB copper fibre, was done at 1 kV electron energy using the Carl Zeiss Field Emission Scanning Electron Microscope (FESEM). The characteristic low acceleration voltage of the FESEM was needed for low beam penetration to enhance resolution of surface features.  622 Iyiola Olatunji Ogunniyi Vol.11, No.6 Figure 1: Secondary electron image of assorted metallic particles on carbon tape as presented for auger electron spectroscopy investigation. Table 1: Designation and description of particles surfaces studied by Auger Electron Spectroscopy Designation Description and Surface condition P1 From assorted particles as taken. P2 From assorted particles soaked in process water (PCB pulp filtrate) and dried in open laboratory air. P3 From assorted particles soaked in distilled water and dried in open laboratory air. F1 Copper trace fibre soaked in process water and dried in open laboratory air. F2 Copper trace fibre soaked in distilled water and dried in open laboratory air. F3 Copper trace fibre as taken from the PCB CF sample. F4 A more brownish (possibly copper) fibre as taken from the PCB CF sample. F5 A whitish fibre particle as taken from the PCB CF sample. 2.4 Surface Make-Up Study The surface composition of interest here is effectively a few atomic monolayers. This is the range of interest in surfactant interaction with particles in a flotation pulp. High penetration depths in order of microns in conventional scanning electron microscope (energy dispersive x-ray spectroscopy mode) will not allow such nanometer details to be resolved. Auger spectroscopy is thus the choice technique for the study [17]. Auger electron spectroscopic investigation was done using the PHI 700 Scanning Auger Nanoprobe. For this investigation,  Vol.11, No.6 Surface Characterization of Metallic Particles 623 a survey of auger kinetic energies on each surface was first taken, followed by depth composition profiling for 40 minutes. Surveys were taking every five minutes of profiling. The primary electron beam was kept at a landing voltage of 5 kV and a 10 nA beam current. The argon ion gun was operated at 2 kV, 2 µA, giving about 85 Å sputter depth per minute, as characterised for SiO2. The auger electron kinetic energy surveys for all the surfaces spanned 0 – 2400 eV, to be a comprehensive search for all possible elements. 3. RESULTS AND D ISCUSSION 3.1 Surface Feature on Copper Trace Observation of the copper trace in the FESEM gave the micrograph shown in Figure 2. The ‘log’ in the figure is a micrograph of a bare copper trace particle about 25 µm in diameter. The micrograph gave an indication of a surface that is not purely metallic, indicated by the bright electron charging effect in the micrograph. This effect was observed at a electron voltage of 1 kV. Profuse charging and total blur was observed on fibres at higher voltages. A normal metallic surface would be conducting and would therefore not accumulate charges at the positive polarity of the sample stage inside the microscope. This presupposes the presence of a non conducting layer. This can be an organic coating residue or an oxide layer. Also studying the micrograph, the narrow gully found across the length may indicate a soft left- over of PCB resins on the trace copper particle. Anyhow, it can be inferred that this supposed copper trace may not be exactly copper on the surface. Whatever is the surface make up different from the bulk material of the particle, it is expected that this would impact on projected collector interaction. The auger electron spectroscopy result will be more informative regarding the actual make-up of this surface and other sample surfaces of the particles in the PCB CF. Figure 2: Field emission SEM micrograph of the surface of a PCB copper trace particle.  624 Iyiola Olatunji Ogunniyi Vol.11, No.6 3.2 Surface Composition Profiles Figures 3 to 6 show the depth composition profiles on the surfaces of particle P1, P2 and F2, as well as stacks of kinetic energy spectrum at various depths from the surface on F5. In Figure 3, for particle P1, a high proportion of carbon (76.5 %) and oxygen (about 11.5 %) can be seen on the surface, at time t = 0. The surface survey was done for five minutes shown as −5 to 0 minutes (before profiling commenced) to collect sufficient signal for the surface make up. After five minutes of sputtering, to a depth of about 42 nm (at about 85 Å /minute sputtering), the profile shows that the carbon proportion has reduced remarkably to around 18 %. This continued with a little drop down to about 340 nm (40 minutes of sputtering). Oxygen did not show much drop over this depth. A little representation of tin (about 3%) continued across the profile, while copper fraction increased from below 10% on the surface to above 70 % over this depth. Interpreting this profile, the bulk particle is copper and the surface tin could be from soldering process vapor. The carbon fraction down the depth would represent a more tangible layer of organic material on the surface, which could even be up to few microns thick, when comparing the depth impression mentioned on Figure 2 for instance. The oxygen profile, on the surface, could be taken as a contribution majorly from the atmosphere and partly due to oxidation of the metal on the surface. Into the surface, the metal concentration increases and so would be the fraction of oxygen from metal oxidation. The slight increase in oxygen concentration when metallic fraction shot up at the fifth minute survey somehow shows this. Away from the surface, the oxidation shows a slight decrease (surface atmospheric contribution being relegated), but the layer down to the end of the profile generally remains oxidized. Figure 3: Depth concentration profiles from AES surveys on the surface of particle P1 at various sputtering times (indicative of depths) from the surface.  Vol.11, No.6 Surface Characterization of Metallic Particles 625 From this profile on P1, some explanation can readily be presented for flotation responses obtained from copper in this sample. The surfaces can be coated by a fairly thick layer (in atomic order) of organic matter, which can be hydrophobic. The thicker such coating is on a particle, the lesser the chance that it will respond to chemical conditioning; with a range of middling behaviours varying with the thickness. The surface oxidation down to a depth above 300 nm would explain the poor response to xanthate collector, as well as the slight improvement on sulfidation. The profile of P2 is shown in Figure 4. This is similar to that of P1, except for some trace elements such as sulphur and chlorine found on the surface. As P2 was soaked in process water, these elements indicate that some ions in the process water interacted with the surface. It shows, as mentioned, that species from the sample in the pulp really interacted with the surfaces, and will bias the behavior of the surfaces. The fact that trace elements can be detected down to the depths profiled shows a possible ingress through surface matter still porous at that scale of size, such as organics. Figure 4: Depth concentration profile from AES surveys on the surface of particle P2 at various sputtering times indicative of depths from the surface. The profile for P3 is shown in Figure 5. Particle P3 was soaked in distilled water and the profile does not show such elements from process water ions as found on P2. This profile can be compared to that of P1.The relatively higher tin may not be taken to imply that P3 is a Cu-Sn alloy because tin commenced continuous decay after five minutes of sputtering. Rather, the profile shows possibly how close this particle surface was to a soldered junction or PCB via. In any case, the profile does show how the flotation response of a supposedly  626 Iyiola Olatunji Ogunniyi Vol.11, No.6 copper particle can be expected to vary due to deposition of another metal on the surface in the production process. Profiles on the surfaces of the fibre particles F1, F2, F3 and F4, are effectively alike and the one for F3 is shown in Figure 6. The surfaces show carbon above 90%, oxygen and nitrogen, down through the depth profiled: no metallic fraction. This surface is essentially a thick organic layer. The presence of this much layer of organic on the surface can be reconciled with the understanding that the fibres were liberated from the actual copper trace of the board laminate which was right inside board resins. Such a full organic surface coating would make such particles essentially hydrophobic. This will give a reason why such particles can be found in the float under the natural hydrophobic response scheme flotation of PCB CF [5]. The response of these trace particles can therefore be expected to depend totally on the mechanisms of natural hydrophobic response bubble attachment and detachment due to the elongated form, and to be totally isolated from reagent conditioning, as the surface compositions did not show any metallic fraction. Figure 5: Depth concentration profile from AES surveys on the surface of particle P3 at various sputtering times indicative of depths from the surface. Figure 7 shows the profile of the whitish fibre particle F5. The profile shows this fiber particle to be essentially a nickel-copper alloy with surface oxidation, as oxygen dropped from about 17% on the surface to around 6% at the final depth profiled. The high presence of calcium and silicon suggest the possible presence of glass fibre partially fused on this particle at this spot during comminution. Trace tin present is possibly from soldering. Some trace sulphur and nitrogen can also be seen, all presenting the reality of a typical surface in an end 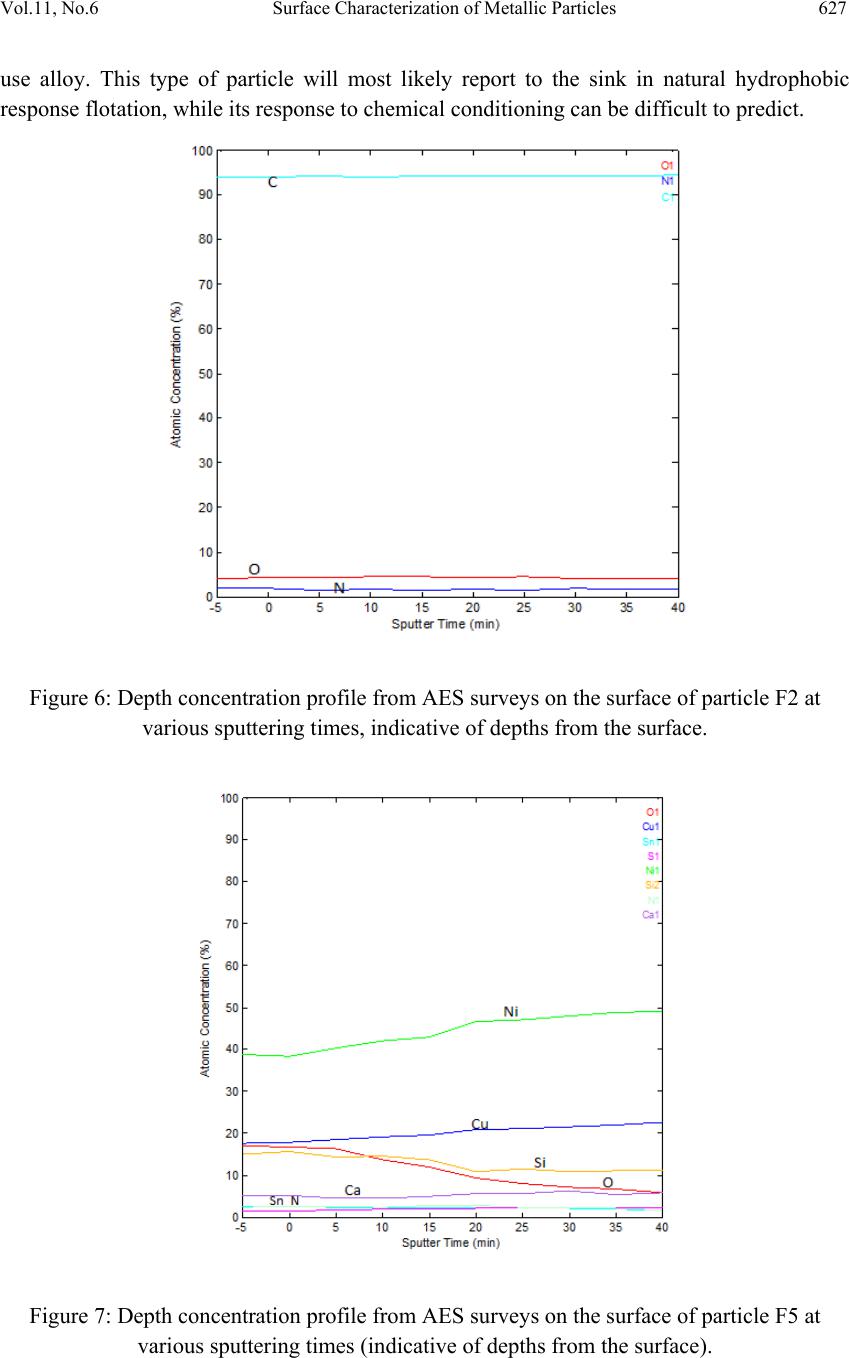 Vol.11, No.6 Surface Characterization of Metallic Particles 627 use alloy. This type of particle will most likely report to the sink in natural hydrophobic response flotation, while its response to chemical conditioning can be difficult to predict. Figure 6: Depth concentration profile from AES surveys on the surface of particle F2 at various sputtering times, indicative of depths from the surface. Figure 7: Depth concentration profile from AES surveys on the surface of particle F5 at various sputtering times (indicative of depths from the surface).  628 Iyiola Olatunji Ogunniyi Vol.11, No.6 This surface analysis has shed some light on the reality of the surfaces of metallic particles in the PCB CF. In pulp, the atmospheric carbon can be considered washed off, the remaining surfaces ranging from totally organic to totally oxide, with a series of middling coverage possible in between. The response to chemical conditioning in most of the particles could be mostly due to relative inertness when the surface is covered by an organic layer. Fractional oxide representation of the surface still makes some activation possible, as with sulfidation to xanthate, but this is not remarkable due to the high fraction of the surface that is inert. Ionic species in pulp can also be found to interact with the surface, depositing ions that can interfere with reagent activity. 4. CONCLUSION Surface investigations, with field emission scanning electron microscope and auger electron spectroscopy with composition depth-profiling, revealed the presence of organic layers on surfaces of metallic particles in PCB CF. The surfaces were also found to be oxidised down to about 340 nm depth profiled. None of the surface is pure alloy but occurring in forms that are relatively inert to reagents, hence poor responses obtained when executing different chemical conditioning froth flotation schemes on this fines sample. The understanding of the surface make up as revealed is very useful in further pursuits of froth flotation beneficiation of the PCB CF sample. REFERENCES [1] Galbraith, P. and Devereux, J. L., 2002: Beneficiation of printed wiring board with gravity concentration. IEEE International Symposium on Electronics and the Environment. [2] Zhao, Y., Wen, X., Li, B., and Tao, D., 2004. Recovery of copper from printed circuit boards’, Minerals and Metall. Processing, Vol. 21, No. 2, pp. 99 – 102. [3] Xuefeng, W., Yuemin, Z., Chenlong, D., Xiaohua, Z., Hongguang, J., and Shulei, S., 2005. Study of metal recovery from discarded printed circuit boards by physical methods. IEEE Int. Symposium on Electronics and the Environment. [4] Ogunniyi, I. O. and Vermaak, M.K.G., 2009a. Froth flotation for beneficiation of printed circuit board comminution fines: an overview”. Minerals Processing and Extractive Metallurgy Review, Vol. 30 (2), pp. 101 – 121. [5] Ogunniyi, I. O. and Vermaak, M.K.G., 2009b: “Application of froth flotation for beneficiation of printed circuit board comminution fines.” Mineral Engineering, Vol. 22, pp. 378-385. [6] Wills, B. A. and 2007. Mineral processing technology. Sixth Ed., Pergamon Press, UK. [7] Woods, R, 1996. Chemisorption of thiols on metals and metals sulfides. Modern Aspects of Electrochemistry, No. 29, Edited by John O’M. Bockris et al., Plenum Press New York, 1996. [8] Nagaraj, D.R., Brinen, J., Farinato, R. and Lee, J., 1991. A study of interactions of dicresyl monothiophosphate with noble metals by electrochemical and spectroscopic methods. SME Annual. Meeting, Denver, Colorado. 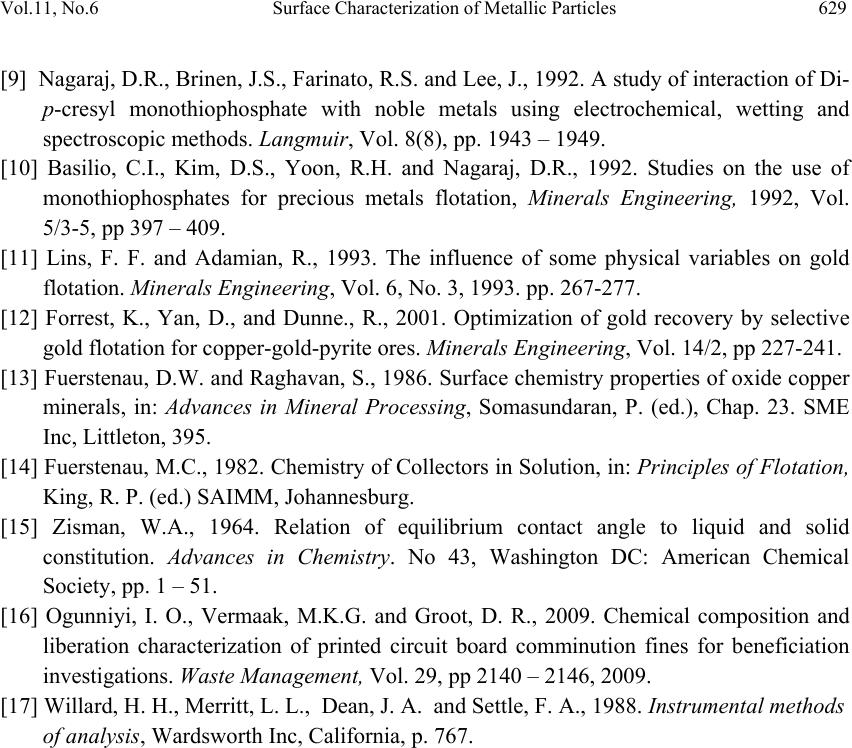 Vol.11, No.6 Surface Characterization of Metallic Particles 629 [9] Nagaraj, D.R., Brinen, J.S., Farinato, R.S. and Lee, J., 1992. A study of interaction of Di- p-cresyl monothiophosphate with noble metals using electrochemical, wetting and spectroscopic methods. Langmuir, Vol. 8(8), pp. 1943 – 1949. [10] Basilio, C.I., Kim, D.S., Yoon, R.H. and Nagaraj, D.R., 1992. Studies on the use of monothiophosphates for precious metals flotation, Minerals Engineering, 1992, Vol. 5/3-5, pp 397 – 409. [11] Lins, F. F. and Adamian, R., 1993. The influence of some physical variables on gold flotation. Minerals Engineering, Vol. 6, No. 3, 1993. pp. 267-277. [12] Forrest, K., Yan, D., and Dunne., R., 2001. Optimization of gold recovery by selective gold flotation for copper-gold-pyrite ores. Minerals Engineering, Vol. 14/2, pp 227-241. [13] Fuerstenau, D.W. and Raghavan, S., 1986. Surface chemistry properties of oxide copper minerals, in: Advances in Mineral Processing, Somasundaran, P. (ed.), Chap. 23. SME Inc, Littleton, 395. [14] Fuerstenau, M.C., 1982. Chemistry of Collectors in Solution, in: Principles of Flotation, King, R. P. (ed.) SAIMM, Johannesburg. [15] Zisman, W.A., 1964. Relation of equilibrium contact angle to liquid and solid constitution. Advances in Chemistry. No 43, Washington DC: American Chemical Society, pp. 1 – 51. [16] Ogunniyi, I. O., Vermaak, M.K.G. and Groot, D. R., 2009. Chemical composition and liberation characterization of printed circuit board comminution fines for beneficiation investigations. Waste Management, Vol. 29, pp 2140 – 2146, 2009. [17] Willard, H. H., Merritt, L. L., Dean, J. A. and Settle, F. A., 1988. Instrumental methods of analysis, Wardsworth Inc, California, p. 767. |