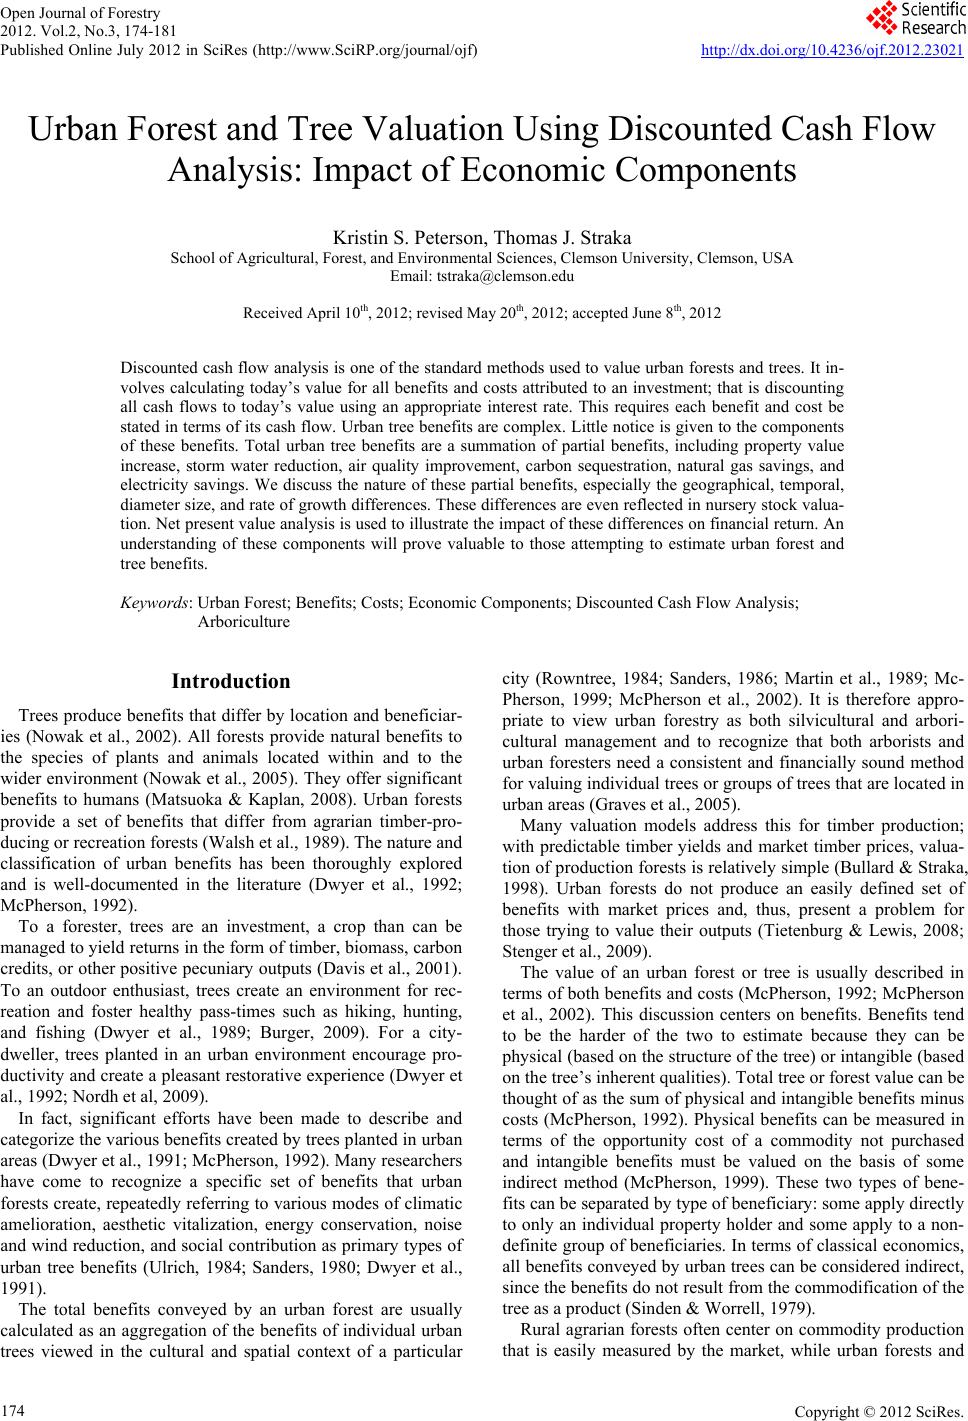
 Open Journal of Forestry 2012. Vol.2, No.3, 174-181 Published Online July 2012 in SciRes (http://www.SciRP.org/journal/ojf) http://dx.doi.org/10.4236/ojf.2012.23021 Copyright © 2012 SciRes. 174 Urban Forest and Tree Valuation Using Discounted Cash Flow Analysis: Impact of Economic Components Kristin S. Peterson, Thomas J. Straka School of Agricult ural, Forest, and Environmental Sciences, Clemson University, Clemson, USA Email: tstraka@clemson . edu Received April 10th, 2012; revised May 20th, 2012; accepted June 8th, 2012 Discounted cash flow analysis is one of the standard methods used to value urban forests and trees. It in- volves calculating today’s value for all benefits and costs attributed to an investment; that is discounting all cash flows to today’s value using an appropriate interest rate. This requires each benefit and cost be stated in terms of its cash flow. Urban tree benefits are complex. Little notice is given to the components of these benefits. Total urban tree benefits are a summation of partial benefits, including property value increase, storm water reduction, air quality improvement, carbon sequestration, natural gas savings, and electricity savings. We discuss the nature of these partial benefits, especially the geographical, temporal, diameter size, and rate of growth differences. These differences are even reflected in nursery stock valua- tion. Net present value analysis is used to illustrate the impact of these differences on financial return. An understanding of these components will prove valuable to those attempting to estimate urban forest and tree benefits. Keywords: Urban Forest; Benefits; Costs; Economic Components; Discounted Cash Flow Analysis; Arboriculture Introduction Trees produce benefits that differ by location and beneficiar- ies (Nowak et al., 2002). All forests provide natural benefits to the species of plants and animals located within and to the wider environment (Nowak et al., 2005). They offer significant benefits to humans (Matsuoka & Kaplan, 2008). Urban forests provide a set of benefits that differ from agrarian timber-pro- ducing or recreation forests (Walsh et al., 1989). The nature and classification of urban benefits has been thoroughly explored and is well-documented in the literature (Dwyer et al., 1992; McPherson, 1992). To a forester, trees are an investment, a crop than can be managed to yield returns in the form of timber, biomass, carbon credits, or other positive pecuniary outputs (Davis et al., 2001). To an outdoor enthusiast, trees create an environment for rec- reation and foster healthy pass-times such as hiking, hunting, and fishing (Dwyer et al., 1989; Burger, 2009). For a city- dweller, trees planted in an urban environment encourage pro- ductivity and create a pleasant restorative experience (Dwyer et al., 1992; Nordh et al, 2009). In fact, significant efforts have been made to describe and categorize the various benefits created by trees planted in urban areas (Dwyer et al., 1991; McPherson, 1992). Many researchers have come to recognize a specific set of benefits that urban forests create, repeatedly referring to various modes of climatic amelioration, aesthetic vitalization, energy conservation, noise and wind reduction, and social contribution as primary types of urban tree benefits (Ulrich, 1984; Sanders, 1980; Dwyer et al., 1991). The total benefits conveyed by an urban forest are usually calculated as an aggregation of the benefits of individual urban trees viewed in the cultural and spatial context of a particular city (Rowntree, 1984; Sanders, 1986; Martin et al., 1989; Mc- Pherson, 1999; McPherson et al., 2002). It is therefore appro- priate to view urban forestry as both silvicultural and arbori- cultural management and to recognize that both arborists and urban foresters need a consistent and financially sound method for valuing individual trees or groups of trees that are located in urban areas (Graves et al., 2005). Many valuation models address this for timber production; with predictable timber yields and market timber prices, valua- tion of production forests is relatively simple (Bullard & Straka , 1998). Urban forests do not produce an easily defined set of benefits with market prices and, thus, present a problem for those trying to value their outputs (Tietenburg & Lewis, 2008; Stenger et al., 2009). The value of an urban forest or tree is usually described in terms of both benefits and costs (McPherson, 1992; McPherson et al., 2002). This discussion centers on benefits. Benefits tend to be the harder of the two to estimate because they can be physical (based on the structure of the tree) or intangible (based on the tree’s inherent qualities). Total tree or forest value can be thought of as the sum of physical and intangible benefits minus costs (McPherson, 1992). Physical benefits can be measured in terms of the opportunity cost of a commodity not purchased and intangible benefits must be valued on the basis of some indirect method (McPherson, 1999). These two types of bene- fits ca n be se pa ra t ed by type of beneficiary: some apply directly to only an individual property holder and some apply to a non- definite group of beneficiaries. In terms of classical economics, all benefits conveyed by urban trees can be considered indirect, since the benefits do not result from the commodification of the tree as a product (Sinden & Worrell, 1979). Rural agrarian forests often center on commodity production that is easily measured by the market, while urban forests and  K. S. PETERSON, T. J. STRAKA trees produce many intangible benefits that are not so easily measured (Klemperer, 1996). While these services contribute to the overall quality of urban populations, producing a realistic valuation estimate for them is complicated due to the absence of a market that trades these intangible benefits, thereby setting a value for the service provided (Price, 2003). Measuring intangible benefits requires different valuation strategies than those that are used for tangible, or tradable, benefits. Some nonmarket valuation strategies for intangible benefits include contingent valuation (Tyrväinen & Väänänen, 1998), willingness-to-pay (Lorenzo, 2000), or willingness-to- participate in alternative scenarios (Zhang et al., 2007). These methods are difficult to apply in real world situations. More applied, less rigorous, and more understandable estimates of benefits are often desirable. We describe an effective, cheaper, and less intensive method to approach this problem. One way to economically and efficiently calculate the bene- fits from an urban tree or forest is to use conventional on-line tree valuation software programs (Peterson & Straka, 2011). Just like the many computer models that estimate financial re- turns from timber production, similar software exists for urban trees. Two examples are the Urban Forest Effects Model— UFORE (USDA Forest Service, 2012) and the National Tree Benefit Calculator (NTBC) (Casey Trees and Davey Tree Ex- pert Company, 2012). These models are designed to deal with the immense variety in urban tree location, species, and condi- tions. The NTBC calculates the benefits from selected urban trees in the categories of property value, storm water reduction, air quality enhancement, carbon sequestration, natural gas savings, and electricity savings. Other software models calcul ate similar benefits for urban trees. The NTBC is a highly-regarded, well- developed model, and estimates some of the most commonly valued benefits in urban tree situations. It is the basis of the estimates discussed below. The objective of this study was to provide insight to urban foresters and arborists on the na ture of individual tree and urban forest benefits. The total economic value of urban trees is the sum of partial benefits. These benefits generally follow the traditional expected economic patterns for a “growing” invest- ment, but the patterns show interesting variation by tree species and geographic location. Foresters and arborists would intui- tively know this: an oak and pine would have different benefit patterns due to respective species characteristics, and an oak in Atlanta, Georgia might not have the same value as an identical oak in Seattle, Washington due to geographical differences. We show how these patterns generally differ to illustrate the neces- sity to carefully consider how benefit flow pattern will impact individual tree and urban forest financial analyses. The Nature of Urban Forest and Tree Benefits The benefits of urban forests and trees are well-defined in the literature (American Forests, 2001). Before discussing the eco- nomic components of these benefits, the dozen most commonly identified benefits will be briefly described as background. These same benefits will be used to establish economic com- ponents. Energy savings result from the shade created by trees, which reduced the cost of cooling in summer and heating in winter. Shade is produced by shadow coverage by leaf surface area and has been described as mitigation for the common “heat island” effect often seen in cities (Hamada & Ohta, 2010). Trees with dense crowns actually can create microclimates closely around them and direct shading significantly reduced solar radiation (Heisler, 1986; Hardin & Jenson, 2007). One single 8 m tall tree was shown to reduce residential heating and cooling costs by about 10% annually (McPherson & Rowntree, 1993). Windbreak savings result from protection of structures from hazardous gust or precipitation (Dewalle & Heisler, 1988; McPherson & Rowntree, 1993). Windbreaks may also reduce fuel use by acting as a natural form of insulation (Heisler, 1986; McPherson et al., 1988). Windbreak effects on heating and cooling relate to wind speed reduction and thermal insulation (He & Hoyano, 2009). Windbreaks can even slow the disper- sion and intensity of foul odors (Lin et al., 2007). Windbreak savings are highly variable and depend on tree size, leaf poros- ity, structure type, and distance from the structure being pro- tected. Soil enhancement results from trees adding nutrients to the soil, such as nitrogen, by converting chemicals in their roots, dropping nutrient rich foliage in the falls, and aerating the soils through root penetration (Stump & Binkley, 1993; Binkley & Giardina, 1998). Trees influence nutrient availability by bio- logical nitrogen fixation, retrieving nutrients from below the root zone, reducing nutrient loss from erosion and leaching, and release of nutrients from the organic matter (Buresh & Tian, 1998). Plus, a beneficial relationship is formed between fungal mycorrhizae and tree roots that enhances soil characteristics. Tree roots also promote the sequestration of carbon and en- courage underground nutrient transport (Nair et al., 2009). Privacy benefits result from trees creating a barrier between a home and a public area. A single large tree or row of well- planted smaller trees may prevent drive-by traffic from peering into a home or office (Matsuoka & Kaplan, 2008). Trees create a private comfort zone and this privacy is a preference that home buyers will pay for (Johnson, 2008). Also, privacy de- creases the need to protect valuables and for a home alarm sys- tem (Lorenzo et al., 2000). Sound barrier benefits result from trees serving to reduce the impact of sounds. Extended exposure to loud noises promotes human anxiety and illness; a reduction of sound levels increases psychological quality of life and physical health (Arenas, 2009). Leaves and branches, and especially vegetation from the ground up, provide the best sound barrier (Herrington, 1974). Valuations for noise reduction suggest that trees are able to provide roughly six to eight decibels of sound reduction each (Leonard & Parr, 1970). Carbon sequestration results from a tree “locking up” carbon in its woody structures, preventing extraneous particles from escaping into the atmosphere and causing damage to the ozone layer. The decrease in carbon helps limit global warming (Nowak and Crane, 2002). Carbon sequestration benefits from a few urban trees do not have the impact that a dense forest would, but combined, they offer a significant reduction in at- mospheric carbon (Nowak, 1993). Air quality benefits occur when trees reduce the amount of pollutants, especially volatile organic hydrocarbons, such as ozone, sulfur dioxide, and nitrogen dioxide. First, the energy savings described above reduce the pollutants that energy pro- duction would emit by decreasing per capital energy expendi- tures (Yang et al., 2005). Second, trees retain volatile air pol- lutants through a process of deposition (Nowak et al., 2006). This benefit in the United States is worth nearly $4 billion an- Copyright © 2012 SciRes. 175  K. S. PETERSON, T. J. STRAKA nually (Nowak et al., 2006). Strom water reduction results from trees storing water in their crowns and boles, enhancing water quality and reducing water runoff. Especially in urban areas this runoff may contain pollutants and harmful chemicals McPherson, 1999). The vegetative layer produced by trees allows much of this runoff to be absorbed into the soil (Silva et al., 2006). The presence of tree roots supports the soil, preventing harsh floods, mudslides, erosion, and structural damage (McPherson et al., 2002). Recreation and health result from trees being the natural structure for city parks and shaded sidewalks, creating an op- portunity for outdoor activities (Jim & Chen, 2010). Trees have even been shown to contribute to human health (Ulrich, 1984). Trees have been shown to encourage people to engage in physical and healthful activity (Wolf, 2004). Urban trees create an environment that encourages recreational activities like walking, jogging, bird-watching, games, and nature observation (Tyrväinen et al., 2003). Recreational benefits of urban forests can be easily estimated (Nilsson et al., 2011). Aesthetic benefits result from trees increasing the “beauty” of an area, providing shelter for animals, and creating areas for people to visit. While people desire access to urban forests, they also desire the forest at appear to be unmanaged or “wilder- ness” (Price, 2003). Trees also increase residential property value (Anderson & Cordell, 1985; McPherson et al., 2002). Distance from greenspace also impacts this value (Tyrväinen & Miettinen, 2000). Local economic development benefits result from the oppor- tunities trees provide for people to get involved in local com- munities. Residents of the United Kingdom, for example, ac- tively participate in coppicing their urban forests in groups in order to increase public safety and engender community spirit (Nielsen & Møller, 2008). These benefits lead to a community commitment to a better future landscape (Dwyer et al., 1991). District sales increase benefit results from increased com- mercial activity in an urban area with trees. Reduced stress might lead to more enthusiastic consumers and producers. Sales people tend to be more effective in an urban setting with trees (Joye et al., 2010). Urban forestry makes a significant contribu- tion to commercial activity and the local economy (Templeton & Goldman, 1996). The nature of this benefit is a cumulative one, the size of trees and their density pattern in a community impact economic contribution. Urban Forest Costs The discussion on economic components will center on ur- ban forest benefits, but applies also to costs. These costs are important in determining “net benefits” and the four major urban forest costs are discussed briefly below. Planting costs include the market value of the plant at the nursery, the cost to transport the plant, the cost of any prelimi- nary measures for its planting (for example, the removal of a sidewalk), and labor costs of getting the tree into the ground. Planting costs occur at the beginning of a cash flow and often cost-effectiveness is determined by comparing discounted benefits with them (McPherson et al., 1998). Maintenance costs include the costs to keep the tree in a healthy state throughout its life. Some costs occur on a regular basis (like pruning every five years) and occur only once (re- moval of a ranch struck by lightning).Man hours, equipment costs, labor costs, and transportation will determine this cost (Abbott & Miller, 1987). Disease costs are of two types: preventative and responsive. Preventative disease costs are planned and predictable. Respon- sive disease costs only occur when the disease is present. Some disease control decisions involve opportunity cost (when does the cost of tree removal exceed the cost of treatment) (Sher- wood & Betters, 1981). Disease costs vary depending on spe- cies, location, tree condition, and relevant epidemics. Tree removal involves structurally unstable trees or tree re- placement by a more desirable species. It is a one-time cost like tree planting. Occasionally a tree has value (a black walnut, for example) and this cost can be turned into a benefit. Economic Component of Urban Forest Benefits Financial investments are often assessed in the context of benefits and costs and urban trees can be considered a type of financial investment. The total benefits of urban trees are a sum of the partial, or individual, benefits. These cumulative benefits can be viewed as an intangible “revenue” stream from the tree, allowing for use of the standard valuation concept of dis- counted cash flow analysis (DCF). Once revenue has a mone- tary amount and a time of occurrence in the cash flow stream, DCF is the appropriate tool to determine the current value of this future projected revenue stream. Conventional valuation software programs calculate current revenue stream value using variables like tree species, diameter, and location. In economic theory, the revenue function (revenue as a func- tion of time) for many investments is represented as a flattened s-shaped curve showing an introductory sharp increase in revenue, a steady growth phase, and a latter maturation in which the revenue growth decreases. The revenue from an ur- ban tree is a composite of its partial benefits. We evaluated the partial benefit functions from urban trees to determine if they individually followed traditional revenue structures. Essentially, we were curious if these partial benefits followed similar growth patterns over time. Urban tree benefits relate directly to the tree’s physiological structure and are influenced by factors like growth, form, size, height, and canopy. The relationship between tree physiology and benefits is not consistent for par- tial benefits. Benefits for individual trees do follow the same general growth pattern, but also exhibit some differences. Figure 1 illustrates the annual NTBC partial benefits by di- ameter breast height (DBH) for a white oak (Quercus alba) growing in Galveston, Texas. While all of the partial benefit $0 $20 $40 $60 $80 $100 $120 $140 0 13 25 38 51 64 76 89 102 114 127 DBH (cm) PV SW AQ CD NS EL Figure 1. NTBC partial benefit growth patterns for property value increase (PV), storm water reduction (SW), air quality improvement (AQ), carbon sequestration (CS), natural gas savings (NG), and electricity savings (EL) for a white oak in G a l ve s to n , Texas. Copyright © 2012 SciRes. 176 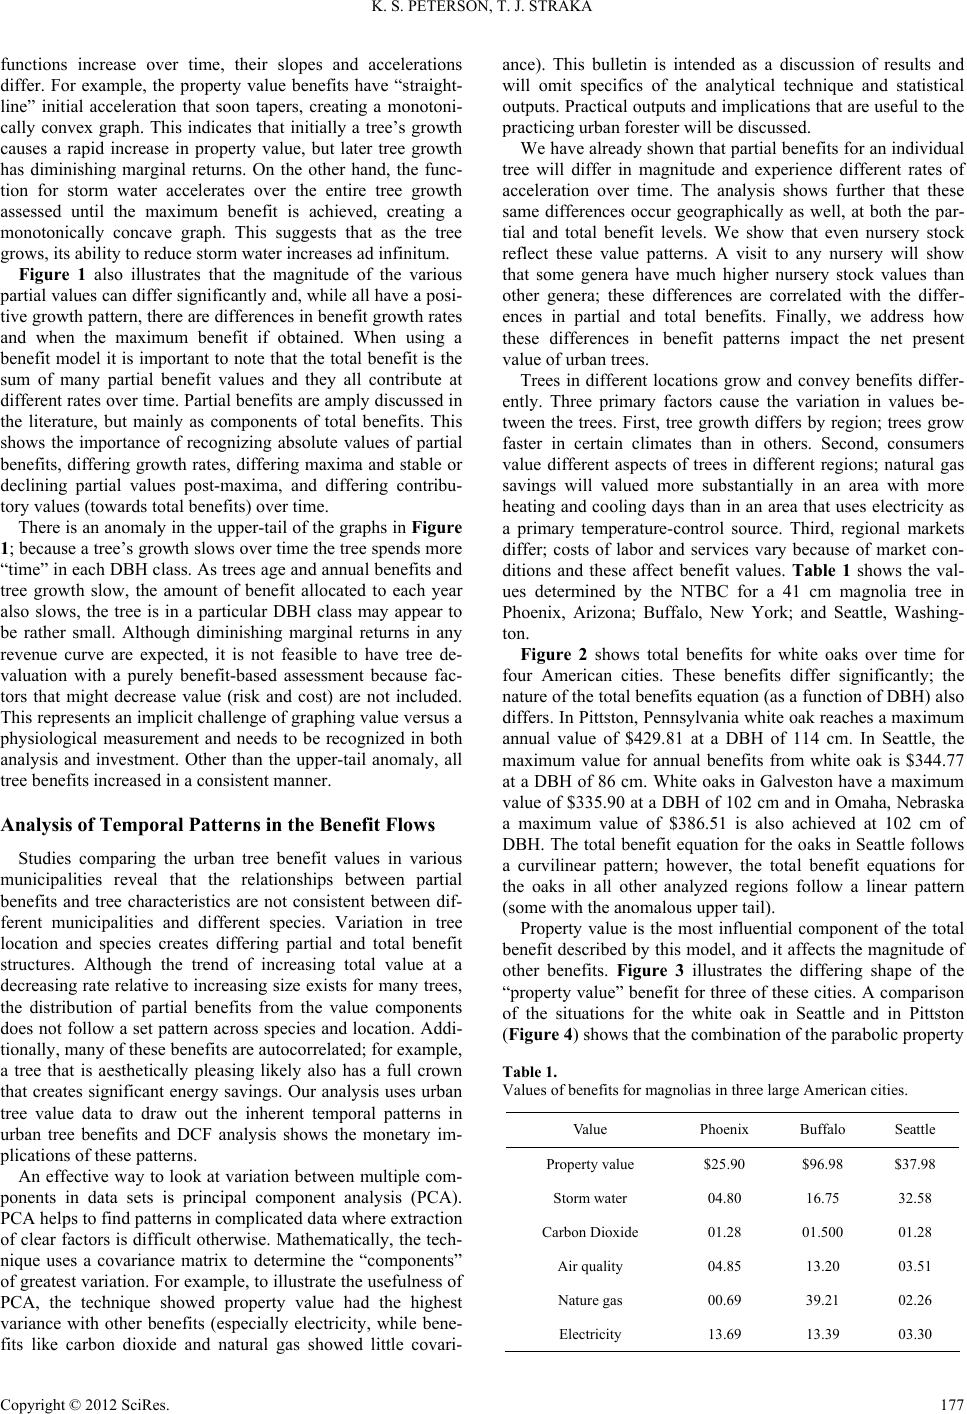 K. S. PETERSON, T. J. STRAKA functions increase over time, their slopes and accelerations differ. For example, the property value benefits have “straight- line” initial acceleration that soon tapers, creating a monotoni- cally convex graph. This indicates that initially a tree’s growth causes a rapid increase in property value, but later tree growth has diminishing marginal returns. On the other hand, the func- tion for storm water accelerates over the entire tree growth assessed until the maximum benefit is achieved, creating a monotonically concave graph. This suggests that as the tree grows, its ability to reduce storm water incr ea s es a d infini tum. Figure 1 also illustrates that the magnitude of the various partial values can differ significantly and, while all have a posi- tive growth pattern, there are differences in benefit growth rates and when the maximum benefit if obtained. When using a benefit model it is important to note that the total benefit is the sum of many partial benefit values and they all contribute at different ra tes over time . Partial benefits are amply discussed in the literature, but mainly as components of total benefits. This shows the importance of recognizing absolute values of partial benefits, differing growth rates, differing maxima and stable or declining partial values post-maxima, and differing contribu- tory values (towards total benefits) over time. There is an anomaly in the upper-tail of the graphs in Figure 1; because a tree’s growth slows over time the tree spends more “time” in each DBH class. As trees age and annual benefits and tree growth slow, the amount of benefit allocated to each year also slows, the tree is in a particular DBH class may appear to be rather small. Although diminishing marginal returns in any revenue curve are expected, it is not feasible to have tree de- valuation with a purely benefit-based assessment because fac- tors that might decrease value (risk and cost) are not included. This represents an implicit challenge of graphing value versus a physiological measurement and needs to be recognized in both analysis and investment. Other than the upper-tail anomaly, all tree benefits increased in a consistent manner. Analysis of Temporal Patterns in the Benefit Flows Studies comparing the urban tree benefit values in various municipalities reveal that the relationships between partial benefits and tree characteristics are not consistent between dif- ferent municipalities and different species. Variation in tree location and species creates differing partial and total benefit structures. Although the trend of increasing total value at a decreasing rate relative to increasing size exists for many trees, the distribution of partial benefits from the value components does not follow a set pattern across species and location. Addi- tionally, many of these benefits are autocorrelated; for example, a tree that is aesthetically pleasing likely also has a full crown that creates significant energy savings. Our analysis uses urban tree value data to draw out the inherent temporal patterns in urban tree benefits and DCF analysis shows the monetary im- plications of these patterns. An effective way to look at variation between multiple com- ponents in data sets is principal component analysis (PCA). PCA helps to find patterns in complicated data where extraction of clear factors is difficult otherwise. Mathematically, the tech- nique uses a covariance matrix to determine the “components” of greatest variation. For example, to illustrate the usefulness of PCA, the technique showed property value had the highest variance with other benefits (especially electricity, while bene- fits like carbon dioxide and natural gas showed little covari- ance). This bulletin is intended as a discussion of results and will omit specifics of the analytical technique and statistical outputs. Practical outputs and implications that are useful to the practicing urban forester will be discussed. We have already shown that partial benefits for an individual tree will differ in magnitude and experience different rates of acceleration over time. The analysis shows further that these same differences occur geographically as well, at both the par- tial and total benefit levels. We show that even nursery stock reflect these value patterns. A visit to any nursery will show that some genera have much higher nursery stock values than other genera; these differences are correlated with the differ- ences in partial and total benefits. Finally, we address how these differences in benefit patterns impact the net present value of urban trees. Trees in different locations grow and convey benefits differ- ently. Three primary factors cause the variation in values be- tween the trees. First, tree growth differs by region; trees grow faster in certain climates than in others. Second, consumers value different aspects of trees in different regions; natural gas savings will valued more substantially in an area with more heating and cooling days than in an area that uses electricity as a primary temperature-control source. Third, regional markets differ; costs of labor and services vary because of market con- ditions and these affect benefit values. Table 1 shows the val- ues determined by the NTBC for a 41 cm magnolia tree in Phoenix, Arizona; Buffalo, New York; and Seattle, Washing- ton. Figure 2 shows total benefits for white oaks over time for four American cities. These benefits differ significantly; the nature of the total benefits equation (as a function of DBH) also differs. In Pittston, Pennsylvania white oak reaches a maximum annual value of $429.81 at a DBH of 114 cm. In Seattle, the maximum value for annual benefits from white oak is $344.77 at a DBH of 86 cm. White oaks in Galveston have a maximum value of $335.90 at a DBH of 102 cm and in Omaha, Nebraska a maximum value of $386.51 is also achieved at 102 cm of DBH. The total benefit equation for the oaks in Seattle follows a curvilinear pattern; however, the total benefit equations for the oaks in all other analyzed regions follow a linear pattern (some with the anomalous upper tail). Property value is the most influential component of the total benefit described by this model, and it affects the magnitude of other benefits. Figure 3 illustrates the differing shape of the “property value” benefit for three of these cities. A comparison of the situations for the white oak in Seattle and in Pittston (Figure 4) shows that the combination of the parabolic property Table 1. Values of benefits for ma g n ol ia s in three large American cities. Value Phoenix Buffalo Seattle Property value 25.90$ 96.98$ 37.98$ Storm water 04.80 16.75 32.58 Carbon Dioxide 01.28 01.500 01.28 Air quality 04.85 13.20 03.51 Nature gas 00.69 39.2 1 02.26 Electricity 13.69 13.39 03.30 Copyright © 2012 SciRes. 177 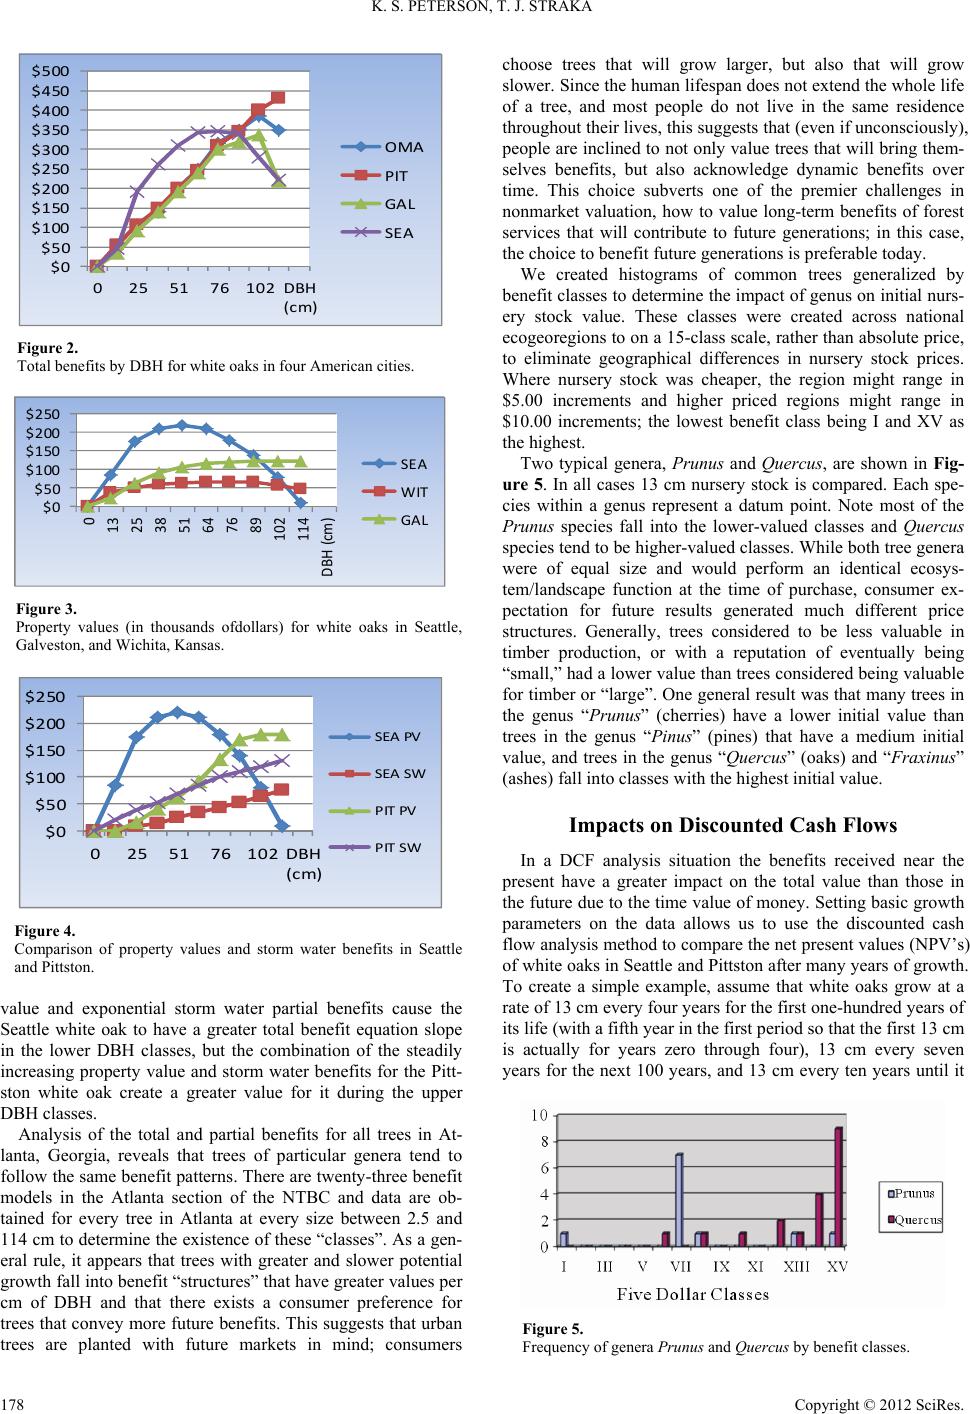 K. S. PETERSON, T. J. STRAKA $0 $50 $100 $150 $200 $250 $300 $350 $400 $450 $500 0255176102 DBH (cm) OMA PIT GAL SEA Figure 2. Total benefits by DBH for white oaks in four American cities. $0 $50 $100 $150 $200 $250 0 13 25 38 51 64 76 89 102 114 DBH (cm) SEA WIT GAL Figure 3. Property values (in thousands ofdollars) for white oaks in Seattle, Galveston, and Wichita, Kansas. $0 $50 $100 $150 $200 $250 0 255176102DBH (c m) SEA PV SEA SW PIT PV PIT SW Figure 4. Comparison of property values and storm water benefits in Seattle and Pittston. value and exponential storm water partial benefits cause the Seattle white oak to have a greater total benefit equation slope in the lower DBH classes, but the combination of the steadily increasing property value and storm water benefits for the Pitt- ston white oak create a greater value for it during the upper DBH classes. Analysis of the total and partial benefits for all trees in At- lanta, Georgia, reveals that trees of particular genera tend to follow the same benefit patterns. There are twenty-three benefit models in the Atlanta section of the NTBC and data are ob- tained for every tree in Atlanta at every size between 2.5 and 114 cm to determine the existence of these “classes”. As a gen- eral rule, it appears that trees with greater and slower potential growth fall into benefit “structures” that have greater values per cm of DBH and that there exists a consumer preference for trees that convey more future benefits. This suggests that urban trees are planted with future markets in mind; consumers choose trees that will grow larger, but also that will grow slower. Since the human lifespan does not extend the whole life of a tree, and most people do not live in the same residence throughout their lives, this suggests that (even if unconsciously), people are inclined to not only value trees that will bring them- selves benefits, but also acknowledge dynamic benefits over time. This choice subverts one of the premier challenges in nonmarket valuation, how to value long-term benefits of forest services that will contribute to future generations; in this case, the choice to benefit future generations is preferable today. We created histograms of common trees generalized by benefit classes to determine the impact of genus on initial nurs- ery stock value. These classes were created across national ecogeoregions to on a 15-class scale, rather than absolute price, to eliminate geographical differences in nursery stock prices. Where nursery stock was cheaper, the region might range in $5.00 increments and higher priced regions might range in $10.00 increments; the lowest benefit class being I and XV as the highest. Two typical genera, Prunus and Quercus, are shown in Fig- ure 5. In all cases 13 cm nursery stock is compared. Each spe- cies within a genus represent a datum point. Note most of the Prunus species fall into the lower-valued classes and Quercus species tend to be higher-valued classes. While both tree genera were of equal size and would perform an identical ecosys- tem/landscape function at the time of purchase, consumer ex- pectation for future results generated much different price structures. Generally, trees considered to be less valuable in timber production, or with a reputation of eventually being “small,” had a lower value than trees considered being valuable for timber or “large”. One general result was that many trees in the genus “Prunus” (cherries) have a lower initial value than trees in the genus “Pinus” (pines) that have a medium initial value, and trees in the genus “Quercus” (oaks) and “Fraxinus” (ashes) fall into classes with the highest initial valu e. Impacts on Discounted Cash Flows In a DCF analysis situation the benefits received near the present have a greater impact on the total value than those in the future due to the time value of money. Setting basic growth parameters on the data allows us to use the discounted cash flow analysis method to compare the net present values (NPV’s) of white oaks in Seattle and Pittston after many years of growth. To create a simple example, assume that white oaks grow at a rate of 13 cm every four years for the first one-hundred years of its life (with a fifth year in the first period so that the first 13 cm is actually for years zero through four), 13 cm every seven years for the next 100 years, and 13 cm every ten years until it Figure 5. Frequency of genera Prunus and Quercus by benefit classes. Copyright © 2012 SciRes. 178  K. S. PETERSON, T. J. STRAKA reaches the age of 260; it is possible to use the standard DCF analysis calculations for annuities to determine the NPV of the two trees. The setup of such calculation as a line-item assessment to be used in conventional forestry valuation software would appear as follows. This itemized list represents the cash flows from the Pittston white oak. In this example, shown in Table 2, the in- terest rate is five-percent. A white oak growing for 260 years and achieving 114 cm of DBH growth in Pittston is worth $1466.15. The same setup (itemized list of cash flows) is used on a white oak in Seattle. If the growth pattern and interest rate are the same, then the white oak in Seattle will be worth $1986.99 today. This result differs from the result without DCF analysis (value in Pittston greater than value in Seattle) and shows that the time value of money must be taken into account when deciding on an investment. A standard comparison, without DCF, would suggest that the Pittston white oak is a better investment; with the information from DCF it is apparent that the Seattle white oak actually is more profitable. Figure 6 shows the DCFs for the white oaks in Seattle and Pittston. The area under the curves represents the NPV. The benefits from the white oak in Seattle are obviously greater, even though its value without looking at DCF appears to be less. Additionally, the area between the two curves is the additional benefit received from the Seattle white oak. Thus, at any point in time, how much more the Seattle white oak is worth than the Pittston white oak can be calculated. The basis of the calculation is incremental analysis or the difference be- tween the two curves. This analysis could be extended to any comparison of trees using the same methodology. If the interest rate is ten percent, the NPV for both trees de- creases because of the opportunity cost of the investments. This devaluation has a greater impact on the Seattle white oak (NPV at ten-percent $601.40) than the Pittston white oak (NPV at ten-percent $540.74) because of the shape of the benefit curves; the growth of the Pittston white oaks benefits in the latter years allows it to counteract the rapidly declining slope more effec- tively. At year 100 in a ten-percent interest rate situation, both the Seattle white oak and Pittston white oak have a NPV of approximately $0.01. The opposite situation occurs when the interest rate is decreased to one percent. The Seattle white oak has a significantly greater NPV ($20663.04) than the Pittston white oak ($17079.61). A lower interest rate takes advantage of the favorable investment in trees during the early years because the opportunity cost is lessened. Another important note regarding the discounted cash flows on white oaks is that at some point in time both the Seattle and Pittston white oaks reach a point of marginal irrelevance. In the five-percent interest situation, this occurs around year 120 (de- termined graphically, or mathematically, by where the NPV is less than a given minimum value to be “worthwhile”—for this Table 2. Net present value of a Pittston white oak at a five per cent interest rate. Year Item Amount 5% @ NPV 0 - 4 1DBH 28.85$ 131.15$ 5 - 8 2DBH 46.53$ 135.74$ ---- ---- ---- ---- 251 - 260 45DBH 429.81$ 0.01$ Total analysis the minimum value decided on was one dollar). Know- ing the point of marginal irrelevance allows us to reduce the volume of cash flows in a discounted cash flow analysis. For an investment period that extremely long, different strategies for discounting may be appropriate. Some financial analysts sug- gest reduced interest rates for extremely long term investments. The species analysis showed that certain tree genera are more valuable than others as urban trees because of their expected future size and slow growth rate. In other words, consumer expectations play a significant role in the valuation of urban trees; in the face of some benefits that are immutably linked to size (such as storm water benefits), urban tree genera that are “preferred” accumulate additional benefit in the form of “prop- erty value.” In Figure 7, the benefit curves for oak (Quercus) and holly (Ilex ) are contrasted. Even though holly has an ini- tially greater slope, relative to its scale, its benefits do not have the same magnitude as the benefits of oak in the long run. This initial increasing slope is due to the faster growth rate of the holly and its ability to create more physical benefits, such as carbon sequestration, which correspond to growth rate. This analysis does not change when discounting the benefits from the trees. At a five-pe rcent discount rate, over time , the bene fits of oak are still greater. Unlike the comparison between white oaks in Pittson and Seattle where the slope of the Seattle oak’s growth enabled it to, after discounting, have a higher NPV than the white oak in Pittson, the Atlanta Ilex’s slow early growth rate never allows it to achieve equality with the Quercus, even after discounting. To maximize an urban tree investment, choosing trees with greater potential growth and longer life spans indicates high importance. Table 3 shows an observation of partial benefits revealing more about this pattern; for “lower class” trees, the percent of Figure 6. Discounted NPV for white oaks in Pittston and Seattle. $0 $100 $200 $300 $400 0255176102DBH (c m) Quercus Ilex Figure 7. Benefit curves for genera Quercus (oak) and Ilex (holly) in Atlanta. 1466.15$ Copyright © 2012 SciRes. 179 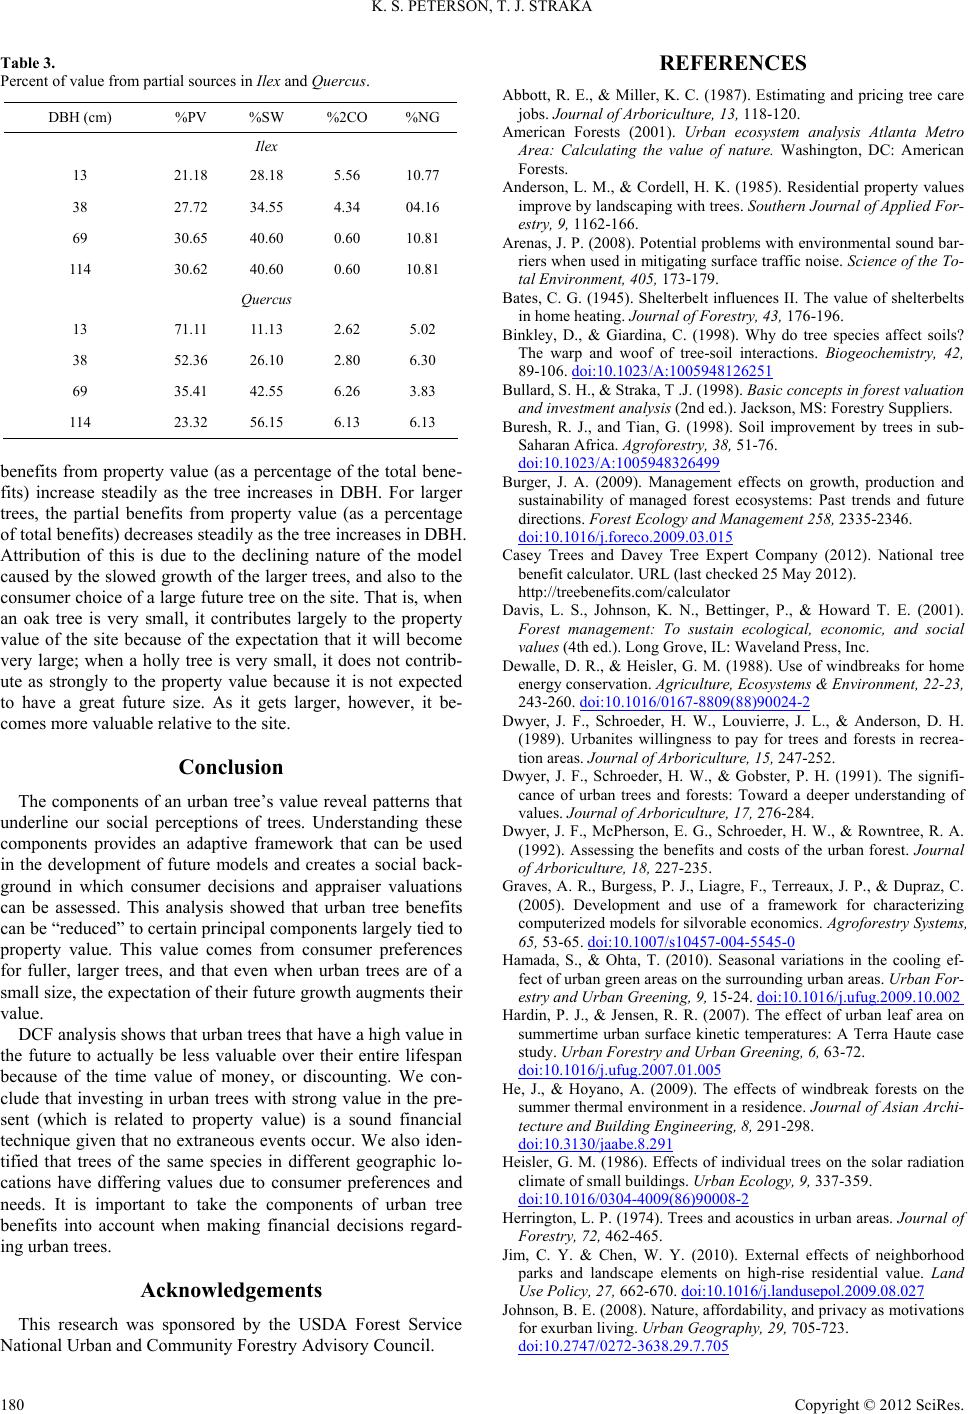 K. S. PETERSON, T. J. STRAKA Table 3. Percent of value from partial sources in Ilex and Quercus. DBH (cm) PV% SW% CO2% NG% Ilex 13 21.18 28.18 5.56 10.77 38 27.72 34.55 4.34 04.16 69 30.65 40.60 0.60 10.81 114 30.62 40.60 0.60 10.81 Quercus 13 71.11 11.13 2.62 5.02 38 52.36 26.10 2.80 6.30 69 35.41 42.55 6.26 3.83 114 23.32 56.15 6.13 6.13 benefits from property value (as a percentage of the total bene- fits) increase steadily as the tree increases in DBH. For larger trees, the partial benefits from property value (as a percentage of total benefits) decreases steadily as the tree increases in DBH. Attribution of this is due to the declining nature of the model caused by the slowed growth of the larger trees, and also to the consumer choice of a large future tree on the site. That is, when an oak tree is very small, it contributes largely to the property value of the site because of the expectation that it will become very large; when a holly tree is very small, it does not contrib- ute as strongly to the property value because it is not expected to have a great future size. As it gets larger, however, it be- comes more valuab l e re lative to the site. Conclusion The components of an urban tree’s value reveal patterns that underline our social perceptions of trees. Understanding these components provides an adaptive framework that can be used in the development of future models and creates a social back- ground in which consumer decisions and appraiser valuations can be assessed. This analysis showed that urban tree benefits can be “reduced” to certain principal components largely tied to property value. This value comes from consumer preferences for fuller, larger trees, and that even when urban trees are of a small size, the expectation of their future growth augments their value. DCF analysis shows that urban trees that have a high value in the future to actually be less valuable over their entire lifespan because of the time value of money, or discounting. We con- clude that investing in urban trees with strong value in the pre- sent (which is related to property value) is a sound financial technique given that no extraneous events occur. We also iden- tified that trees of the same species in different geographic lo- cations have differing values due to consumer preferences and needs. It is important to take the components of urban tree benefits into account when making financial decisions regard- ing urban trees. Acknowledgements This research was sponsored by the USDA Forest Service National Urban and Community Forestry Advisory Council. REFERENCES Abbott, R. E., & Miller, K. C. (1987). Estimating and pricing tree care jobs. Journal of Arboriculture, 13, 118-120. American Forests (2001). Urban ecosystem analysis Atlanta Metro Area: Calculating the value of nature. Washington, DC: American Forests. Anderson, L. M., & Cordell, H. K. (1985). Residential property values improve by landscaping with trees. Southern Journal of Applied For- estry, 9, 1162-166. Arenas, J. P. (2008). Potential problems with environmental sound bar- riers when used in mitigating surface traffic noise. Science of the To- tal Environment, 405, 173-179. Bates, C. G. (1945). Shelterbelt influences II. The value of shelterbelts in home heating. Jour na l o f Forestry, 43, 176-196. Binkley, D., & Giardina, C. (1998). Why do tree species affect soils? The warp and woof of tree-soil interactions. Biogeochemistry, 42, 89-106. doi:10.1023/A:1005948126251 Bullard, S. H., & Straka, T .J. (1998). Basic concepts in forest valuation and investment analysis (2nd ed.). Jackson, MS: Forestry Suppli ers. Buresh, R. J., and Tian, G. (1998). Soil improvement by trees in sub- Saharan Africa. Agroforestry, 38, 51-76. doi:10.1023/A:1005948326499 Burger, J. A. (2009). Management effects on growth, production and sustainability of managed forest ecosystems: Past trends and future directions. Forest Ecology and Ma nagement 258, 2335-2346. doi:10.1016/j.foreco.2009.03.015 Casey Trees and Davey Tree Expert Company (2012). National tree benefit calculator. URL (last checked 25 May 2012). http://treebenefits.com/calculator Davis, L. S., Johnson, K. N., Bettinger, P., & Howard T. E. (2001). Forest management: To sustain ecological, economic, and social values (4th ed.). Long Grove, I L: Waveland Press, Inc. Dewalle, D. R., & Heisler, G. M. (1988). Use of windbreaks for home energy conservation. Agriculture, Ecosystems & Environment, 22-23, 243-260. doi:10.1016/0167-8809(88)90024-2 Dwyer, J. F., Schroeder, H. W., Louvierre, J. L., & Anderson, D. H. (1989). Urbanites willingness to pay for trees and forests in recrea- tion areas. Journal of Arboriculture, 15, 247-252. Dwyer, J. F., Schroeder, H. W., & Gobster, P. H. (1991). The signifi- cance of urban trees and forests: Toward a deeper understanding of values. Journal of Arboriculture, 17, 276-284. Dwyer, J. F., McPherson, E. G., Schroeder, H . W., & Rowntree, R. A. (1992). Assessing the benefits and costs of the urban forest. Journal of Arboriculture, 18, 227-235. Graves, A. R., Burgess, P. J., Liagre, F., Terreaux, J. P., & Dupraz, C. (2005). Development and use of a framework for characterizing computerized models for silvorable economics. Agroforestry Systems, 65, 53-65. doi:10.1007/s10457-004-5545-0 Hamada, S., & Ohta, T. (2010). Seasonal variations in the cooling ef- fect of urban green areas on the surrounding urban areas. Urban For- estry and Urban Greening, 9, 15-24. doi:10.1016/j.ufug.2009.10.002 Hardin, P. J., & Jensen, R. R. (2007). The effect of urban leaf area on summertime urban surface kinetic temperatures: A Terra Haute case study. Urban Fores tr y an d U r b an G reening, 6, 63-72. doi:10.1016/j.ufug.2007.01.005 He, J., & Hoyano, A. (2009). The effects of windbreak forests on the summer thermal environment in a residence. Journal of Asian Archi- tecture and Building Engineering, 8, 291-298. doi:10.3130/jaabe.8.291 Heisler, G. M. (1986). Effects of individual trees on the solar radiation climate of small buildings. Urban Ecology, 9, 337-359. doi:10.1016/0304-4009(86)90008-2 Herrington, L. P. (1974). Trees and acoustics in urban areas. Journal of Forestry, 72, 462-465. Jim, C. Y. & Chen, W. Y. (2010). External effects of neighborhood parks and landscape elements on high-rise residential value. Land Use Policy, 27, 662-670. doi:10.1016/j.landusepol.2009.08.027 Johnson, B. E. (2008). Nature, affordability, and privacy as motivations for exurban living. Urba n Geo graphy, 29, 705-723. doi:10.2747/0272-3638.29.7.705 Copyright © 2012 SciRes. 180  K. S. PETERSON, T. J. STRAKA Copyright © 2012 SciRes. 181 Joye, Y., Willems, K., Brengman, M., & Wolf, K. (2010). The effects. of urban retail greenery on consumer experience: Reviewing the evidence from a restoration perspective. Urban Forestry & Urban Greening, 9, 57-64. doi:10.1016/j.ufug.2009.10.001 Klemperer, W. D. (1996). Forest resource economics and finance. New York: McGraw-Hill, Inc. Leonard, R. E., & Parr, S. B. (1970). Trees as a sound barrier. Journal of Forestry, 68, 282-283. Lin, X.-J., Barrington, S., Choinière, D., & Prasher, S. (2007). Simula- tion of the effect of windbreaks on odour dispersion. Biosystems En- gineering, 3, 347-363. doi:10.1016/j.b iosystemseng. 2007.07.010 Lorenzo, A. B., Blanche, C. A., Qi, Y., & Guidry, M. M. (2000). As- sessing residents’ willingness to pay to preserve the community ur- ban forest: A small-city case. Journal of Arboriculture, 26, 319-325. Martin, C. W. Maggio, R. C., & Appel, D. N. (1989). The contributory value of trees to residential property in Austin, Texas Metropolitan Area. Journal of Arboriculture, 15, 72-76. Matsuoka, R. H., & Kaplan, R. (2008). People’s needs in the urban landscape: Analysis of landscape and urban planning contributions. Landscape and Urban Planning, 84, 7-19. doi:10.1016/j.landurbplan.2007.09.009 McPherson, E. G., Herrington, L. P., & Heisler, G .M. (1988). Impacts of vegetation on residential property values. Energy and Buildings, 12, 41-51. doi:10.1016/0378-7788(88)90054-0 McPherson, E. G. (1992). Accounting for the benefits and costs of ur- ban greenspace. Landscape and Urb an Planning, 22, 41-51. doi:10.1016/0169-2046(92)90006-L McPherson, E. G., & Rowntree, R. A. (1993). Energy conservation po- tential of urban tree planting. Jour na l of Arboriculture, 19, 321-331. McPherson, E. G., Scott, K. I., & Simpson, J. R. (1998). Estimating cost effectiveness of residential yard trees for improving air quality in Sacramento, California, using existing models. Atmospheric Envi- ronment, 32, 75-84. McPherson, E. G. (1999). Benefit-cost analysis of Modesto’s municipal urban forest. Journal of Arboric ulture, 25, 235-248. McPherson, E. G., & Simpson, J. R. (2002). A compari son of municipal forest benefits and costs in Modesto and Santa Monica, California, USA. Urban Forestry & Urban Greening, 1, 61-74. doi:10.1078/1618-8667-00007 McPherson, E. G., Simpson, J. R., Peper, P. J., Maco, S. E., & Xiao, Q. (2005). Municipal forest benefits and costs in five US cities. Journal of Forestry, 103, 411-416. Nair, P. K. R., Nair, V. D., Kumar, B. M., & Haile, S. G. (2009). Soil carbon sequestration in tropical agroforestry systems: A feasibility approach. Environmental Science & Policy, 12, 1099-1111. doi:10.1016/j.envsci.2009.01.010 Nielsen, A. B., & Møller, F. (2008). Is coppice a potential for urban forestry? The social perspective. Urban Forestry & Urban Greening, 7, 129-138. doi:10.1016/j.ufug.2008.02.005 Nilsson, K., Sangster, M., Gallis, C., Hartig, T., deVries, S., Seeland, K., & Schipperijn, J. (Eds.) (2011). Forests, Trees and Human Health. New York, NY: Springer. Nordh, H., Hartig, T., Hagerhall, C. M., & Fry, G. (2009). Components of small urban parks that predict the possibility for restoration. Ur- ban Forestry & Urban Greening, 8, 225-235. doi:10.1016/j.ufug.2009.06.003 Nowak, D. J. (1993). Atmospheric carbon reduction by urban trees. Journal of Environmental Management, 37, 207-217. doi:10.1006/jema.1993.1017 Nowak, D. J., & Crane, D. E. (2002). Carbon storage and sequestration by urban trees in the USA. Environmental Pollution, 116, 381-389. doi:10.1016/S0269-7491(01)00214-7 Nowak, D. J., Crane, D. E., & Dwyer, J.F. (2002). Compensatory value of urban trees in the United States. Journal of Arboriculture, 28, 194- 199. Nowak, D. J., Walton, J. T., Dwyer, J. F., Kaya, L. G., & Myeong, S. (2005). The increasing influence of urban environments on US forest management. Journal of Forestry, 103, 377-382. Nowak, D. J., Crane, D. E., & Stevens, J. C. (2006). Air pollution re- moval by urban trees and shrubs in the United States. Urban For- estry & Urban Greening, 4, 115-123. doi:10.1016/j.ufug.2006.01.007 Peterson, K. S., & Straka, T. J. (2011). Specialized discounted cash flow analysis formulas for valuation of benefits and costs of urban trees and forests. Arboricul t ur e and Urban Forestry, 37, 200-206. Price, C. (2003). Quantifying the aesthetic benefits of urban forests. Ur- ban Forestry & Urban Greening, 1, 123-133. doi:10.1078/1618-8667-00013 Rowntree, R. A. (1984). Forest canopy cover and land use in four East- ern United States cities. Urban Ecology, 8, 55-67. doi:10.1016/0304-4009(84)90006-8 Sanders, R. A. (1984). Some determinants of urban forest structure. Ur- ban Ecology, 8, 13-27. doi:10.1016/0304-4009(84)90004-4 Sanders, R. A. (1986). Urban forest vegetation impacts on the urban hydrology of Dayton, Ohio. Urban Ecology, 9, 361-376. doi:10.1016/0304-4009(86)90009-4 Sherwood, S. C., & Betters, D. R. (1981). Benefit-cost analysis of mu- nicipal Dutch elm disease control programs in Colorado. Journal of Arboriculture, 7, 291-298. Silva, F. O. T., Wehmann, A., Henze, H-J, & Model, N. (2006). Ability of plant-based surface technology to improve urban water cycle and mesoclimate. Urban Forestry & Urban Greening, 4, 145-158. doi:10.1016/j.ufug.2005.12.004 Sinden, J. A., & Worrell, A. C. (1979). Underprice values: Decisions without market prices. New York: Wiley-Interscience. Stenger, A., Harou, P., & Navrud, S. (2009). Valuing environmental goods and services derived from forests. Journal of Forest Econom- ics, 15, 1-14. doi:10.1016/j.jfe.2008.03.001 Stump, L. M., & Binkley, D. (1993). Relationship between litter quality and nitrogen availability in Rocky Mountain forests. Canadian Jour- nal of Forest Research, 23, 492-502. doi:10.1139/x93-067 Templeton, S. R., & Goldman, G. (1996). Urban forestry adds $3.8 billion to California economy. Ca l i f o r n i a A g r i c u l t u re , 5 0 , 6-10. doi:10.3733/ca.v050n01p6 Tietenberg, T. H., & Lewis, L. (2008). Environmental and natural re- source economics (8th ed.). Reading , PA: Addison-Wesley. Tyrväinen, L., & Miettinen, A. (2000). Property prices and urban forest amenities. Journal of Environmental Economics and Management, 39, 206-223. Tyrväinen, L., & Väänänen, H. (1998). The economic value of urban forest amenities: An application of the contingent valuation method. Landscape and Urban Planning, 43, 106-118. Tyrväinen, L., Silvennoinen, H., & Kolehmainen, O. (2003).Ecological and aesthetic values in urban forest management. Urban Forestry & Urban Greening, 1, 135-149. doi:10.1078/1618-8667-00014 Ulrich, R. S. (1984). View through a window may influence recovery from surgery. Science, 224, 420-421. USDA Forest Service (2012). Urban Forest Effects Model—UFORE. Newtown Square, PA: USDA Forest Service, Northern Research Sta- tion. URL (last checked 25 May 201 2 ) . http://nrs.fs.fed.us/tools/ufore Velande, M. D., Fry, G., & Tviet, M. (2007). Urban forestry for human health and well-being. Urban Forestry & Urban Greening, 6, 195- 197. doi:10.1016/j.ufug.2007.09.001 Walsh, R. G., Ward, F. A., & Olienyk, J. P. (1989). Recreational de- mand for trees in national forests. Journal of Environmental Man- agement, 28, 255-268. Wolf, K. (2004). What could we lose? The economic value of urban forests. Proceedings of sixth Canadian urban forest conference (pp. 21-28). Ottawa, Ontar io: Tree Canada Foundation. Wright, B. (1988). Forested windbreaks. Agriculture, Ecosystems & En- vironment, 22-23, 261-280. Yang, J., McBride, J., Zhou, J., & Sun, Z. (2005). The urban forest in Beijing and its role in air pollution reduction. Urban Forest & Urban Greening, 3, 65-78. doi:10.1016/j.ufug.2004.09.001 Zhang, Y., Hussain, A., Deng, J., & Letson, N. (2007). Public attitudes toward trees and supporting urban tree programs. Environment and Behavior, 39, 797-814. doi:10.1177/0013916506292326
|